

Key Insights
The US pet care and services industry is a robust and expanding market, projected to reach a substantial size, driven by several key factors. The increasing humanization of pets, coupled with rising disposable incomes and a growing preference for pet ownership, fuels significant demand for premium pet products and services. This trend translates into higher spending on pet food, encompassing both premium brands and specialized diets catering to specific health needs or allergies. Similarly, the demand for grooming services, pet transportation, boarding, and personalized pet-sitting options is experiencing notable growth. The market segmentation reveals strong performance across various pet types, with dogs and cats leading the way, followed by horses and other animals. This broad appeal indicates the widespread adoption of pets and the diverse needs they present to owners. Technological advancements also play a significant role. Online platforms facilitating pet services booking and e-commerce sales of pet products further enhance convenience and expand market accessibility. Competition is fierce, with established players like Nestlé and Mars Incorporated alongside innovative startups like PetBacker and Rover Inc vying for market share. Regional variations exist, with potentially higher growth rates in regions with higher pet ownership rates and disposable incomes. The forecast period suggests a continued upward trajectory, reflecting the enduring strength of the human-animal bond and the expanding scope of the pet care industry.
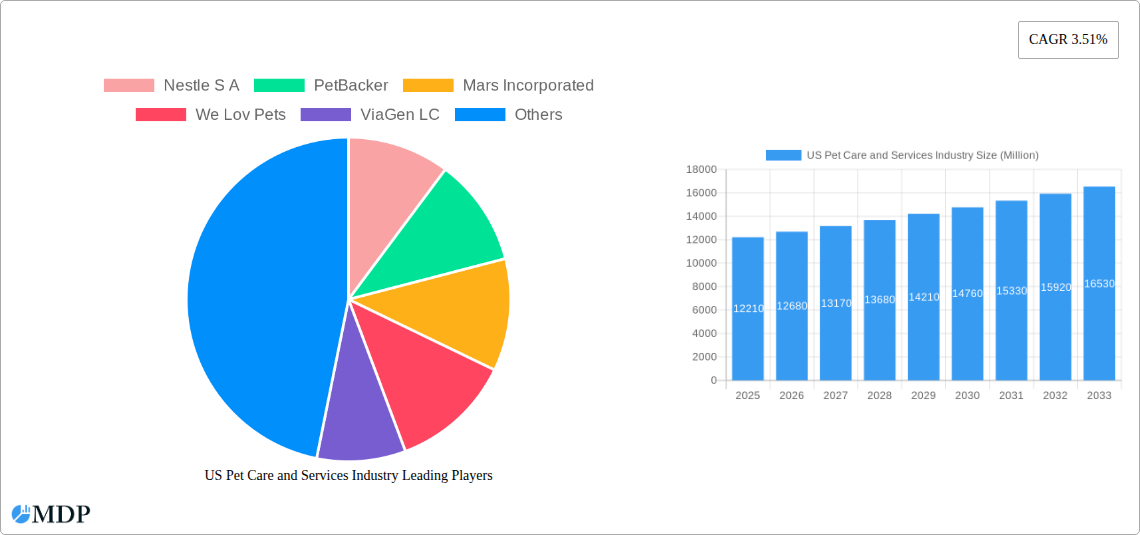
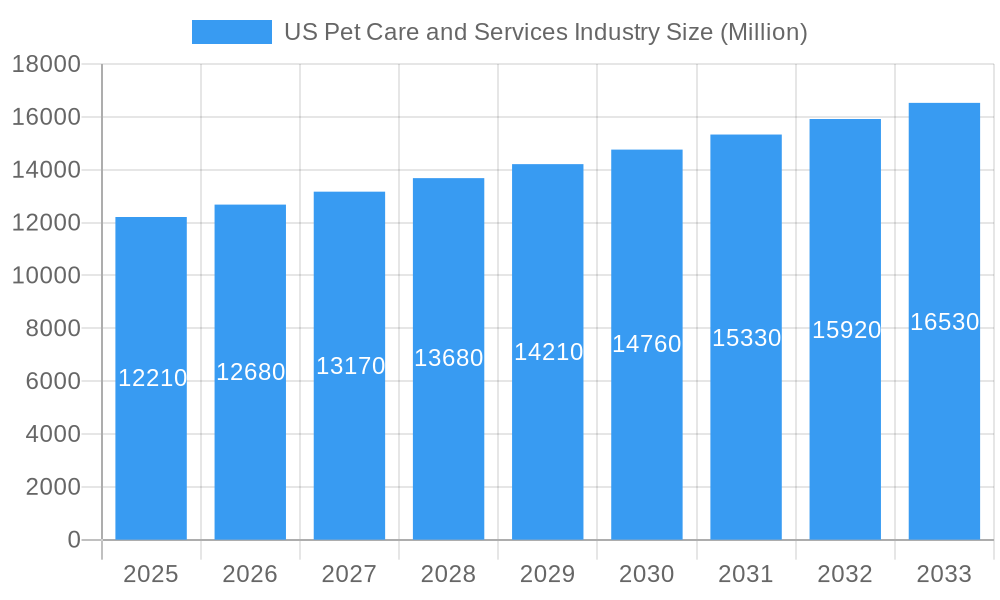
US Pet Care and Services Industry Market Size (In Billion)
The historical period (2019-2024) saw considerable growth, laying the groundwork for the anticipated expansion in the forecast period (2025-2033). A 3.51% CAGR indicates a consistent, albeit moderate, expansion rate. This sustained growth can be attributed to ongoing consumer preference shifts, such as the increased willingness to spend on high-quality pet products and services. The ongoing trend of pet humanization is critical, driving the demand for specialized services and premium products. While some potential restraints, such as economic downturns or changes in pet ownership trends, could impact the market, the overall outlook remains optimistic. The large number of established players and emerging competitors demonstrates the market's attractiveness and high potential. Continued innovation in pet care products and services, combined with evolving consumer preferences, is expected to drive industry growth throughout the forecast period, making it a lucrative market for investment and expansion.
US Pet Care and Services Industry Company Market Share
US Pet Care and Services Industry: A Comprehensive Market Report (2019-2033)
This in-depth report provides a comprehensive analysis of the US Pet Care and Services industry, offering invaluable insights for stakeholders, investors, and industry professionals. Covering the period 2019-2033, with a focus on 2025, this report unveils market dynamics, key trends, leading players, and future opportunities within this rapidly expanding sector. The report utilizes a robust methodology, incorporating both historical data (2019-2024) and projections (2025-2033) to deliver accurate and actionable intelligence. Expected market value figures are presented in Millions (M).
US Pet Care and Services Industry Market Dynamics & Concentration
The US pet care market showcases significant dynamism driven by several key factors. Market concentration is moderate, with a few large players like Nestle S.A. and Mars Incorporated holding substantial shares, while numerous smaller businesses cater to niche segments. Innovation plays a crucial role, with new product developments in pet food, grooming, and services continually emerging. Regulatory frameworks, including pet food safety standards and animal welfare laws, influence market operations. Product substitutes, such as homemade pet food, exist but generally possess limited market penetration due to convenience and specialized nutritional needs. End-user trends show a growing preference for premium pet products and personalized services, reflective of the humanization of pets. Mergers and acquisitions (M&A) activity is frequent, with an estimated xx M&A deals annually over the forecast period (2025-2033), reflecting consolidation and expansion strategies amongst market participants. Nestle S.A. and Mars Incorporated individually account for an estimated xx% and xx% market share respectively, underscoring their dominant presence. Smaller players, however, demonstrate significant agility and innovation.
US Pet Care and Services Industry Industry Trends & Analysis
The US pet care industry exhibits robust growth, with a projected Compound Annual Growth Rate (CAGR) of xx% during 2025-2033. Several factors fuel this expansion. Rising pet ownership, particularly among millennials and Gen Z, contributes significantly to increased demand. The humanization of pets, leading to increased spending on premium food, healthcare, and services, is another driving force. Technological disruptions, such as telehealth for pets and AI-powered pet monitoring devices, are transforming the industry, improving access to care and boosting convenience. Consumer preferences are shifting toward natural, organic, and specialized pet products catering to specific dietary needs or breeds. Intense competition fosters innovation and drives down prices, while maintaining a premium segment to cater to the higher end. Market penetration of premium pet food is expected to reach xx% by 2033, reflecting this trend.
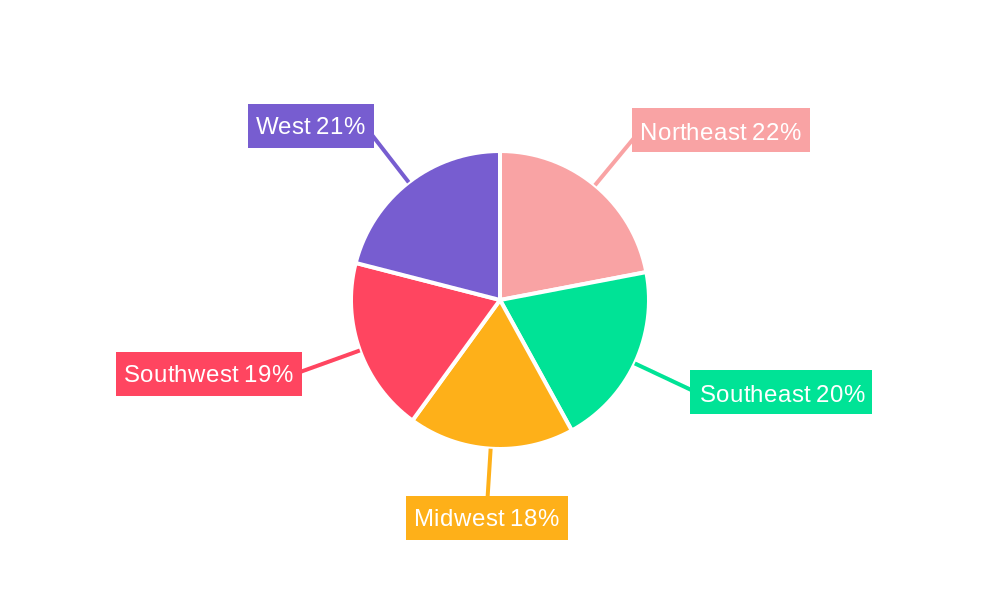
Leading Markets & Segments in US Pet Care and Services Industry
The US pet care market is geographically diverse, with no single region dominating. However, the densely populated coastal regions and states with a higher per capita income tend to experience higher sales.
By Pet Type: Dogs consistently dominate the market, accounting for approximately xx% of total revenue in 2025, driven by high ownership rates and significant spending on food, healthcare, and services. Cats represent the second-largest segment, with a market share of approximately xx%. Horses and other animals contribute smaller but growing segments.
By Product Type: Pet food forms the largest segment, commanding over xx% of the market in 2025 due to essential needs and frequent purchases. Grooming products and pet care supplies contribute significantly, fuelled by increasing consumer awareness and adoption of specialized care practices.
By Service Type: Pet grooming holds a leading position within services, followed by pet sitting and pet walking. The growing demand for convenient and reliable pet care solutions drives the growth of these service categories. Pet boarding, pet transportation, and other specialized services also contribute to overall market expansion. Key drivers for these segments include increasing urbanization, busy lifestyles of pet owners, and enhanced pet wellness awareness. Economic factors like disposable income and pet insurance coverage also influence market trends.
US Pet Care and Services Industry Product Developments
Recent innovations in pet care encompass advanced pet food formulations addressing specific dietary and health needs (e.g., Bark&Spark's probiotic chews), technologically advanced grooming tools, and personalized pet health monitoring devices. These advancements aim to improve pet wellness, enhance convenience for owners, and deliver competitive advantages. The industry is seeing a clear shift toward natural, organic, and specialized products reflecting a growing consumer awareness.
Key Drivers of US Pet Care and Services Industry Growth
The US pet care market's growth is driven by several factors:
- Rising Pet Ownership: An increasing number of households own pets, fueling demand.
- Increased Pet Humanization: Pets are increasingly viewed as family members, leading to higher spending.
- Technological Advancements: Innovations in pet food, healthcare, and services enhance convenience and care.
- Economic Growth: Improved disposable incomes enable higher spending on pet-related products and services.
- Regulatory Changes: Stricter regulations around pet food safety and animal welfare lead to better quality products.
Challenges in the US Pet Care and Services Industry Market
The industry faces challenges including:
- Supply Chain Disruptions: Global supply chain issues impact raw material availability and product pricing.
- Competition: Intense competition, particularly within pet food and services, requires constant innovation.
- Economic Downturns: Economic slowdowns can reduce consumer spending on non-essential pet-related items.
- Regulatory Compliance: Maintaining compliance with changing regulations, such as ingredient labeling and animal welfare standards, presents a hurdle.
Emerging Opportunities in US Pet Care and Services Industry
Emerging opportunities include:
- Technological Breakthroughs: AI-driven pet healthcare solutions and advanced pet food technologies hold substantial potential.
- Strategic Partnerships: Collaborations between pet care providers and veterinary clinics or technology companies create new revenue streams and service offerings.
- Market Expansion: Expanding into underserved rural markets or exploring niche pet segments (e.g., exotic pets) offers growth opportunities.
Leading Players in the US Pet Care and Services Industry Sector
- Nestle S.A.
- PetBacker
- Mars Incorporated
- We Lov Pets
- ViaGen LC
- Petmate
- Tail Blazers
- PetSmart LLC
- Hill's Pet Nutrition Inc
- Rover Inc
Key Milestones in US Pet Care and Services Industry Industry
- February 2023: Bark&Spark launched a new Probiotic Chew for Dogs, enhancing the premium dog food segment and reflecting the trend toward specialized nutrition.
- January 2023: Village Pet Care launched, indicating a shift toward consolidated pet care services and highlighting the importance of strategic investment within the industry.
Strategic Outlook for US Pet Care and Services Industry Market
The US pet care market holds immense long-term potential, driven by sustained pet ownership growth, increased pet humanization, and continuous technological innovation. Strategic opportunities include developing specialized products and services, leveraging technological advancements to improve efficiency and customer experience, and focusing on building strong brands and customer loyalty. The industry's future growth will be influenced by adapting to changing consumer preferences, navigating supply chain challenges, and proactively complying with evolving regulatory frameworks.
US Pet Care and Services Industry Segmentation
-
1. Pet Type
- 1.1. Cat
- 1.2. Dog
- 1.3. Horse
- 1.4. Other Animals
-
2. Product Type
- 2.1. Pet Food
- 2.2. Grooming Products
- 2.3. Pet Care
-
3. Service Type
- 3.1. Grooming
- 3.2. Pet Transportation
- 3.3. Pet Boarding
- 3.4. Pet Sitting
- 3.5. Pet Walking
- 3.6. Other Services
US Pet Care and Services Industry Segmentation By Geography
-
1. North America
- 1.1. United States
- 1.2. Canada
- 1.3. Mexico
-
2. South America
- 2.1. Brazil
- 2.2. Argentina
- 2.3. Rest of South America
-
3. Europe
- 3.1. United Kingdom
- 3.2. Germany
- 3.3. France
- 3.4. Italy
- 3.5. Spain
- 3.6. Russia
- 3.7. Benelux
- 3.8. Nordics
- 3.9. Rest of Europe
-
4. Middle East & Africa
- 4.1. Turkey
- 4.2. Israel
- 4.3. GCC
- 4.4. North Africa
- 4.5. South Africa
- 4.6. Rest of Middle East & Africa
-
5. Asia Pacific
- 5.1. China
- 5.2. India
- 5.3. Japan
- 5.4. South Korea
- 5.5. ASEAN
- 5.6. Oceania
- 5.7. Rest of Asia Pacific
US Pet Care and Services Industry Regional Market Share
Geographic Coverage of US Pet Care and Services Industry
US Pet Care and Services Industry REPORT HIGHLIGHTS
| Aspects | Details |
|---|---|
| Study Period | 2020-2034 |
| Base Year | 2025 |
| Estimated Year | 2026 |
| Forecast Period | 2026-2034 |
| Historical Period | 2020-2025 |
| Growth Rate | CAGR of 3.51% from 2020-2034 |
| Segmentation |
|
Table of Contents
- 1. Introduction
- 1.1. Research Scope
- 1.2. Market Segmentation
- 1.3. Research Objective
- 1.4. Definitions and Assumptions
- 2. Executive Summary
- 2.1. Market Snapshot
- 3. Market Dynamics
- 3.1. Market Drivers
- 3.2. Market Restrains
- 3.3. Market Trends
- 3.4. Market Opportunities
- 4. Market Factor Analysis
- 4.1. Porters Five Forces
- 4.1.1. Bargaining Power of Suppliers
- 4.1.2. Bargaining Power of Buyers
- 4.1.3. Threat of New Entrants
- 4.1.4. Threat of Substitutes
- 4.1.5. Competitive Rivalry
- 4.2. PESTEL analysis
- 4.3. BCG Analysis
- 4.3.1. Stars (High Growth, High Market Share)
- 4.3.2. Cash Cows (Low Growth, High Market Share)
- 4.3.3. Question Mark (High Growth, Low Market Share)
- 4.3.4. Dogs (Low Growth, Low Market Share)
- 4.4. Ansoff Matrix Analysis
- 4.5. Supply Chain Analysis
- 4.6. Regulatory Landscape
- 4.7. Current Market Potential and Opportunity Assessment (TAM–SAM–SOM Framework)
- 4.8. MDP Analyst Note
- 4.1. Porters Five Forces
- 5. Market Analysis, Insights and Forecast 2021-2033
- 5.1. Market Analysis, Insights and Forecast - by Pet Type
- 5.1.1. Cat
- 5.1.2. Dog
- 5.1.3. Horse
- 5.1.4. Other Animals
- 5.2. Market Analysis, Insights and Forecast - by Product Type
- 5.2.1. Pet Food
- 5.2.2. Grooming Products
- 5.2.3. Pet Care
- 5.3. Market Analysis, Insights and Forecast - by Service Type
- 5.3.1. Grooming
- 5.3.2. Pet Transportation
- 5.3.3. Pet Boarding
- 5.3.4. Pet Sitting
- 5.3.5. Pet Walking
- 5.3.6. Other Services
- 5.4. Market Analysis, Insights and Forecast - by Region
- 5.4.1. North America
- 5.4.2. South America
- 5.4.3. Europe
- 5.4.4. Middle East & Africa
- 5.4.5. Asia Pacific
- 5.1. Market Analysis, Insights and Forecast - by Pet Type
- 6. Global US Pet Care and Services Industry Analysis, Insights and Forecast, 2021-2033
- 6.1. Market Analysis, Insights and Forecast - by Pet Type
- 6.1.1. Cat
- 6.1.2. Dog
- 6.1.3. Horse
- 6.1.4. Other Animals
- 6.2. Market Analysis, Insights and Forecast - by Product Type
- 6.2.1. Pet Food
- 6.2.2. Grooming Products
- 6.2.3. Pet Care
- 6.3. Market Analysis, Insights and Forecast - by Service Type
- 6.3.1. Grooming
- 6.3.2. Pet Transportation
- 6.3.3. Pet Boarding
- 6.3.4. Pet Sitting
- 6.3.5. Pet Walking
- 6.3.6. Other Services
- 6.1. Market Analysis, Insights and Forecast - by Pet Type
- 7. North America US Pet Care and Services Industry Analysis, Insights and Forecast, 2020-2032
- 7.1. Market Analysis, Insights and Forecast - by Pet Type
- 7.1.1. Cat
- 7.1.2. Dog
- 7.1.3. Horse
- 7.1.4. Other Animals
- 7.2. Market Analysis, Insights and Forecast - by Product Type
- 7.2.1. Pet Food
- 7.2.2. Grooming Products
- 7.2.3. Pet Care
- 7.3. Market Analysis, Insights and Forecast - by Service Type
- 7.3.1. Grooming
- 7.3.2. Pet Transportation
- 7.3.3. Pet Boarding
- 7.3.4. Pet Sitting
- 7.3.5. Pet Walking
- 7.3.6. Other Services
- 7.1. Market Analysis, Insights and Forecast - by Pet Type
- 8. South America US Pet Care and Services Industry Analysis, Insights and Forecast, 2020-2032
- 8.1. Market Analysis, Insights and Forecast - by Pet Type
- 8.1.1. Cat
- 8.1.2. Dog
- 8.1.3. Horse
- 8.1.4. Other Animals
- 8.2. Market Analysis, Insights and Forecast - by Product Type
- 8.2.1. Pet Food
- 8.2.2. Grooming Products
- 8.2.3. Pet Care
- 8.3. Market Analysis, Insights and Forecast - by Service Type
- 8.3.1. Grooming
- 8.3.2. Pet Transportation
- 8.3.3. Pet Boarding
- 8.3.4. Pet Sitting
- 8.3.5. Pet Walking
- 8.3.6. Other Services
- 8.1. Market Analysis, Insights and Forecast - by Pet Type
- 9. Europe US Pet Care and Services Industry Analysis, Insights and Forecast, 2020-2032
- 9.1. Market Analysis, Insights and Forecast - by Pet Type
- 9.1.1. Cat
- 9.1.2. Dog
- 9.1.3. Horse
- 9.1.4. Other Animals
- 9.2. Market Analysis, Insights and Forecast - by Product Type
- 9.2.1. Pet Food
- 9.2.2. Grooming Products
- 9.2.3. Pet Care
- 9.3. Market Analysis, Insights and Forecast - by Service Type
- 9.3.1. Grooming
- 9.3.2. Pet Transportation
- 9.3.3. Pet Boarding
- 9.3.4. Pet Sitting
- 9.3.5. Pet Walking
- 9.3.6. Other Services
- 9.1. Market Analysis, Insights and Forecast - by Pet Type
- 10. Middle East & Africa US Pet Care and Services Industry Analysis, Insights and Forecast, 2020-2032
- 10.1. Market Analysis, Insights and Forecast - by Pet Type
- 10.1.1. Cat
- 10.1.2. Dog
- 10.1.3. Horse
- 10.1.4. Other Animals
- 10.2. Market Analysis, Insights and Forecast - by Product Type
- 10.2.1. Pet Food
- 10.2.2. Grooming Products
- 10.2.3. Pet Care
- 10.3. Market Analysis, Insights and Forecast - by Service Type
- 10.3.1. Grooming
- 10.3.2. Pet Transportation
- 10.3.3. Pet Boarding
- 10.3.4. Pet Sitting
- 10.3.5. Pet Walking
- 10.3.6. Other Services
- 10.1. Market Analysis, Insights and Forecast - by Pet Type
- 11. Asia Pacific US Pet Care and Services Industry Analysis, Insights and Forecast, 2020-2032
- 11.1. Market Analysis, Insights and Forecast - by Pet Type
- 11.1.1. Cat
- 11.1.2. Dog
- 11.1.3. Horse
- 11.1.4. Other Animals
- 11.2. Market Analysis, Insights and Forecast - by Product Type
- 11.2.1. Pet Food
- 11.2.2. Grooming Products
- 11.2.3. Pet Care
- 11.3. Market Analysis, Insights and Forecast - by Service Type
- 11.3.1. Grooming
- 11.3.2. Pet Transportation
- 11.3.3. Pet Boarding
- 11.3.4. Pet Sitting
- 11.3.5. Pet Walking
- 11.3.6. Other Services
- 11.1. Market Analysis, Insights and Forecast - by Pet Type
- 12. Competitive Analysis
- 12.1. Company Profiles
- 12.1.1 Nestle S A
- 12.1.1.1. Company Overview
- 12.1.1.2. Products
- 12.1.1.3. Company Financials
- 12.1.1.4. SWOT Analysis
- 12.1.2 PetBacker
- 12.1.2.1. Company Overview
- 12.1.2.2. Products
- 12.1.2.3. Company Financials
- 12.1.2.4. SWOT Analysis
- 12.1.3 Mars Incorporated
- 12.1.3.1. Company Overview
- 12.1.3.2. Products
- 12.1.3.3. Company Financials
- 12.1.3.4. SWOT Analysis
- 12.1.4 We Lov Pets
- 12.1.4.1. Company Overview
- 12.1.4.2. Products
- 12.1.4.3. Company Financials
- 12.1.4.4. SWOT Analysis
- 12.1.5 ViaGen LC
- 12.1.5.1. Company Overview
- 12.1.5.2. Products
- 12.1.5.3. Company Financials
- 12.1.5.4. SWOT Analysis
- 12.1.6 Petmate
- 12.1.6.1. Company Overview
- 12.1.6.2. Products
- 12.1.6.3. Company Financials
- 12.1.6.4. SWOT Analysis
- 12.1.7 Tail Blazers
- 12.1.7.1. Company Overview
- 12.1.7.2. Products
- 12.1.7.3. Company Financials
- 12.1.7.4. SWOT Analysis
- 12.1.8 PetSmart LLC
- 12.1.8.1. Company Overview
- 12.1.8.2. Products
- 12.1.8.3. Company Financials
- 12.1.8.4. SWOT Analysis
- 12.1.9 Hill's Pet Nutrition Inc
- 12.1.9.1. Company Overview
- 12.1.9.2. Products
- 12.1.9.3. Company Financials
- 12.1.9.4. SWOT Analysis
- 12.1.10 Rover Inc
- 12.1.10.1. Company Overview
- 12.1.10.2. Products
- 12.1.10.3. Company Financials
- 12.1.10.4. SWOT Analysis
- 12.1.1 Nestle S A
- 12.2. Market Entropy
- 12.2.1 Company's Key Areas Served
- 12.2.2 Recent Developments
- 12.3. Company Market Share Analysis 2025
- 12.3.1 Top 5 Companies Market Share Analysis
- 12.3.2 Top 3 Companies Market Share Analysis
- 12.4. List of Potential Customers
- 13. Research Methodology
List of Figures
- Figure 1: Global US Pet Care and Services Industry Revenue Breakdown (Million, %) by Region 2025 & 2033
- Figure 2: Global US Pet Care and Services Industry Volume Breakdown (K Unit, %) by Region 2025 & 2033
- Figure 3: North America US Pet Care and Services Industry Revenue (Million), by Pet Type 2025 & 2033
- Figure 4: North America US Pet Care and Services Industry Volume (K Unit), by Pet Type 2025 & 2033
- Figure 5: North America US Pet Care and Services Industry Revenue Share (%), by Pet Type 2025 & 2033
- Figure 6: North America US Pet Care and Services Industry Volume Share (%), by Pet Type 2025 & 2033
- Figure 7: North America US Pet Care and Services Industry Revenue (Million), by Product Type 2025 & 2033
- Figure 8: North America US Pet Care and Services Industry Volume (K Unit), by Product Type 2025 & 2033
- Figure 9: North America US Pet Care and Services Industry Revenue Share (%), by Product Type 2025 & 2033
- Figure 10: North America US Pet Care and Services Industry Volume Share (%), by Product Type 2025 & 2033
- Figure 11: North America US Pet Care and Services Industry Revenue (Million), by Service Type 2025 & 2033
- Figure 12: North America US Pet Care and Services Industry Volume (K Unit), by Service Type 2025 & 2033
- Figure 13: North America US Pet Care and Services Industry Revenue Share (%), by Service Type 2025 & 2033
- Figure 14: North America US Pet Care and Services Industry Volume Share (%), by Service Type 2025 & 2033
- Figure 15: North America US Pet Care and Services Industry Revenue (Million), by Country 2025 & 2033
- Figure 16: North America US Pet Care and Services Industry Volume (K Unit), by Country 2025 & 2033
- Figure 17: North America US Pet Care and Services Industry Revenue Share (%), by Country 2025 & 2033
- Figure 18: North America US Pet Care and Services Industry Volume Share (%), by Country 2025 & 2033
- Figure 19: South America US Pet Care and Services Industry Revenue (Million), by Pet Type 2025 & 2033
- Figure 20: South America US Pet Care and Services Industry Volume (K Unit), by Pet Type 2025 & 2033
- Figure 21: South America US Pet Care and Services Industry Revenue Share (%), by Pet Type 2025 & 2033
- Figure 22: South America US Pet Care and Services Industry Volume Share (%), by Pet Type 2025 & 2033
- Figure 23: South America US Pet Care and Services Industry Revenue (Million), by Product Type 2025 & 2033
- Figure 24: South America US Pet Care and Services Industry Volume (K Unit), by Product Type 2025 & 2033
- Figure 25: South America US Pet Care and Services Industry Revenue Share (%), by Product Type 2025 & 2033
- Figure 26: South America US Pet Care and Services Industry Volume Share (%), by Product Type 2025 & 2033
- Figure 27: South America US Pet Care and Services Industry Revenue (Million), by Service Type 2025 & 2033
- Figure 28: South America US Pet Care and Services Industry Volume (K Unit), by Service Type 2025 & 2033
- Figure 29: South America US Pet Care and Services Industry Revenue Share (%), by Service Type 2025 & 2033
- Figure 30: South America US Pet Care and Services Industry Volume Share (%), by Service Type 2025 & 2033
- Figure 31: South America US Pet Care and Services Industry Revenue (Million), by Country 2025 & 2033
- Figure 32: South America US Pet Care and Services Industry Volume (K Unit), by Country 2025 & 2033
- Figure 33: South America US Pet Care and Services Industry Revenue Share (%), by Country 2025 & 2033
- Figure 34: South America US Pet Care and Services Industry Volume Share (%), by Country 2025 & 2033
- Figure 35: Europe US Pet Care and Services Industry Revenue (Million), by Pet Type 2025 & 2033
- Figure 36: Europe US Pet Care and Services Industry Volume (K Unit), by Pet Type 2025 & 2033
- Figure 37: Europe US Pet Care and Services Industry Revenue Share (%), by Pet Type 2025 & 2033
- Figure 38: Europe US Pet Care and Services Industry Volume Share (%), by Pet Type 2025 & 2033
- Figure 39: Europe US Pet Care and Services Industry Revenue (Million), by Product Type 2025 & 2033
- Figure 40: Europe US Pet Care and Services Industry Volume (K Unit), by Product Type 2025 & 2033
- Figure 41: Europe US Pet Care and Services Industry Revenue Share (%), by Product Type 2025 & 2033
- Figure 42: Europe US Pet Care and Services Industry Volume Share (%), by Product Type 2025 & 2033
- Figure 43: Europe US Pet Care and Services Industry Revenue (Million), by Service Type 2025 & 2033
- Figure 44: Europe US Pet Care and Services Industry Volume (K Unit), by Service Type 2025 & 2033
- Figure 45: Europe US Pet Care and Services Industry Revenue Share (%), by Service Type 2025 & 2033
- Figure 46: Europe US Pet Care and Services Industry Volume Share (%), by Service Type 2025 & 2033
- Figure 47: Europe US Pet Care and Services Industry Revenue (Million), by Country 2025 & 2033
- Figure 48: Europe US Pet Care and Services Industry Volume (K Unit), by Country 2025 & 2033
- Figure 49: Europe US Pet Care and Services Industry Revenue Share (%), by Country 2025 & 2033
- Figure 50: Europe US Pet Care and Services Industry Volume Share (%), by Country 2025 & 2033
- Figure 51: Middle East & Africa US Pet Care and Services Industry Revenue (Million), by Pet Type 2025 & 2033
- Figure 52: Middle East & Africa US Pet Care and Services Industry Volume (K Unit), by Pet Type 2025 & 2033
- Figure 53: Middle East & Africa US Pet Care and Services Industry Revenue Share (%), by Pet Type 2025 & 2033
- Figure 54: Middle East & Africa US Pet Care and Services Industry Volume Share (%), by Pet Type 2025 & 2033
- Figure 55: Middle East & Africa US Pet Care and Services Industry Revenue (Million), by Product Type 2025 & 2033
- Figure 56: Middle East & Africa US Pet Care and Services Industry Volume (K Unit), by Product Type 2025 & 2033
- Figure 57: Middle East & Africa US Pet Care and Services Industry Revenue Share (%), by Product Type 2025 & 2033
- Figure 58: Middle East & Africa US Pet Care and Services Industry Volume Share (%), by Product Type 2025 & 2033
- Figure 59: Middle East & Africa US Pet Care and Services Industry Revenue (Million), by Service Type 2025 & 2033
- Figure 60: Middle East & Africa US Pet Care and Services Industry Volume (K Unit), by Service Type 2025 & 2033
- Figure 61: Middle East & Africa US Pet Care and Services Industry Revenue Share (%), by Service Type 2025 & 2033
- Figure 62: Middle East & Africa US Pet Care and Services Industry Volume Share (%), by Service Type 2025 & 2033
- Figure 63: Middle East & Africa US Pet Care and Services Industry Revenue (Million), by Country 2025 & 2033
- Figure 64: Middle East & Africa US Pet Care and Services Industry Volume (K Unit), by Country 2025 & 2033
- Figure 65: Middle East & Africa US Pet Care and Services Industry Revenue Share (%), by Country 2025 & 2033
- Figure 66: Middle East & Africa US Pet Care and Services Industry Volume Share (%), by Country 2025 & 2033
- Figure 67: Asia Pacific US Pet Care and Services Industry Revenue (Million), by Pet Type 2025 & 2033
- Figure 68: Asia Pacific US Pet Care and Services Industry Volume (K Unit), by Pet Type 2025 & 2033
- Figure 69: Asia Pacific US Pet Care and Services Industry Revenue Share (%), by Pet Type 2025 & 2033
- Figure 70: Asia Pacific US Pet Care and Services Industry Volume Share (%), by Pet Type 2025 & 2033
- Figure 71: Asia Pacific US Pet Care and Services Industry Revenue (Million), by Product Type 2025 & 2033
- Figure 72: Asia Pacific US Pet Care and Services Industry Volume (K Unit), by Product Type 2025 & 2033
- Figure 73: Asia Pacific US Pet Care and Services Industry Revenue Share (%), by Product Type 2025 & 2033
- Figure 74: Asia Pacific US Pet Care and Services Industry Volume Share (%), by Product Type 2025 & 2033
- Figure 75: Asia Pacific US Pet Care and Services Industry Revenue (Million), by Service Type 2025 & 2033
- Figure 76: Asia Pacific US Pet Care and Services Industry Volume (K Unit), by Service Type 2025 & 2033
- Figure 77: Asia Pacific US Pet Care and Services Industry Revenue Share (%), by Service Type 2025 & 2033
- Figure 78: Asia Pacific US Pet Care and Services Industry Volume Share (%), by Service Type 2025 & 2033
- Figure 79: Asia Pacific US Pet Care and Services Industry Revenue (Million), by Country 2025 & 2033
- Figure 80: Asia Pacific US Pet Care and Services Industry Volume (K Unit), by Country 2025 & 2033
- Figure 81: Asia Pacific US Pet Care and Services Industry Revenue Share (%), by Country 2025 & 2033
- Figure 82: Asia Pacific US Pet Care and Services Industry Volume Share (%), by Country 2025 & 2033
List of Tables
- Table 1: Global US Pet Care and Services Industry Revenue Million Forecast, by Pet Type 2020 & 2033
- Table 2: Global US Pet Care and Services Industry Volume K Unit Forecast, by Pet Type 2020 & 2033
- Table 3: Global US Pet Care and Services Industry Revenue Million Forecast, by Product Type 2020 & 2033
- Table 4: Global US Pet Care and Services Industry Volume K Unit Forecast, by Product Type 2020 & 2033
- Table 5: Global US Pet Care and Services Industry Revenue Million Forecast, by Service Type 2020 & 2033
- Table 6: Global US Pet Care and Services Industry Volume K Unit Forecast, by Service Type 2020 & 2033
- Table 7: Global US Pet Care and Services Industry Revenue Million Forecast, by Region 2020 & 2033
- Table 8: Global US Pet Care and Services Industry Volume K Unit Forecast, by Region 2020 & 2033
- Table 9: Global US Pet Care and Services Industry Revenue Million Forecast, by Pet Type 2020 & 2033
- Table 10: Global US Pet Care and Services Industry Volume K Unit Forecast, by Pet Type 2020 & 2033
- Table 11: Global US Pet Care and Services Industry Revenue Million Forecast, by Product Type 2020 & 2033
- Table 12: Global US Pet Care and Services Industry Volume K Unit Forecast, by Product Type 2020 & 2033
- Table 13: Global US Pet Care and Services Industry Revenue Million Forecast, by Service Type 2020 & 2033
- Table 14: Global US Pet Care and Services Industry Volume K Unit Forecast, by Service Type 2020 & 2033
- Table 15: Global US Pet Care and Services Industry Revenue Million Forecast, by Country 2020 & 2033
- Table 16: Global US Pet Care and Services Industry Volume K Unit Forecast, by Country 2020 & 2033
- Table 17: United States US Pet Care and Services Industry Revenue (Million) Forecast, by Application 2020 & 2033
- Table 18: United States US Pet Care and Services Industry Volume (K Unit) Forecast, by Application 2020 & 2033
- Table 19: Canada US Pet Care and Services Industry Revenue (Million) Forecast, by Application 2020 & 2033
- Table 20: Canada US Pet Care and Services Industry Volume (K Unit) Forecast, by Application 2020 & 2033
- Table 21: Mexico US Pet Care and Services Industry Revenue (Million) Forecast, by Application 2020 & 2033
- Table 22: Mexico US Pet Care and Services Industry Volume (K Unit) Forecast, by Application 2020 & 2033
- Table 23: Global US Pet Care and Services Industry Revenue Million Forecast, by Pet Type 2020 & 2033
- Table 24: Global US Pet Care and Services Industry Volume K Unit Forecast, by Pet Type 2020 & 2033
- Table 25: Global US Pet Care and Services Industry Revenue Million Forecast, by Product Type 2020 & 2033
- Table 26: Global US Pet Care and Services Industry Volume K Unit Forecast, by Product Type 2020 & 2033
- Table 27: Global US Pet Care and Services Industry Revenue Million Forecast, by Service Type 2020 & 2033
- Table 28: Global US Pet Care and Services Industry Volume K Unit Forecast, by Service Type 2020 & 2033
- Table 29: Global US Pet Care and Services Industry Revenue Million Forecast, by Country 2020 & 2033
- Table 30: Global US Pet Care and Services Industry Volume K Unit Forecast, by Country 2020 & 2033
- Table 31: Brazil US Pet Care and Services Industry Revenue (Million) Forecast, by Application 2020 & 2033
- Table 32: Brazil US Pet Care and Services Industry Volume (K Unit) Forecast, by Application 2020 & 2033
- Table 33: Argentina US Pet Care and Services Industry Revenue (Million) Forecast, by Application 2020 & 2033
- Table 34: Argentina US Pet Care and Services Industry Volume (K Unit) Forecast, by Application 2020 & 2033
- Table 35: Rest of South America US Pet Care and Services Industry Revenue (Million) Forecast, by Application 2020 & 2033
- Table 36: Rest of South America US Pet Care and Services Industry Volume (K Unit) Forecast, by Application 2020 & 2033
- Table 37: Global US Pet Care and Services Industry Revenue Million Forecast, by Pet Type 2020 & 2033
- Table 38: Global US Pet Care and Services Industry Volume K Unit Forecast, by Pet Type 2020 & 2033
- Table 39: Global US Pet Care and Services Industry Revenue Million Forecast, by Product Type 2020 & 2033
- Table 40: Global US Pet Care and Services Industry Volume K Unit Forecast, by Product Type 2020 & 2033
- Table 41: Global US Pet Care and Services Industry Revenue Million Forecast, by Service Type 2020 & 2033
- Table 42: Global US Pet Care and Services Industry Volume K Unit Forecast, by Service Type 2020 & 2033
- Table 43: Global US Pet Care and Services Industry Revenue Million Forecast, by Country 2020 & 2033
- Table 44: Global US Pet Care and Services Industry Volume K Unit Forecast, by Country 2020 & 2033
- Table 45: United Kingdom US Pet Care and Services Industry Revenue (Million) Forecast, by Application 2020 & 2033
- Table 46: United Kingdom US Pet Care and Services Industry Volume (K Unit) Forecast, by Application 2020 & 2033
- Table 47: Germany US Pet Care and Services Industry Revenue (Million) Forecast, by Application 2020 & 2033
- Table 48: Germany US Pet Care and Services Industry Volume (K Unit) Forecast, by Application 2020 & 2033
- Table 49: France US Pet Care and Services Industry Revenue (Million) Forecast, by Application 2020 & 2033
- Table 50: France US Pet Care and Services Industry Volume (K Unit) Forecast, by Application 2020 & 2033
- Table 51: Italy US Pet Care and Services Industry Revenue (Million) Forecast, by Application 2020 & 2033
- Table 52: Italy US Pet Care and Services Industry Volume (K Unit) Forecast, by Application 2020 & 2033
- Table 53: Spain US Pet Care and Services Industry Revenue (Million) Forecast, by Application 2020 & 2033
- Table 54: Spain US Pet Care and Services Industry Volume (K Unit) Forecast, by Application 2020 & 2033
- Table 55: Russia US Pet Care and Services Industry Revenue (Million) Forecast, by Application 2020 & 2033
- Table 56: Russia US Pet Care and Services Industry Volume (K Unit) Forecast, by Application 2020 & 2033
- Table 57: Benelux US Pet Care and Services Industry Revenue (Million) Forecast, by Application 2020 & 2033
- Table 58: Benelux US Pet Care and Services Industry Volume (K Unit) Forecast, by Application 2020 & 2033
- Table 59: Nordics US Pet Care and Services Industry Revenue (Million) Forecast, by Application 2020 & 2033
- Table 60: Nordics US Pet Care and Services Industry Volume (K Unit) Forecast, by Application 2020 & 2033
- Table 61: Rest of Europe US Pet Care and Services Industry Revenue (Million) Forecast, by Application 2020 & 2033
- Table 62: Rest of Europe US Pet Care and Services Industry Volume (K Unit) Forecast, by Application 2020 & 2033
- Table 63: Global US Pet Care and Services Industry Revenue Million Forecast, by Pet Type 2020 & 2033
- Table 64: Global US Pet Care and Services Industry Volume K Unit Forecast, by Pet Type 2020 & 2033
- Table 65: Global US Pet Care and Services Industry Revenue Million Forecast, by Product Type 2020 & 2033
- Table 66: Global US Pet Care and Services Industry Volume K Unit Forecast, by Product Type 2020 & 2033
- Table 67: Global US Pet Care and Services Industry Revenue Million Forecast, by Service Type 2020 & 2033
- Table 68: Global US Pet Care and Services Industry Volume K Unit Forecast, by Service Type 2020 & 2033
- Table 69: Global US Pet Care and Services Industry Revenue Million Forecast, by Country 2020 & 2033
- Table 70: Global US Pet Care and Services Industry Volume K Unit Forecast, by Country 2020 & 2033
- Table 71: Turkey US Pet Care and Services Industry Revenue (Million) Forecast, by Application 2020 & 2033
- Table 72: Turkey US Pet Care and Services Industry Volume (K Unit) Forecast, by Application 2020 & 2033
- Table 73: Israel US Pet Care and Services Industry Revenue (Million) Forecast, by Application 2020 & 2033
- Table 74: Israel US Pet Care and Services Industry Volume (K Unit) Forecast, by Application 2020 & 2033
- Table 75: GCC US Pet Care and Services Industry Revenue (Million) Forecast, by Application 2020 & 2033
- Table 76: GCC US Pet Care and Services Industry Volume (K Unit) Forecast, by Application 2020 & 2033
- Table 77: North Africa US Pet Care and Services Industry Revenue (Million) Forecast, by Application 2020 & 2033
- Table 78: North Africa US Pet Care and Services Industry Volume (K Unit) Forecast, by Application 2020 & 2033
- Table 79: South Africa US Pet Care and Services Industry Revenue (Million) Forecast, by Application 2020 & 2033
- Table 80: South Africa US Pet Care and Services Industry Volume (K Unit) Forecast, by Application 2020 & 2033
- Table 81: Rest of Middle East & Africa US Pet Care and Services Industry Revenue (Million) Forecast, by Application 2020 & 2033
- Table 82: Rest of Middle East & Africa US Pet Care and Services Industry Volume (K Unit) Forecast, by Application 2020 & 2033
- Table 83: Global US Pet Care and Services Industry Revenue Million Forecast, by Pet Type 2020 & 2033
- Table 84: Global US Pet Care and Services Industry Volume K Unit Forecast, by Pet Type 2020 & 2033
- Table 85: Global US Pet Care and Services Industry Revenue Million Forecast, by Product Type 2020 & 2033
- Table 86: Global US Pet Care and Services Industry Volume K Unit Forecast, by Product Type 2020 & 2033
- Table 87: Global US Pet Care and Services Industry Revenue Million Forecast, by Service Type 2020 & 2033
- Table 88: Global US Pet Care and Services Industry Volume K Unit Forecast, by Service Type 2020 & 2033
- Table 89: Global US Pet Care and Services Industry Revenue Million Forecast, by Country 2020 & 2033
- Table 90: Global US Pet Care and Services Industry Volume K Unit Forecast, by Country 2020 & 2033
- Table 91: China US Pet Care and Services Industry Revenue (Million) Forecast, by Application 2020 & 2033
- Table 92: China US Pet Care and Services Industry Volume (K Unit) Forecast, by Application 2020 & 2033
- Table 93: India US Pet Care and Services Industry Revenue (Million) Forecast, by Application 2020 & 2033
- Table 94: India US Pet Care and Services Industry Volume (K Unit) Forecast, by Application 2020 & 2033
- Table 95: Japan US Pet Care and Services Industry Revenue (Million) Forecast, by Application 2020 & 2033
- Table 96: Japan US Pet Care and Services Industry Volume (K Unit) Forecast, by Application 2020 & 2033
- Table 97: South Korea US Pet Care and Services Industry Revenue (Million) Forecast, by Application 2020 & 2033
- Table 98: South Korea US Pet Care and Services Industry Volume (K Unit) Forecast, by Application 2020 & 2033
- Table 99: ASEAN US Pet Care and Services Industry Revenue (Million) Forecast, by Application 2020 & 2033
- Table 100: ASEAN US Pet Care and Services Industry Volume (K Unit) Forecast, by Application 2020 & 2033
- Table 101: Oceania US Pet Care and Services Industry Revenue (Million) Forecast, by Application 2020 & 2033
- Table 102: Oceania US Pet Care and Services Industry Volume (K Unit) Forecast, by Application 2020 & 2033
- Table 103: Rest of Asia Pacific US Pet Care and Services Industry Revenue (Million) Forecast, by Application 2020 & 2033
- Table 104: Rest of Asia Pacific US Pet Care and Services Industry Volume (K Unit) Forecast, by Application 2020 & 2033
Frequently Asked Questions
1. What is the projected Compound Annual Growth Rate (CAGR) of the US Pet Care and Services Industry?
The projected CAGR is approximately 3.51%.
2. Which companies are prominent players in the US Pet Care and Services Industry?
Key companies in the market include Nestle S A, PetBacker, Mars Incorporated, We Lov Pets, ViaGen LC, Petmate, Tail Blazers, PetSmart LLC, Hill's Pet Nutrition Inc, Rover Inc.
3. What are the main segments of the US Pet Care and Services Industry?
The market segments include Pet Type , Product Type, Service Type.
4. Can you provide details about the market size?
The market size is estimated to be USD 12.21 Million as of 2022.
5. What are some drivers contributing to market growth?
Rising Pet Ownership and Pet Insurance; Increased Adoption of Technology for Pet Care.
6. What are the notable trends driving market growth?
Dog Segment is Expected to Account for the Large Market Share Over the Forecast Period.
7. Are there any restraints impacting market growth?
High Cost of Products and Services.
8. Can you provide examples of recent developments in the market?
February 2023: Bark&Spark released a new Probiotic Chew for Dogs. Bark&Spark's chews are touted as perfectly dosed and compatible with any dog's diet, with just a few chews a day giving the desired effects.
9. What pricing options are available for accessing the report?
Pricing options include single-user, multi-user, and enterprise licenses priced at USD 3800, USD 4500, and USD 5800 respectively.
10. Is the market size provided in terms of value or volume?
The market size is provided in terms of value, measured in Million and volume, measured in K Unit.
11. Are there any specific market keywords associated with the report?
Yes, the market keyword associated with the report is "US Pet Care and Services Industry," which aids in identifying and referencing the specific market segment covered.
12. How do I determine which pricing option suits my needs best?
The pricing options vary based on user requirements and access needs. Individual users may opt for single-user licenses, while businesses requiring broader access may choose multi-user or enterprise licenses for cost-effective access to the report.
13. Are there any additional resources or data provided in the US Pet Care and Services Industry report?
While the report offers comprehensive insights, it's advisable to review the specific contents or supplementary materials provided to ascertain if additional resources or data are available.
14. How can I stay updated on further developments or reports in the US Pet Care and Services Industry?
To stay informed about further developments, trends, and reports in the US Pet Care and Services Industry, consider subscribing to industry newsletters, following relevant companies and organizations, or regularly checking reputable industry news sources and publications.
Methodology
Step 1 - Identification of Relevant Samples Size from Population Database


Step 2 - Approaches for Defining Global Market Size (Value, Volume* & Price*)

Note*: In applicable scenarios
Step 3 - Data Sources
Primary Research
- Web Analytics
- Survey Reports
- Research Institute
- Latest Research Reports
- Opinion Leaders
Secondary Research
- Annual Reports
- White Paper
- Latest Press Release
- Industry Association
- Paid Database
- Investor Presentations

Step 4 - Data Triangulation
Involves using different sources of information in order to increase the validity of a study
These sources are likely to be stakeholders in a program - participants, other researchers, program staff, other community members, and so on.
Then we put all data in single framework & apply various statistical tools to find out the dynamic on the market.
During the analysis stage, feedback from the stakeholder groups would be compared to determine areas of agreement as well as areas of divergence