

Key Insights
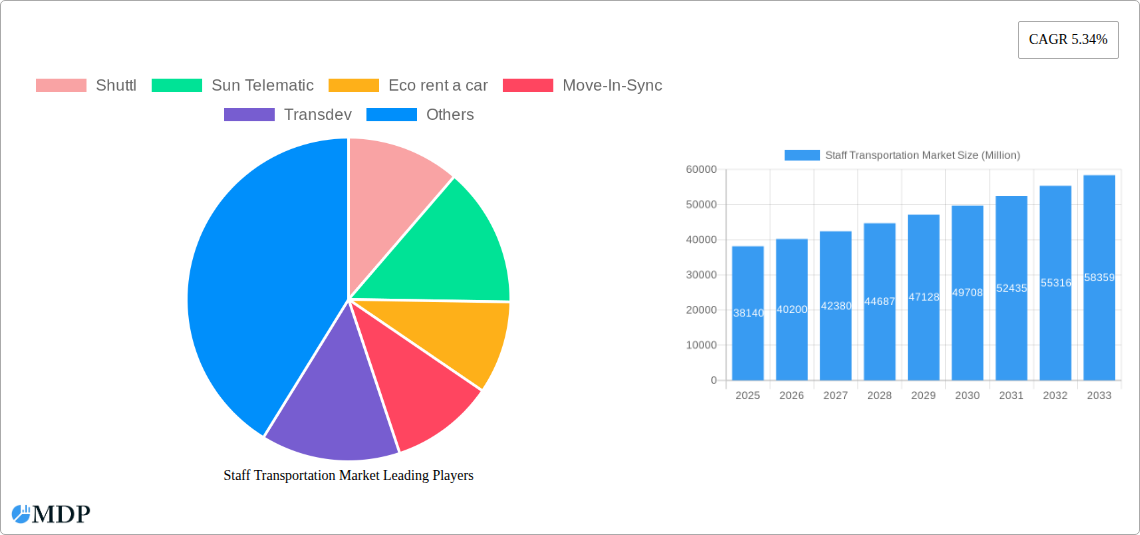
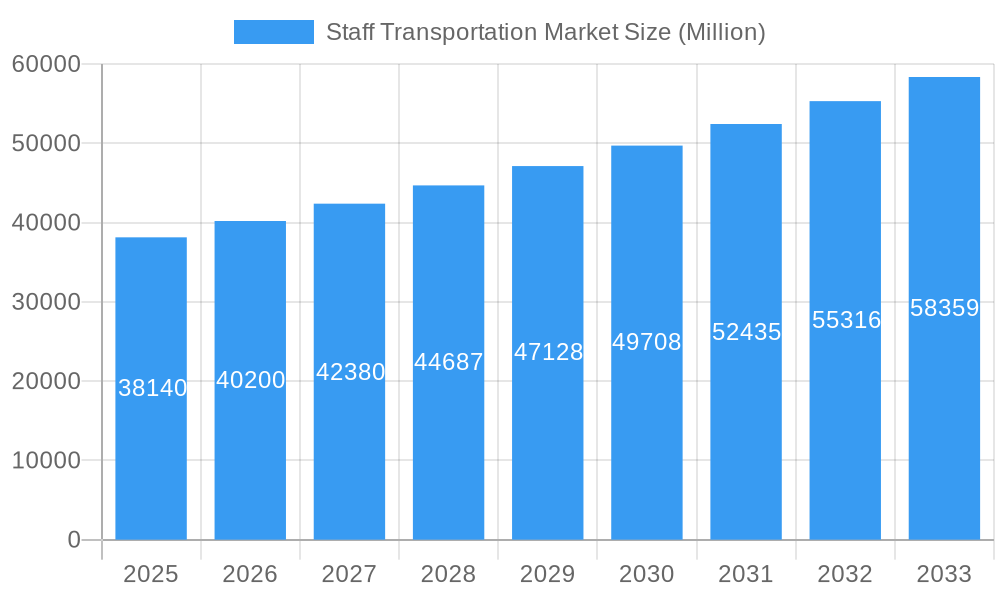
The global staff transportation market, valued at $38.14 billion in 2025, is projected to experience robust growth, driven by the increasing need for efficient and reliable employee transportation solutions across diverse industries. This surge is fueled by several factors: the rising adoption of Mobility as a Service (MaaS) solutions offering integrated and cost-effective travel options for employees; the growing demand for Software as a Service (SaaS) platforms streamlining staff transportation management; and a shift towards outsourced transportation services allowing companies to focus on core business operations. Furthermore, the expanding adoption of sustainable transportation methods, including electric vehicles and carpooling initiatives, contributes significantly to market growth. However, challenges such as fluctuating fuel prices, stringent regulatory compliance, and the need for robust technological infrastructure to support MaaS solutions could potentially restrain market expansion. The market segmentation reveals that while cars currently dominate the passenger vehicle type, the demand for vans and buses is steadily increasing, reflecting the diverse transportation needs of various organizations and employee populations. Geographically, North America and Europe are currently leading market segments, followed by the Asia-Pacific region experiencing rapid growth due to increasing urbanization and industrialization.
Staff Transportation Market Market Size (In Billion)
The forecast period (2025-2033) anticipates a continued upward trajectory, propelled by technological advancements in route optimization, real-time tracking, and improved safety features within transportation management systems. The increasing focus on employee well-being and corporate social responsibility initiatives further supports the growth of staff transportation services. Competition within the market is intense, with established players and emerging startups vying for market share. Companies are strategically investing in technological innovations and expanding service offerings to maintain a competitive edge. Future growth will depend on the continued development and adoption of innovative solutions, addressing sustainability concerns, and adapting to evolving regulatory frameworks across different regions. The market's steady CAGR of 5.34% signifies a promising outlook for long-term growth and investment opportunities.
Staff Transportation Market Company Market Share
Staff Transportation Market Report: 2019-2033 Forecast
This comprehensive report provides a detailed analysis of the Staff Transportation Market, offering invaluable insights for industry stakeholders, investors, and strategic decision-makers. Covering the period from 2019 to 2033, with a focus on 2025, this study unravels market dynamics, trends, and future growth potential. The report features in-depth analysis of key players, including Shuttl, Sun Telematic, Eco rent a car, Move-In-Sync, Transdev, Prairie Bus Line Limited, Janani Tours, Busbank (Global Charter Services Ltd), and First Class Tours, and examines various market segments by service type, ownership, and passenger vehicle type. Discover crucial data points, including market size (in Millions), CAGR, and market share, to guide your strategic planning.
Staff Transportation Market Market Dynamics & Concentration
The Staff Transportation Market is experiencing a dynamic evolution shaped by several interconnected factors. Market concentration is currently moderate, with a few large players and numerous smaller regional operators vying for market share. Estimates suggest a xx% market share for the top 5 players in 2025. Innovation is a key driver, particularly in areas like electric vehicle adoption and the integration of MaaS technologies. Stringent regulatory frameworks concerning safety, emissions, and accessibility are shaping market practices. The rise of ride-sharing and MaaS platforms presents substantial competitive pressure, forcing traditional providers to adapt and innovate.
End-user preferences are shifting towards sustainable and convenient transportation solutions, fueling demand for electric vehicles and flexible on-demand services. Mergers and acquisitions (M&A) activity has been moderate in recent years, with approximately xx M&A deals recorded between 2019 and 2024. These deals are primarily focused on consolidating market share and expanding service offerings.
- Market Concentration: Moderate, with a top 5 market share of approximately xx% in 2025.
- Innovation Drivers: Electric vehicle adoption, MaaS integration, and technological advancements in fleet management.
- Regulatory Landscape: Stringent safety, emissions, and accessibility regulations.
- Product Substitutes: Ride-sharing services, public transportation, and individual vehicle ownership.
- End-User Trends: Growing preference for sustainable, convenient, and cost-effective solutions.
- M&A Activity: Approximately xx M&A deals between 2019 and 2024.
Staff Transportation Market Industry Trends & Analysis
The Staff Transportation Market exhibits a robust growth trajectory, driven by several key factors. The increasing prevalence of corporate social responsibility initiatives and a focus on employee well-being are leading to higher adoption of staff transportation services. The rising costs of individual commuting and the need for efficient employee mobility further contribute to market expansion. Technological advancements, such as real-time tracking, route optimization, and integrated payment systems, are enhancing service efficiency and user experience. The shift towards sustainable transportation solutions, particularly electric vehicles, is gaining momentum, driven by environmental concerns and government incentives. The market is also witnessing the emergence of new business models such as MaaS platforms, which offer integrated mobility solutions to employers. The overall market is projected to experience a CAGR of xx% during the forecast period (2025-2033), with market penetration expected to reach xx% by 2033.
Leading Markets & Segments in Staff Transportation Market
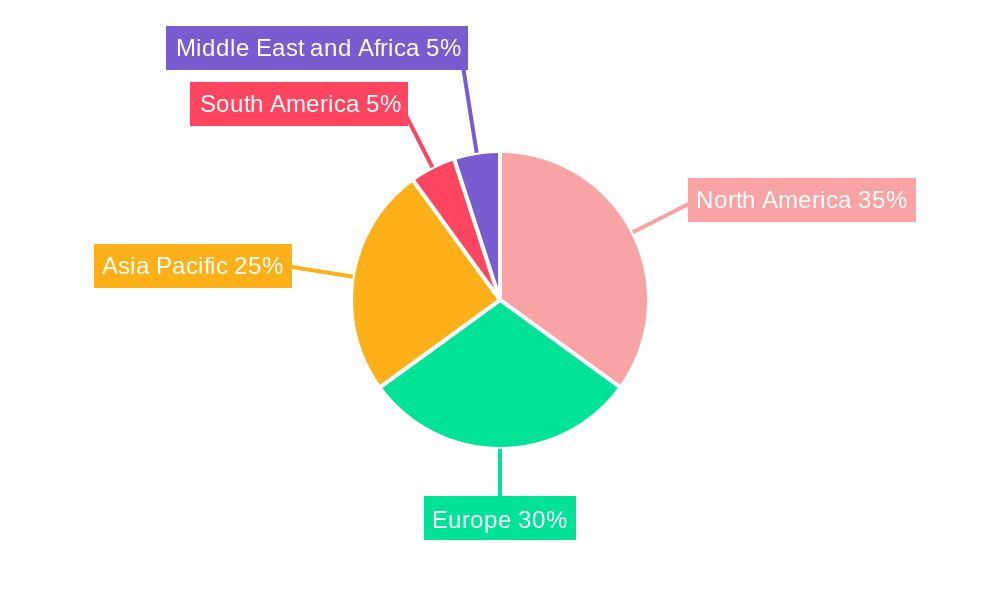
The Staff Transportation Market demonstrates significant regional variations. North America and Europe currently dominate the market, driven by factors such as well-established transportation infrastructure, higher disposable incomes, and progressive labor laws. However, developing economies in Asia-Pacific are poised for significant growth, fueled by rapid urbanization and industrialization.
Dominant Region: North America and Europe.
Key Segment Drivers:
- Service Type: MaaS is experiencing rapid growth driven by increasing demand for integrated mobility solutions.
- Ownership: Outsourced transportation services dominate due to cost-effectiveness and efficiency.
- Passenger Vehicle Type: Buses are most widely used for larger organizations, while cars and vans cater to smaller groups.
Growth Drivers by Region:
- North America: Strong corporate adoption, well-developed infrastructure.
- Europe: Stringent environmental regulations driving electric vehicle adoption.
- Asia-Pacific: Rapid urbanization, growing industrial sector.
Staff Transportation Market Product Developments
Recent product developments in the staff transportation market are focused on enhancing efficiency, sustainability, and user experience. The integration of smart technologies, including GPS tracking, real-time data analytics, and mobile applications, is improving route optimization, fleet management, and passenger communication. The adoption of electric vehicles is gaining significant traction, reducing carbon footprint and meeting growing sustainability requirements. New service models, such as on-demand shuttle services and MaaS platforms, offer greater flexibility and convenience to users.
Key Drivers of Staff Transportation Market Growth
Several factors fuel the growth of the Staff Transportation Market. Technological advancements like electric vehicles and sophisticated route optimization software enhance efficiency and reduce costs. Favorable government policies supporting sustainable transportation and employee well-being create a conducive environment. The rising focus on corporate social responsibility and employee retention initiatives further accelerates market growth.
Challenges in the Staff Transportation Market Market
The Staff Transportation Market faces challenges like regulatory hurdles concerning permits, licenses, and emission standards. Supply chain disruptions impact the availability of vehicles and components, especially during periods of high demand. Intense competition from ride-sharing services and public transportation necessitates continuous innovation and differentiation.
Emerging Opportunities in Staff Transportation Market
Emerging opportunities stem from the increasing adoption of electric and autonomous vehicles. Strategic partnerships with technology providers and MaaS platforms expand service offerings and enhance customer experience. Expansion into new geographical markets with growing demand for efficient staff transportation presents significant growth potential.
Leading Players in the Staff Transportation Market Sector
- Shuttl
- Sun Telematic
- Eco rent a car
- Move-In-Sync
- Transdev
- Prairie Bus Line Limited
- Janani Tours
- Busbank (Global Charter Services Ltd)
- First Class Tours
Key Milestones in Staff Transportation Market Industry
- September 2021: Uber India launched a corporate shuttle service.
- December 2021: Transdev launched the largest electric bus fleet in the Nordic region (145 buses).
- June 2022: Switch Mobility unveiled the EiV12 electric bus for inter-city and intra-city staff transportation.
Strategic Outlook for Staff Transportation Market Market
The Staff Transportation Market is poised for continued growth, driven by technological innovation, evolving environmental regulations, and a growing emphasis on employee well-being. Strategic partnerships, expansion into new markets, and the integration of sustainable transportation solutions will be critical for success in this dynamic sector. The market's future potential is vast, particularly as cities worldwide strive for improved transportation efficiency and sustainability.
Staff Transportation Market Segmentation
-
1. Ownership
- 1.1. Company-owned Transportation Service
- 1.2. Outsourced Transportation Service
- 1.3. Rentals
- 1.4. Pick and Drop Transportation Service
-
2. Passenger Vehicle Type
- 2.1. Cars
- 2.2. Vans
- 2.3. Bus
-
3. Service Type
- 3.1. Mobility as a Service (MaaS)
- 3.2. Software as a Service (SaaS)
Staff Transportation Market Segmentation By Geography
-
1. North America
- 1.1. United States
- 1.2. Canada
- 1.3. Rest of North America
-
2. Europe
- 2.1. Germany
- 2.2. United Kingdom
- 2.3. France
- 2.4. Rest of Europe
-
3. Asia Pacific
- 3.1. India
- 3.2. China
- 3.3. Japan
- 3.4. Rest of Asia Pacific
-
4. South America
- 4.1. Brazil
- 4.2. Argentina
- 4.3. Rest of the South America
-
5. Middle East and Africa
- 5.1. United Arab Emirates
- 5.2. Saudi Arabia
- 5.3. Rest of the Middle East and Africa
Staff Transportation Market Regional Market Share
Geographic Coverage of Staff Transportation Market
Staff Transportation Market REPORT HIGHLIGHTS
| Aspects | Details |
|---|---|
| Study Period | 2020-2034 |
| Base Year | 2025 |
| Estimated Year | 2026 |
| Forecast Period | 2026-2034 |
| Historical Period | 2020-2025 |
| Growth Rate | CAGR of 5.34% from 2020-2034 |
| Segmentation |
|
Table of Contents
- 1. Introduction
- 1.1. Research Scope
- 1.2. Market Segmentation
- 1.3. Research Objective
- 1.4. Definitions and Assumptions
- 2. Executive Summary
- 2.1. Market Snapshot
- 3. Market Dynamics
- 3.1. Market Drivers
- 3.2. Market Restrains
- 3.3. Market Trends
- 3.4. Market Opportunities
- 4. Market Factor Analysis
- 4.1. Porters Five Forces
- 4.1.1. Bargaining Power of Suppliers
- 4.1.2. Bargaining Power of Buyers
- 4.1.3. Threat of New Entrants
- 4.1.4. Threat of Substitutes
- 4.1.5. Competitive Rivalry
- 4.2. PESTEL analysis
- 4.3. BCG Analysis
- 4.3.1. Stars (High Growth, High Market Share)
- 4.3.2. Cash Cows (Low Growth, High Market Share)
- 4.3.3. Question Mark (High Growth, Low Market Share)
- 4.3.4. Dogs (Low Growth, Low Market Share)
- 4.4. Ansoff Matrix Analysis
- 4.5. Supply Chain Analysis
- 4.6. Regulatory Landscape
- 4.7. Current Market Potential and Opportunity Assessment (TAM–SAM–SOM Framework)
- 4.8. MDP Analyst Note
- 4.1. Porters Five Forces
- 5. Market Analysis, Insights and Forecast 2021-2033
- 5.1. Market Analysis, Insights and Forecast - by Ownership
- 5.1.1. Company-owned Transportation Service
- 5.1.2. Outsourced Transportation Service
- 5.1.3. Rentals
- 5.1.4. Pick and Drop Transportation Service
- 5.2. Market Analysis, Insights and Forecast - by Passenger Vehicle Type
- 5.2.1. Cars
- 5.2.2. Vans
- 5.2.3. Bus
- 5.3. Market Analysis, Insights and Forecast - by Service Type
- 5.3.1. Mobility as a Service (MaaS)
- 5.3.2. Software as a Service (SaaS)
- 5.4. Market Analysis, Insights and Forecast - by Region
- 5.4.1. North America
- 5.4.2. Europe
- 5.4.3. Asia Pacific
- 5.4.4. South America
- 5.4.5. Middle East and Africa
- 5.1. Market Analysis, Insights and Forecast - by Ownership
- 6. Global Staff Transportation Market Analysis, Insights and Forecast, 2021-2033
- 6.1. Market Analysis, Insights and Forecast - by Ownership
- 6.1.1. Company-owned Transportation Service
- 6.1.2. Outsourced Transportation Service
- 6.1.3. Rentals
- 6.1.4. Pick and Drop Transportation Service
- 6.2. Market Analysis, Insights and Forecast - by Passenger Vehicle Type
- 6.2.1. Cars
- 6.2.2. Vans
- 6.2.3. Bus
- 6.3. Market Analysis, Insights and Forecast - by Service Type
- 6.3.1. Mobility as a Service (MaaS)
- 6.3.2. Software as a Service (SaaS)
- 6.1. Market Analysis, Insights and Forecast - by Ownership
- 7. North America Staff Transportation Market Analysis, Insights and Forecast, 2020-2032
- 7.1. Market Analysis, Insights and Forecast - by Ownership
- 7.1.1. Company-owned Transportation Service
- 7.1.2. Outsourced Transportation Service
- 7.1.3. Rentals
- 7.1.4. Pick and Drop Transportation Service
- 7.2. Market Analysis, Insights and Forecast - by Passenger Vehicle Type
- 7.2.1. Cars
- 7.2.2. Vans
- 7.2.3. Bus
- 7.3. Market Analysis, Insights and Forecast - by Service Type
- 7.3.1. Mobility as a Service (MaaS)
- 7.3.2. Software as a Service (SaaS)
- 7.1. Market Analysis, Insights and Forecast - by Ownership
- 8. Europe Staff Transportation Market Analysis, Insights and Forecast, 2020-2032
- 8.1. Market Analysis, Insights and Forecast - by Ownership
- 8.1.1. Company-owned Transportation Service
- 8.1.2. Outsourced Transportation Service
- 8.1.3. Rentals
- 8.1.4. Pick and Drop Transportation Service
- 8.2. Market Analysis, Insights and Forecast - by Passenger Vehicle Type
- 8.2.1. Cars
- 8.2.2. Vans
- 8.2.3. Bus
- 8.3. Market Analysis, Insights and Forecast - by Service Type
- 8.3.1. Mobility as a Service (MaaS)
- 8.3.2. Software as a Service (SaaS)
- 8.1. Market Analysis, Insights and Forecast - by Ownership
- 9. Asia Pacific Staff Transportation Market Analysis, Insights and Forecast, 2020-2032
- 9.1. Market Analysis, Insights and Forecast - by Ownership
- 9.1.1. Company-owned Transportation Service
- 9.1.2. Outsourced Transportation Service
- 9.1.3. Rentals
- 9.1.4. Pick and Drop Transportation Service
- 9.2. Market Analysis, Insights and Forecast - by Passenger Vehicle Type
- 9.2.1. Cars
- 9.2.2. Vans
- 9.2.3. Bus
- 9.3. Market Analysis, Insights and Forecast - by Service Type
- 9.3.1. Mobility as a Service (MaaS)
- 9.3.2. Software as a Service (SaaS)
- 9.1. Market Analysis, Insights and Forecast - by Ownership
- 10. South America Staff Transportation Market Analysis, Insights and Forecast, 2020-2032
- 10.1. Market Analysis, Insights and Forecast - by Ownership
- 10.1.1. Company-owned Transportation Service
- 10.1.2. Outsourced Transportation Service
- 10.1.3. Rentals
- 10.1.4. Pick and Drop Transportation Service
- 10.2. Market Analysis, Insights and Forecast - by Passenger Vehicle Type
- 10.2.1. Cars
- 10.2.2. Vans
- 10.2.3. Bus
- 10.3. Market Analysis, Insights and Forecast - by Service Type
- 10.3.1. Mobility as a Service (MaaS)
- 10.3.2. Software as a Service (SaaS)
- 10.1. Market Analysis, Insights and Forecast - by Ownership
- 11. Middle East and Africa Staff Transportation Market Analysis, Insights and Forecast, 2020-2032
- 11.1. Market Analysis, Insights and Forecast - by Ownership
- 11.1.1. Company-owned Transportation Service
- 11.1.2. Outsourced Transportation Service
- 11.1.3. Rentals
- 11.1.4. Pick and Drop Transportation Service
- 11.2. Market Analysis, Insights and Forecast - by Passenger Vehicle Type
- 11.2.1. Cars
- 11.2.2. Vans
- 11.2.3. Bus
- 11.3. Market Analysis, Insights and Forecast - by Service Type
- 11.3.1. Mobility as a Service (MaaS)
- 11.3.2. Software as a Service (SaaS)
- 11.1. Market Analysis, Insights and Forecast - by Ownership
- 12. Competitive Analysis
- 12.1. Company Profiles
- 12.1.1 Shuttl
- 12.1.1.1. Company Overview
- 12.1.1.2. Products
- 12.1.1.3. Company Financials
- 12.1.1.4. SWOT Analysis
- 12.1.2 Sun Telematic
- 12.1.2.1. Company Overview
- 12.1.2.2. Products
- 12.1.2.3. Company Financials
- 12.1.2.4. SWOT Analysis
- 12.1.3 Eco rent a car
- 12.1.3.1. Company Overview
- 12.1.3.2. Products
- 12.1.3.3. Company Financials
- 12.1.3.4. SWOT Analysis
- 12.1.4 Move-In-Sync
- 12.1.4.1. Company Overview
- 12.1.4.2. Products
- 12.1.4.3. Company Financials
- 12.1.4.4. SWOT Analysis
- 12.1.5 Transdev
- 12.1.5.1. Company Overview
- 12.1.5.2. Products
- 12.1.5.3. Company Financials
- 12.1.5.4. SWOT Analysis
- 12.1.6 Prairie Bus Line Limited
- 12.1.6.1. Company Overview
- 12.1.6.2. Products
- 12.1.6.3. Company Financials
- 12.1.6.4. SWOT Analysis
- 12.1.7 Janani Tours
- 12.1.7.1. Company Overview
- 12.1.7.2. Products
- 12.1.7.3. Company Financials
- 12.1.7.4. SWOT Analysis
- 12.1.8 Busbank (Global Charter Services Ltd )
- 12.1.8.1. Company Overview
- 12.1.8.2. Products
- 12.1.8.3. Company Financials
- 12.1.8.4. SWOT Analysis
- 12.1.9 First Class Tours
- 12.1.9.1. Company Overview
- 12.1.9.2. Products
- 12.1.9.3. Company Financials
- 12.1.9.4. SWOT Analysis
- 12.1.1 Shuttl
- 12.2. Market Entropy
- 12.2.1 Company's Key Areas Served
- 12.2.2 Recent Developments
- 12.3. Company Market Share Analysis 2025
- 12.3.1 Top 5 Companies Market Share Analysis
- 12.3.2 Top 3 Companies Market Share Analysis
- 12.4. List of Potential Customers
- 13. Research Methodology
List of Figures
- Figure 1: Global Staff Transportation Market Revenue Breakdown (Million, %) by Region 2025 & 2033
- Figure 2: North America Staff Transportation Market Revenue (Million), by Ownership 2025 & 2033
- Figure 3: North America Staff Transportation Market Revenue Share (%), by Ownership 2025 & 2033
- Figure 4: North America Staff Transportation Market Revenue (Million), by Passenger Vehicle Type 2025 & 2033
- Figure 5: North America Staff Transportation Market Revenue Share (%), by Passenger Vehicle Type 2025 & 2033
- Figure 6: North America Staff Transportation Market Revenue (Million), by Service Type 2025 & 2033
- Figure 7: North America Staff Transportation Market Revenue Share (%), by Service Type 2025 & 2033
- Figure 8: North America Staff Transportation Market Revenue (Million), by Country 2025 & 2033
- Figure 9: North America Staff Transportation Market Revenue Share (%), by Country 2025 & 2033
- Figure 10: Europe Staff Transportation Market Revenue (Million), by Ownership 2025 & 2033
- Figure 11: Europe Staff Transportation Market Revenue Share (%), by Ownership 2025 & 2033
- Figure 12: Europe Staff Transportation Market Revenue (Million), by Passenger Vehicle Type 2025 & 2033
- Figure 13: Europe Staff Transportation Market Revenue Share (%), by Passenger Vehicle Type 2025 & 2033
- Figure 14: Europe Staff Transportation Market Revenue (Million), by Service Type 2025 & 2033
- Figure 15: Europe Staff Transportation Market Revenue Share (%), by Service Type 2025 & 2033
- Figure 16: Europe Staff Transportation Market Revenue (Million), by Country 2025 & 2033
- Figure 17: Europe Staff Transportation Market Revenue Share (%), by Country 2025 & 2033
- Figure 18: Asia Pacific Staff Transportation Market Revenue (Million), by Ownership 2025 & 2033
- Figure 19: Asia Pacific Staff Transportation Market Revenue Share (%), by Ownership 2025 & 2033
- Figure 20: Asia Pacific Staff Transportation Market Revenue (Million), by Passenger Vehicle Type 2025 & 2033
- Figure 21: Asia Pacific Staff Transportation Market Revenue Share (%), by Passenger Vehicle Type 2025 & 2033
- Figure 22: Asia Pacific Staff Transportation Market Revenue (Million), by Service Type 2025 & 2033
- Figure 23: Asia Pacific Staff Transportation Market Revenue Share (%), by Service Type 2025 & 2033
- Figure 24: Asia Pacific Staff Transportation Market Revenue (Million), by Country 2025 & 2033
- Figure 25: Asia Pacific Staff Transportation Market Revenue Share (%), by Country 2025 & 2033
- Figure 26: South America Staff Transportation Market Revenue (Million), by Ownership 2025 & 2033
- Figure 27: South America Staff Transportation Market Revenue Share (%), by Ownership 2025 & 2033
- Figure 28: South America Staff Transportation Market Revenue (Million), by Passenger Vehicle Type 2025 & 2033
- Figure 29: South America Staff Transportation Market Revenue Share (%), by Passenger Vehicle Type 2025 & 2033
- Figure 30: South America Staff Transportation Market Revenue (Million), by Service Type 2025 & 2033
- Figure 31: South America Staff Transportation Market Revenue Share (%), by Service Type 2025 & 2033
- Figure 32: South America Staff Transportation Market Revenue (Million), by Country 2025 & 2033
- Figure 33: South America Staff Transportation Market Revenue Share (%), by Country 2025 & 2033
- Figure 34: Middle East and Africa Staff Transportation Market Revenue (Million), by Ownership 2025 & 2033
- Figure 35: Middle East and Africa Staff Transportation Market Revenue Share (%), by Ownership 2025 & 2033
- Figure 36: Middle East and Africa Staff Transportation Market Revenue (Million), by Passenger Vehicle Type 2025 & 2033
- Figure 37: Middle East and Africa Staff Transportation Market Revenue Share (%), by Passenger Vehicle Type 2025 & 2033
- Figure 38: Middle East and Africa Staff Transportation Market Revenue (Million), by Service Type 2025 & 2033
- Figure 39: Middle East and Africa Staff Transportation Market Revenue Share (%), by Service Type 2025 & 2033
- Figure 40: Middle East and Africa Staff Transportation Market Revenue (Million), by Country 2025 & 2033
- Figure 41: Middle East and Africa Staff Transportation Market Revenue Share (%), by Country 2025 & 2033
List of Tables
- Table 1: Global Staff Transportation Market Revenue Million Forecast, by Ownership 2020 & 2033
- Table 2: Global Staff Transportation Market Revenue Million Forecast, by Passenger Vehicle Type 2020 & 2033
- Table 3: Global Staff Transportation Market Revenue Million Forecast, by Service Type 2020 & 2033
- Table 4: Global Staff Transportation Market Revenue Million Forecast, by Region 2020 & 2033
- Table 5: Global Staff Transportation Market Revenue Million Forecast, by Ownership 2020 & 2033
- Table 6: Global Staff Transportation Market Revenue Million Forecast, by Passenger Vehicle Type 2020 & 2033
- Table 7: Global Staff Transportation Market Revenue Million Forecast, by Service Type 2020 & 2033
- Table 8: Global Staff Transportation Market Revenue Million Forecast, by Country 2020 & 2033
- Table 9: United States Staff Transportation Market Revenue (Million) Forecast, by Application 2020 & 2033
- Table 10: Canada Staff Transportation Market Revenue (Million) Forecast, by Application 2020 & 2033
- Table 11: Rest of North America Staff Transportation Market Revenue (Million) Forecast, by Application 2020 & 2033
- Table 12: Global Staff Transportation Market Revenue Million Forecast, by Ownership 2020 & 2033
- Table 13: Global Staff Transportation Market Revenue Million Forecast, by Passenger Vehicle Type 2020 & 2033
- Table 14: Global Staff Transportation Market Revenue Million Forecast, by Service Type 2020 & 2033
- Table 15: Global Staff Transportation Market Revenue Million Forecast, by Country 2020 & 2033
- Table 16: Germany Staff Transportation Market Revenue (Million) Forecast, by Application 2020 & 2033
- Table 17: United Kingdom Staff Transportation Market Revenue (Million) Forecast, by Application 2020 & 2033
- Table 18: France Staff Transportation Market Revenue (Million) Forecast, by Application 2020 & 2033
- Table 19: Rest of Europe Staff Transportation Market Revenue (Million) Forecast, by Application 2020 & 2033
- Table 20: Global Staff Transportation Market Revenue Million Forecast, by Ownership 2020 & 2033
- Table 21: Global Staff Transportation Market Revenue Million Forecast, by Passenger Vehicle Type 2020 & 2033
- Table 22: Global Staff Transportation Market Revenue Million Forecast, by Service Type 2020 & 2033
- Table 23: Global Staff Transportation Market Revenue Million Forecast, by Country 2020 & 2033
- Table 24: India Staff Transportation Market Revenue (Million) Forecast, by Application 2020 & 2033
- Table 25: China Staff Transportation Market Revenue (Million) Forecast, by Application 2020 & 2033
- Table 26: Japan Staff Transportation Market Revenue (Million) Forecast, by Application 2020 & 2033
- Table 27: Rest of Asia Pacific Staff Transportation Market Revenue (Million) Forecast, by Application 2020 & 2033
- Table 28: Global Staff Transportation Market Revenue Million Forecast, by Ownership 2020 & 2033
- Table 29: Global Staff Transportation Market Revenue Million Forecast, by Passenger Vehicle Type 2020 & 2033
- Table 30: Global Staff Transportation Market Revenue Million Forecast, by Service Type 2020 & 2033
- Table 31: Global Staff Transportation Market Revenue Million Forecast, by Country 2020 & 2033
- Table 32: Brazil Staff Transportation Market Revenue (Million) Forecast, by Application 2020 & 2033
- Table 33: Argentina Staff Transportation Market Revenue (Million) Forecast, by Application 2020 & 2033
- Table 34: Rest of the South America Staff Transportation Market Revenue (Million) Forecast, by Application 2020 & 2033
- Table 35: Global Staff Transportation Market Revenue Million Forecast, by Ownership 2020 & 2033
- Table 36: Global Staff Transportation Market Revenue Million Forecast, by Passenger Vehicle Type 2020 & 2033
- Table 37: Global Staff Transportation Market Revenue Million Forecast, by Service Type 2020 & 2033
- Table 38: Global Staff Transportation Market Revenue Million Forecast, by Country 2020 & 2033
- Table 39: United Arab Emirates Staff Transportation Market Revenue (Million) Forecast, by Application 2020 & 2033
- Table 40: Saudi Arabia Staff Transportation Market Revenue (Million) Forecast, by Application 2020 & 2033
- Table 41: Rest of the Middle East and Africa Staff Transportation Market Revenue (Million) Forecast, by Application 2020 & 2033
Frequently Asked Questions
1. What is the projected Compound Annual Growth Rate (CAGR) of the Staff Transportation Market?
The projected CAGR is approximately 5.34%.
2. Which companies are prominent players in the Staff Transportation Market?
Key companies in the market include Shuttl, Sun Telematic, Eco rent a car, Move-In-Sync, Transdev, Prairie Bus Line Limited, Janani Tours, Busbank (Global Charter Services Ltd ), First Class Tours.
3. What are the main segments of the Staff Transportation Market?
The market segments include Ownership, Passenger Vehicle Type, Service Type.
4. Can you provide details about the market size?
The market size is estimated to be USD 38.14 Million as of 2022.
5. What are some drivers contributing to market growth?
Stringent Emission Regulations are Fueling the Market Growth.
6. What are the notable trends driving market growth?
Increasing Internet Usage and Technological Advancements to Drive Demand in the Market.
7. Are there any restraints impacting market growth?
High Cost of Electric Commercial Vehicle May Hamper the Growth.
8. Can you provide examples of recent developments in the market?
June 2022: Switch Mobility, the electric vehicle division of Hinduja Group flagship Ashok Leyland, unveiled the EiV12 electric bus, aiming to capture a significant share of the electric vehicle market with a slew of customer-friendly features. The company intends to serve inter-city, and intra-city, staff transportation with this launch.
9. What pricing options are available for accessing the report?
Pricing options include single-user, multi-user, and enterprise licenses priced at USD 4750, USD 5250, and USD 8750 respectively.
10. Is the market size provided in terms of value or volume?
The market size is provided in terms of value, measured in Million.
11. Are there any specific market keywords associated with the report?
Yes, the market keyword associated with the report is "Staff Transportation Market," which aids in identifying and referencing the specific market segment covered.
12. How do I determine which pricing option suits my needs best?
The pricing options vary based on user requirements and access needs. Individual users may opt for single-user licenses, while businesses requiring broader access may choose multi-user or enterprise licenses for cost-effective access to the report.
13. Are there any additional resources or data provided in the Staff Transportation Market report?
While the report offers comprehensive insights, it's advisable to review the specific contents or supplementary materials provided to ascertain if additional resources or data are available.
14. How can I stay updated on further developments or reports in the Staff Transportation Market?
To stay informed about further developments, trends, and reports in the Staff Transportation Market, consider subscribing to industry newsletters, following relevant companies and organizations, or regularly checking reputable industry news sources and publications.
Methodology
Step 1 - Identification of Relevant Samples Size from Population Database


Step 2 - Approaches for Defining Global Market Size (Value, Volume* & Price*)

Note*: In applicable scenarios
Step 3 - Data Sources
Primary Research
- Web Analytics
- Survey Reports
- Research Institute
- Latest Research Reports
- Opinion Leaders
Secondary Research
- Annual Reports
- White Paper
- Latest Press Release
- Industry Association
- Paid Database
- Investor Presentations

Step 4 - Data Triangulation
Involves using different sources of information in order to increase the validity of a study
These sources are likely to be stakeholders in a program - participants, other researchers, program staff, other community members, and so on.
Then we put all data in single framework & apply various statistical tools to find out the dynamic on the market.
During the analysis stage, feedback from the stakeholder groups would be compared to determine areas of agreement as well as areas of divergence