

Key Insights
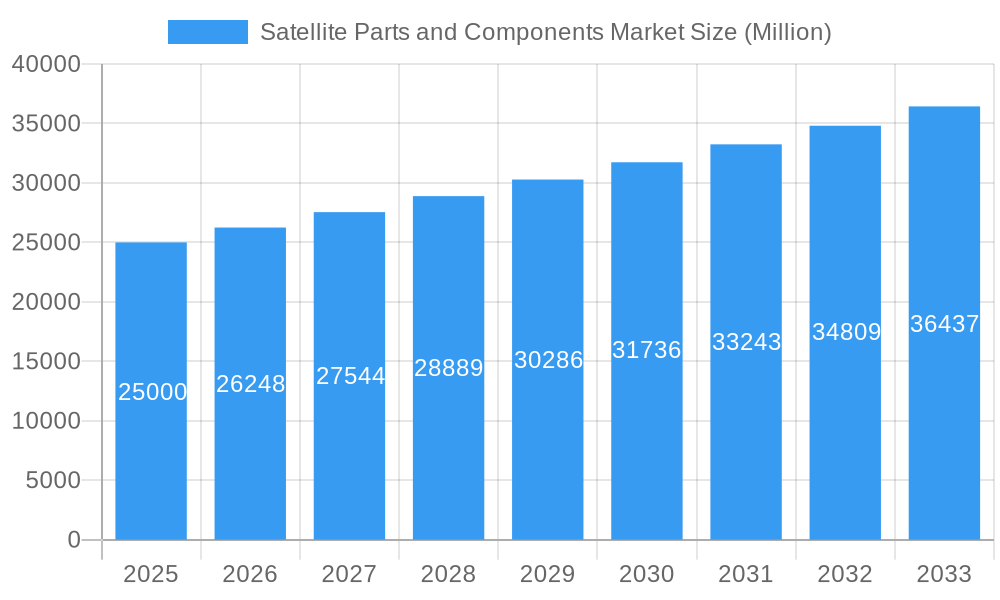
The Satellite Parts and Components market is experiencing substantial expansion, driven by the escalating demand for satellite-derived services across telecommunications, navigation, and Earth observation. The market is projected to reach $25 billion by 2025, with a Compound Annual Growth Rate (CAGR) of 7% from the base year 2025. Key growth catalysts include the widespread adoption of small satellites, component miniaturization driving cost efficiencies, and the global imperative for high-bandwidth communication solutions. Advancements in sensor technology and phased array antennas are further propelling market development. Despite challenges such as high initial investment and supply chain complexities, the market outlook remains highly positive. Segmentation analysis highlights significant opportunities in payload components, particularly cameras, sensors, and mission computers, fueled by the demand for enhanced resolution imaging and advanced data processing. The antenna segment is also growing, driven by the need for improved signal reception and transmission efficiency. Leading players are strategically investing in R&D, product portfolio expansion, and M&A to solidify market positions. North America and Europe currently dominate the market, supported by governmental backing for space initiatives and strong commercial activities. However, the Asia-Pacific region is poised for rapid growth, with increasing investments in space infrastructure and burgeoning domestic satellite industries.
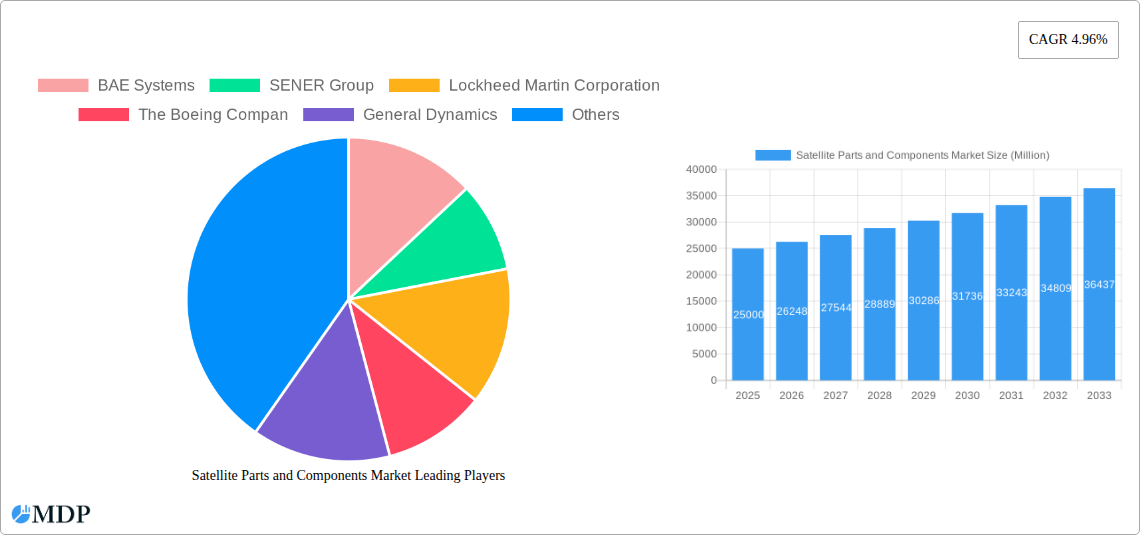
Satellite Parts and Components Market Market Size (In Billion)
Future market dynamics will be significantly influenced by government policies favoring space exploration, the integration of NewSpace technologies, and the development of innovative satellite designs that boost performance and reduce costs. Continuous component miniaturization will expand the accessibility and applications of satellite technology. Strategic collaborations and partnerships will be crucial for companies to navigate evolving market landscapes and maintain competitive advantages. Market consolidation is anticipated, with larger entities acquiring smaller firms to enhance capabilities and global reach. Sustained innovation in materials science, electronics, and software is vital for improving the efficiency, reliability, and longevity of satellite components. Addressing supply chain vulnerabilities through diversification and strategic alliances will be essential for ensuring consistent component availability and mitigating disruptions.
Satellite Parts and Components Market Company Market Share
Satellite Parts and Components Market: A Comprehensive Report (2019-2033)
This in-depth report provides a comprehensive analysis of the Satellite Parts and Components Market, offering invaluable insights for industry stakeholders, investors, and strategic decision-makers. With a focus on market dynamics, leading players, and future growth potential, this report covers the period from 2019 to 2033, utilizing 2025 as the base year. The report projects a market valued at xx Million by 2033, showcasing significant growth opportunities within the space sector.
Satellite Parts and Components Market Dynamics & Concentration
This section delves into the intricate dynamics shaping the Satellite Parts and Components Market. We analyze market concentration, identifying key players and their respective market shares. The report also examines innovation drivers, regulatory landscapes, the impact of product substitutes, evolving end-user trends, and the frequency of mergers and acquisitions (M&A) activity. Over the historical period (2019-2024), the market witnessed xx M&A deals, contributing to increased consolidation. The projected CAGR for the forecast period (2025-2033) is estimated at xx%.
- Market Concentration: The market exhibits a moderately concentrated structure, with top players holding approximately xx% of the market share in 2024.
- Innovation Drivers: Advancements in miniaturization, improved sensor technologies, and the rise of NewSpace companies are driving innovation.
- Regulatory Frameworks: Government regulations concerning space debris mitigation and satellite licensing significantly influence market operations.
- Product Substitutes: The emergence of alternative technologies and materials presents a moderate level of substitution threat.
- End-User Trends: Growing demand for high-resolution imagery, increased reliance on satellite-based communication, and the expansion of the Internet of Things (IoT) are key end-user trends.
- M&A Activity: The number of M&A deals is expected to increase during the forecast period, driven by the need for consolidation and technological expansion.
Satellite Parts and Components Market Industry Trends & Analysis
This section provides a detailed analysis of market growth drivers, technological disruptions, evolving consumer preferences, and competitive landscape dynamics within the Satellite Parts and Components Market. We examine the impact of factors such as increasing government spending on space exploration, the proliferation of small satellites, and the growing demand for advanced satellite technologies. The market is experiencing a shift towards miniaturization and increased reliance on commercially available off-the-shelf components.
The report also highlights the impact of technological advancements, such as the development of advanced materials and improved manufacturing processes. Market penetration of advanced satellite technologies is growing at a CAGR of approximately xx% during the forecast period. Competitive dynamics are intense, with established players facing challenges from emerging NewSpace companies. The overall market is characterized by rapid technological advancement and evolving customer demands.
Leading Markets & Segments in Satellite Parts and Components Market
This section identifies the dominant regions, countries, and segments within the Satellite Parts and Components Market. The analysis focuses on Payload (Cameras, sensors, transponders, mission computers), Antenna (Parabolic antennas, phased array antennas), and Structure (Satellite bus, solar panels, propulsion systems).
- Payload Segment: The Cameras and Sensors sub-segment is expected to dominate, driven by the increasing demand for high-resolution imagery and advanced Earth observation capabilities.
- Antenna Segment: Phased array antennas are gaining traction due to their enhanced capabilities and flexibility.
- Structure Segment: The satellite bus segment represents a significant portion of the market, given its critical role in satellite functionality.
Key Drivers:
- North America: Strong government funding for space programs, a robust aerospace industry, and the presence of major industry players drive market dominance in this region.
- Europe: A well-established space industry with significant investments in research and development contributes to substantial growth.
- Asia-Pacific: Rapid economic growth, increasing investment in satellite technology, and supportive government policies are propelling market expansion.
The report provides detailed market share analysis for each region and segment, highlighting their respective contributions to the overall market value.
Satellite Parts and Components Market Product Developments
Recent years have witnessed significant product innovations in the Satellite Parts and Components Market. The focus is on miniaturization, enhanced durability, improved performance, and cost reduction. These developments are driven by the growing demand for smaller, more affordable, and more reliable satellites. New materials and manufacturing processes are enabling the creation of lighter and more efficient components, while advanced software and algorithms are improving satellite performance and functionality. The market is witnessing a shift toward more modular and adaptable designs, allowing for greater flexibility in satellite configuration and mission capabilities.
Key Drivers of Satellite Parts and Components Market Growth
Several factors are driving the growth of the Satellite Parts and Components Market. The increasing demand for satellite-based services across various sectors, such as communication, navigation, and Earth observation, is a major driver. Government investments in space exploration initiatives and the rise of commercial space activities are further fueling market expansion. Technological advancements, including miniaturization, improved sensor technologies, and the development of new materials, contribute to enhanced satellite performance and reduced costs, making them more accessible to a wider range of users. Favorable regulatory policies also play a crucial role.
Challenges in the Satellite Parts and Components Market Market
The Satellite Parts and Components Market faces certain challenges. Stringent regulatory frameworks and licensing requirements can pose barriers to entry for new players. Supply chain disruptions, particularly in the procurement of critical raw materials, can impact production and delivery timelines. Intense competition, with both established aerospace companies and emerging NewSpace businesses vying for market share, also creates challenges. These factors can lead to price pressures and margin compression. The high cost of research and development and the need for specialized expertise further contribute to the challenges faced by companies in this sector.
Emerging Opportunities in Satellite Parts and Components Market
The Satellite Parts and Components Market presents significant long-term growth opportunities. Advancements in areas like AI, machine learning, and quantum computing are promising to revolutionize satellite technology. Strategic partnerships and collaborations among industry players are fostering innovation and market expansion. The increasing demand for small satellites, often referred to as CubeSats and nanosats, is creating new opportunities for component providers. Furthermore, the exploration of new applications and markets, such as space tourism and in-space manufacturing, further expands market potential.
Leading Players in the Satellite Parts and Components Market Sector
- BAE Systems
- SENER Group
- Lockheed Martin Corporation
- The Boeing Company
- General Dynamics
- Thales
- OHB SE
- Innovative Solutions in Space BV
- Sitael S p A
- Northrop Grumman Corporation
- Jena-Optronik
- AAC Clyde Space
Key Milestones in Satellite Parts and Components Market Industry
- November 2022: Two star trackers from Jena-Optronik GmbH guided the Orion spacecraft on its way to lunar orbit during NASA's Artemis I mission. This highlights the importance of high-precision navigation components.
- December 2022: The ASTRO CL star sensor from Jena-Optronik was selected for use on Maxar's new LEO platform, demonstrating the growing demand for miniaturized and reliable sensor technologies.
- January 2023: ISISPACE launched 47 payloads from 8 different countries via its ISILAUNCH38 mission, showcasing the increasing use of shared launch services and highlighting the growth of the smallsat market.
Strategic Outlook for Satellite Parts and Components Market Market
The Satellite Parts and Components Market is poised for significant growth over the next decade. The increasing demand for satellite-based services, coupled with technological advancements and supportive government policies, will continue to drive market expansion. Strategic partnerships, mergers and acquisitions, and the development of innovative products are expected to shape the competitive landscape. The focus on miniaturization, cost reduction, and enhanced reliability will remain crucial in attracting a broader range of customers. The market is set for continued growth and presents promising opportunities for both established players and new entrants.
Satellite Parts and Components Market Segmentation
- 1. Production Analysis
- 2. Consumption Analysis
- 3. Import Market Analysis (Value & Volume)
- 4. Export Market Analysis (Value & Volume)
- 5. Price Trend Analysis
Satellite Parts and Components Market Segmentation By Geography
-
1. North America
- 1.1. United States
- 1.2. Canada
- 1.3. Mexico
-
2. South America
- 2.1. Brazil
- 2.2. Argentina
- 2.3. Rest of South America
-
3. Europe
- 3.1. United Kingdom
- 3.2. Germany
- 3.3. France
- 3.4. Italy
- 3.5. Spain
- 3.6. Russia
- 3.7. Benelux
- 3.8. Nordics
- 3.9. Rest of Europe
-
4. Middle East & Africa
- 4.1. Turkey
- 4.2. Israel
- 4.3. GCC
- 4.4. North Africa
- 4.5. South Africa
- 4.6. Rest of Middle East & Africa
-
5. Asia Pacific
- 5.1. China
- 5.2. India
- 5.3. Japan
- 5.4. South Korea
- 5.5. ASEAN
- 5.6. Oceania
- 5.7. Rest of Asia Pacific
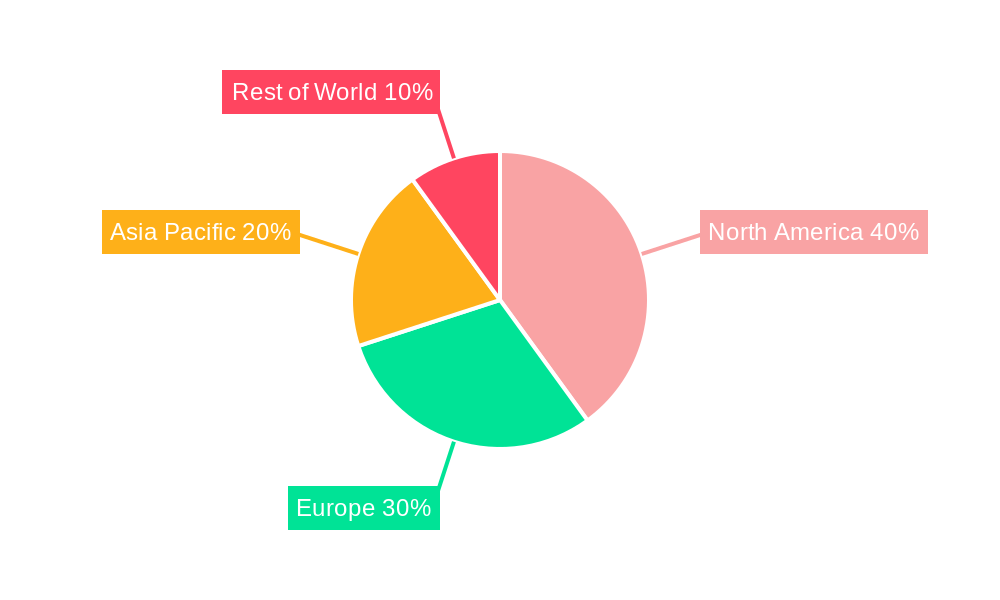
Satellite Parts and Components Market Regional Market Share
Geographic Coverage of Satellite Parts and Components Market
Satellite Parts and Components Market REPORT HIGHLIGHTS
| Aspects | Details |
|---|---|
| Study Period | 2020-2034 |
| Base Year | 2025 |
| Estimated Year | 2026 |
| Forecast Period | 2026-2034 |
| Historical Period | 2020-2025 |
| Growth Rate | CAGR of 7% from 2020-2034 |
| Segmentation |
|
Table of Contents
- 1. Introduction
- 1.1. Research Scope
- 1.2. Market Segmentation
- 1.3. Research Objective
- 1.4. Definitions and Assumptions
- 2. Executive Summary
- 2.1. Market Snapshot
- 3. Market Dynamics
- 3.1. Market Drivers
- 3.2. Market Restrains
- 3.3. Market Trends
- 3.4. Market Opportunities
- 4. Market Factor Analysis
- 4.1. Porters Five Forces
- 4.1.1. Bargaining Power of Suppliers
- 4.1.2. Bargaining Power of Buyers
- 4.1.3. Threat of New Entrants
- 4.1.4. Threat of Substitutes
- 4.1.5. Competitive Rivalry
- 4.2. PESTEL analysis
- 4.3. BCG Analysis
- 4.3.1. Stars (High Growth, High Market Share)
- 4.3.2. Cash Cows (Low Growth, High Market Share)
- 4.3.3. Question Mark (High Growth, Low Market Share)
- 4.3.4. Dogs (Low Growth, Low Market Share)
- 4.4. Ansoff Matrix Analysis
- 4.5. Supply Chain Analysis
- 4.6. Regulatory Landscape
- 4.7. Current Market Potential and Opportunity Assessment (TAM–SAM–SOM Framework)
- 4.8. MDP Analyst Note
- 4.1. Porters Five Forces
- 5. Market Analysis, Insights and Forecast 2021-2033
- 5.1. Market Analysis, Insights and Forecast - by Production Analysis
- 5.2. Market Analysis, Insights and Forecast - by Consumption Analysis
- 5.3. Market Analysis, Insights and Forecast - by Import Market Analysis (Value & Volume)
- 5.4. Market Analysis, Insights and Forecast - by Export Market Analysis (Value & Volume)
- 5.5. Market Analysis, Insights and Forecast - by Price Trend Analysis
- 5.6. Market Analysis, Insights and Forecast - by Region
- 5.6.1. North America
- 5.6.2. South America
- 5.6.3. Europe
- 5.6.4. Middle East & Africa
- 5.6.5. Asia Pacific
- 6. Global Satellite Parts and Components Market Analysis, Insights and Forecast, 2021-2033
- 6.1. Market Analysis, Insights and Forecast - by Production Analysis
- 6.2. Market Analysis, Insights and Forecast - by Consumption Analysis
- 6.3. Market Analysis, Insights and Forecast - by Import Market Analysis (Value & Volume)
- 6.4. Market Analysis, Insights and Forecast - by Export Market Analysis (Value & Volume)
- 6.5. Market Analysis, Insights and Forecast - by Price Trend Analysis
- 7. North America Satellite Parts and Components Market Analysis, Insights and Forecast, 2020-2032
- 7.1. Market Analysis, Insights and Forecast - by Production Analysis
- 7.2. Market Analysis, Insights and Forecast - by Consumption Analysis
- 7.3. Market Analysis, Insights and Forecast - by Import Market Analysis (Value & Volume)
- 7.4. Market Analysis, Insights and Forecast - by Export Market Analysis (Value & Volume)
- 7.5. Market Analysis, Insights and Forecast - by Price Trend Analysis
- 8. South America Satellite Parts and Components Market Analysis, Insights and Forecast, 2020-2032
- 8.1. Market Analysis, Insights and Forecast - by Production Analysis
- 8.2. Market Analysis, Insights and Forecast - by Consumption Analysis
- 8.3. Market Analysis, Insights and Forecast - by Import Market Analysis (Value & Volume)
- 8.4. Market Analysis, Insights and Forecast - by Export Market Analysis (Value & Volume)
- 8.5. Market Analysis, Insights and Forecast - by Price Trend Analysis
- 9. Europe Satellite Parts and Components Market Analysis, Insights and Forecast, 2020-2032
- 9.1. Market Analysis, Insights and Forecast - by Production Analysis
- 9.2. Market Analysis, Insights and Forecast - by Consumption Analysis
- 9.3. Market Analysis, Insights and Forecast - by Import Market Analysis (Value & Volume)
- 9.4. Market Analysis, Insights and Forecast - by Export Market Analysis (Value & Volume)
- 9.5. Market Analysis, Insights and Forecast - by Price Trend Analysis
- 10. Middle East & Africa Satellite Parts and Components Market Analysis, Insights and Forecast, 2020-2032
- 10.1. Market Analysis, Insights and Forecast - by Production Analysis
- 10.2. Market Analysis, Insights and Forecast - by Consumption Analysis
- 10.3. Market Analysis, Insights and Forecast - by Import Market Analysis (Value & Volume)
- 10.4. Market Analysis, Insights and Forecast - by Export Market Analysis (Value & Volume)
- 10.5. Market Analysis, Insights and Forecast - by Price Trend Analysis
- 11. Asia Pacific Satellite Parts and Components Market Analysis, Insights and Forecast, 2020-2032
- 11.1. Market Analysis, Insights and Forecast - by Production Analysis
- 11.2. Market Analysis, Insights and Forecast - by Consumption Analysis
- 11.3. Market Analysis, Insights and Forecast - by Import Market Analysis (Value & Volume)
- 11.4. Market Analysis, Insights and Forecast - by Export Market Analysis (Value & Volume)
- 11.5. Market Analysis, Insights and Forecast - by Price Trend Analysis
- 12. Competitive Analysis
- 12.1. Company Profiles
- 12.1.1 BAE Systems
- 12.1.1.1. Company Overview
- 12.1.1.2. Products
- 12.1.1.3. Company Financials
- 12.1.1.4. SWOT Analysis
- 12.1.2 SENER Group
- 12.1.2.1. Company Overview
- 12.1.2.2. Products
- 12.1.2.3. Company Financials
- 12.1.2.4. SWOT Analysis
- 12.1.3 Lockheed Martin Corporation
- 12.1.3.1. Company Overview
- 12.1.3.2. Products
- 12.1.3.3. Company Financials
- 12.1.3.4. SWOT Analysis
- 12.1.4 The Boeing Compan
- 12.1.4.1. Company Overview
- 12.1.4.2. Products
- 12.1.4.3. Company Financials
- 12.1.4.4. SWOT Analysis
- 12.1.5 General Dynamics
- 12.1.5.1. Company Overview
- 12.1.5.2. Products
- 12.1.5.3. Company Financials
- 12.1.5.4. SWOT Analysis
- 12.1.6 Thales
- 12.1.6.1. Company Overview
- 12.1.6.2. Products
- 12.1.6.3. Company Financials
- 12.1.6.4. SWOT Analysis
- 12.1.7 OHB SE
- 12.1.7.1. Company Overview
- 12.1.7.2. Products
- 12.1.7.3. Company Financials
- 12.1.7.4. SWOT Analysis
- 12.1.8 Innovative Solutions in Space BV
- 12.1.8.1. Company Overview
- 12.1.8.2. Products
- 12.1.8.3. Company Financials
- 12.1.8.4. SWOT Analysis
- 12.1.9 Sitael S p A
- 12.1.9.1. Company Overview
- 12.1.9.2. Products
- 12.1.9.3. Company Financials
- 12.1.9.4. SWOT Analysis
- 12.1.10 Northrop Grumman Corporation
- 12.1.10.1. Company Overview
- 12.1.10.2. Products
- 12.1.10.3. Company Financials
- 12.1.10.4. SWOT Analysis
- 12.1.11 Jena-Optronik
- 12.1.11.1. Company Overview
- 12.1.11.2. Products
- 12.1.11.3. Company Financials
- 12.1.11.4. SWOT Analysis
- 12.1.12 AAC Clyde Space
- 12.1.12.1. Company Overview
- 12.1.12.2. Products
- 12.1.12.3. Company Financials
- 12.1.12.4. SWOT Analysis
- 12.1.1 BAE Systems
- 12.2. Market Entropy
- 12.2.1 Company's Key Areas Served
- 12.2.2 Recent Developments
- 12.3. Company Market Share Analysis 2025
- 12.3.1 Top 5 Companies Market Share Analysis
- 12.3.2 Top 3 Companies Market Share Analysis
- 12.4. List of Potential Customers
- 13. Research Methodology
List of Figures
- Figure 1: Global Satellite Parts and Components Market Revenue Breakdown (billion, %) by Region 2025 & 2033
- Figure 2: North America Satellite Parts and Components Market Revenue (billion), by Production Analysis 2025 & 2033
- Figure 3: North America Satellite Parts and Components Market Revenue Share (%), by Production Analysis 2025 & 2033
- Figure 4: North America Satellite Parts and Components Market Revenue (billion), by Consumption Analysis 2025 & 2033
- Figure 5: North America Satellite Parts and Components Market Revenue Share (%), by Consumption Analysis 2025 & 2033
- Figure 6: North America Satellite Parts and Components Market Revenue (billion), by Import Market Analysis (Value & Volume) 2025 & 2033
- Figure 7: North America Satellite Parts and Components Market Revenue Share (%), by Import Market Analysis (Value & Volume) 2025 & 2033
- Figure 8: North America Satellite Parts and Components Market Revenue (billion), by Export Market Analysis (Value & Volume) 2025 & 2033
- Figure 9: North America Satellite Parts and Components Market Revenue Share (%), by Export Market Analysis (Value & Volume) 2025 & 2033
- Figure 10: North America Satellite Parts and Components Market Revenue (billion), by Price Trend Analysis 2025 & 2033
- Figure 11: North America Satellite Parts and Components Market Revenue Share (%), by Price Trend Analysis 2025 & 2033
- Figure 12: North America Satellite Parts and Components Market Revenue (billion), by Country 2025 & 2033
- Figure 13: North America Satellite Parts and Components Market Revenue Share (%), by Country 2025 & 2033
- Figure 14: South America Satellite Parts and Components Market Revenue (billion), by Production Analysis 2025 & 2033
- Figure 15: South America Satellite Parts and Components Market Revenue Share (%), by Production Analysis 2025 & 2033
- Figure 16: South America Satellite Parts and Components Market Revenue (billion), by Consumption Analysis 2025 & 2033
- Figure 17: South America Satellite Parts and Components Market Revenue Share (%), by Consumption Analysis 2025 & 2033
- Figure 18: South America Satellite Parts and Components Market Revenue (billion), by Import Market Analysis (Value & Volume) 2025 & 2033
- Figure 19: South America Satellite Parts and Components Market Revenue Share (%), by Import Market Analysis (Value & Volume) 2025 & 2033
- Figure 20: South America Satellite Parts and Components Market Revenue (billion), by Export Market Analysis (Value & Volume) 2025 & 2033
- Figure 21: South America Satellite Parts and Components Market Revenue Share (%), by Export Market Analysis (Value & Volume) 2025 & 2033
- Figure 22: South America Satellite Parts and Components Market Revenue (billion), by Price Trend Analysis 2025 & 2033
- Figure 23: South America Satellite Parts and Components Market Revenue Share (%), by Price Trend Analysis 2025 & 2033
- Figure 24: South America Satellite Parts and Components Market Revenue (billion), by Country 2025 & 2033
- Figure 25: South America Satellite Parts and Components Market Revenue Share (%), by Country 2025 & 2033
- Figure 26: Europe Satellite Parts and Components Market Revenue (billion), by Production Analysis 2025 & 2033
- Figure 27: Europe Satellite Parts and Components Market Revenue Share (%), by Production Analysis 2025 & 2033
- Figure 28: Europe Satellite Parts and Components Market Revenue (billion), by Consumption Analysis 2025 & 2033
- Figure 29: Europe Satellite Parts and Components Market Revenue Share (%), by Consumption Analysis 2025 & 2033
- Figure 30: Europe Satellite Parts and Components Market Revenue (billion), by Import Market Analysis (Value & Volume) 2025 & 2033
- Figure 31: Europe Satellite Parts and Components Market Revenue Share (%), by Import Market Analysis (Value & Volume) 2025 & 2033
- Figure 32: Europe Satellite Parts and Components Market Revenue (billion), by Export Market Analysis (Value & Volume) 2025 & 2033
- Figure 33: Europe Satellite Parts and Components Market Revenue Share (%), by Export Market Analysis (Value & Volume) 2025 & 2033
- Figure 34: Europe Satellite Parts and Components Market Revenue (billion), by Price Trend Analysis 2025 & 2033
- Figure 35: Europe Satellite Parts and Components Market Revenue Share (%), by Price Trend Analysis 2025 & 2033
- Figure 36: Europe Satellite Parts and Components Market Revenue (billion), by Country 2025 & 2033
- Figure 37: Europe Satellite Parts and Components Market Revenue Share (%), by Country 2025 & 2033
- Figure 38: Middle East & Africa Satellite Parts and Components Market Revenue (billion), by Production Analysis 2025 & 2033
- Figure 39: Middle East & Africa Satellite Parts and Components Market Revenue Share (%), by Production Analysis 2025 & 2033
- Figure 40: Middle East & Africa Satellite Parts and Components Market Revenue (billion), by Consumption Analysis 2025 & 2033
- Figure 41: Middle East & Africa Satellite Parts and Components Market Revenue Share (%), by Consumption Analysis 2025 & 2033
- Figure 42: Middle East & Africa Satellite Parts and Components Market Revenue (billion), by Import Market Analysis (Value & Volume) 2025 & 2033
- Figure 43: Middle East & Africa Satellite Parts and Components Market Revenue Share (%), by Import Market Analysis (Value & Volume) 2025 & 2033
- Figure 44: Middle East & Africa Satellite Parts and Components Market Revenue (billion), by Export Market Analysis (Value & Volume) 2025 & 2033
- Figure 45: Middle East & Africa Satellite Parts and Components Market Revenue Share (%), by Export Market Analysis (Value & Volume) 2025 & 2033
- Figure 46: Middle East & Africa Satellite Parts and Components Market Revenue (billion), by Price Trend Analysis 2025 & 2033
- Figure 47: Middle East & Africa Satellite Parts and Components Market Revenue Share (%), by Price Trend Analysis 2025 & 2033
- Figure 48: Middle East & Africa Satellite Parts and Components Market Revenue (billion), by Country 2025 & 2033
- Figure 49: Middle East & Africa Satellite Parts and Components Market Revenue Share (%), by Country 2025 & 2033
- Figure 50: Asia Pacific Satellite Parts and Components Market Revenue (billion), by Production Analysis 2025 & 2033
- Figure 51: Asia Pacific Satellite Parts and Components Market Revenue Share (%), by Production Analysis 2025 & 2033
- Figure 52: Asia Pacific Satellite Parts and Components Market Revenue (billion), by Consumption Analysis 2025 & 2033
- Figure 53: Asia Pacific Satellite Parts and Components Market Revenue Share (%), by Consumption Analysis 2025 & 2033
- Figure 54: Asia Pacific Satellite Parts and Components Market Revenue (billion), by Import Market Analysis (Value & Volume) 2025 & 2033
- Figure 55: Asia Pacific Satellite Parts and Components Market Revenue Share (%), by Import Market Analysis (Value & Volume) 2025 & 2033
- Figure 56: Asia Pacific Satellite Parts and Components Market Revenue (billion), by Export Market Analysis (Value & Volume) 2025 & 2033
- Figure 57: Asia Pacific Satellite Parts and Components Market Revenue Share (%), by Export Market Analysis (Value & Volume) 2025 & 2033
- Figure 58: Asia Pacific Satellite Parts and Components Market Revenue (billion), by Price Trend Analysis 2025 & 2033
- Figure 59: Asia Pacific Satellite Parts and Components Market Revenue Share (%), by Price Trend Analysis 2025 & 2033
- Figure 60: Asia Pacific Satellite Parts and Components Market Revenue (billion), by Country 2025 & 2033
- Figure 61: Asia Pacific Satellite Parts and Components Market Revenue Share (%), by Country 2025 & 2033
List of Tables
- Table 1: Global Satellite Parts and Components Market Revenue billion Forecast, by Production Analysis 2020 & 2033
- Table 2: Global Satellite Parts and Components Market Revenue billion Forecast, by Consumption Analysis 2020 & 2033
- Table 3: Global Satellite Parts and Components Market Revenue billion Forecast, by Import Market Analysis (Value & Volume) 2020 & 2033
- Table 4: Global Satellite Parts and Components Market Revenue billion Forecast, by Export Market Analysis (Value & Volume) 2020 & 2033
- Table 5: Global Satellite Parts and Components Market Revenue billion Forecast, by Price Trend Analysis 2020 & 2033
- Table 6: Global Satellite Parts and Components Market Revenue billion Forecast, by Region 2020 & 2033
- Table 7: Global Satellite Parts and Components Market Revenue billion Forecast, by Production Analysis 2020 & 2033
- Table 8: Global Satellite Parts and Components Market Revenue billion Forecast, by Consumption Analysis 2020 & 2033
- Table 9: Global Satellite Parts and Components Market Revenue billion Forecast, by Import Market Analysis (Value & Volume) 2020 & 2033
- Table 10: Global Satellite Parts and Components Market Revenue billion Forecast, by Export Market Analysis (Value & Volume) 2020 & 2033
- Table 11: Global Satellite Parts and Components Market Revenue billion Forecast, by Price Trend Analysis 2020 & 2033
- Table 12: Global Satellite Parts and Components Market Revenue billion Forecast, by Country 2020 & 2033
- Table 13: United States Satellite Parts and Components Market Revenue (billion) Forecast, by Application 2020 & 2033
- Table 14: Canada Satellite Parts and Components Market Revenue (billion) Forecast, by Application 2020 & 2033
- Table 15: Mexico Satellite Parts and Components Market Revenue (billion) Forecast, by Application 2020 & 2033
- Table 16: Global Satellite Parts and Components Market Revenue billion Forecast, by Production Analysis 2020 & 2033
- Table 17: Global Satellite Parts and Components Market Revenue billion Forecast, by Consumption Analysis 2020 & 2033
- Table 18: Global Satellite Parts and Components Market Revenue billion Forecast, by Import Market Analysis (Value & Volume) 2020 & 2033
- Table 19: Global Satellite Parts and Components Market Revenue billion Forecast, by Export Market Analysis (Value & Volume) 2020 & 2033
- Table 20: Global Satellite Parts and Components Market Revenue billion Forecast, by Price Trend Analysis 2020 & 2033
- Table 21: Global Satellite Parts and Components Market Revenue billion Forecast, by Country 2020 & 2033
- Table 22: Brazil Satellite Parts and Components Market Revenue (billion) Forecast, by Application 2020 & 2033
- Table 23: Argentina Satellite Parts and Components Market Revenue (billion) Forecast, by Application 2020 & 2033
- Table 24: Rest of South America Satellite Parts and Components Market Revenue (billion) Forecast, by Application 2020 & 2033
- Table 25: Global Satellite Parts and Components Market Revenue billion Forecast, by Production Analysis 2020 & 2033
- Table 26: Global Satellite Parts and Components Market Revenue billion Forecast, by Consumption Analysis 2020 & 2033
- Table 27: Global Satellite Parts and Components Market Revenue billion Forecast, by Import Market Analysis (Value & Volume) 2020 & 2033
- Table 28: Global Satellite Parts and Components Market Revenue billion Forecast, by Export Market Analysis (Value & Volume) 2020 & 2033
- Table 29: Global Satellite Parts and Components Market Revenue billion Forecast, by Price Trend Analysis 2020 & 2033
- Table 30: Global Satellite Parts and Components Market Revenue billion Forecast, by Country 2020 & 2033
- Table 31: United Kingdom Satellite Parts and Components Market Revenue (billion) Forecast, by Application 2020 & 2033
- Table 32: Germany Satellite Parts and Components Market Revenue (billion) Forecast, by Application 2020 & 2033
- Table 33: France Satellite Parts and Components Market Revenue (billion) Forecast, by Application 2020 & 2033
- Table 34: Italy Satellite Parts and Components Market Revenue (billion) Forecast, by Application 2020 & 2033
- Table 35: Spain Satellite Parts and Components Market Revenue (billion) Forecast, by Application 2020 & 2033
- Table 36: Russia Satellite Parts and Components Market Revenue (billion) Forecast, by Application 2020 & 2033
- Table 37: Benelux Satellite Parts and Components Market Revenue (billion) Forecast, by Application 2020 & 2033
- Table 38: Nordics Satellite Parts and Components Market Revenue (billion) Forecast, by Application 2020 & 2033
- Table 39: Rest of Europe Satellite Parts and Components Market Revenue (billion) Forecast, by Application 2020 & 2033
- Table 40: Global Satellite Parts and Components Market Revenue billion Forecast, by Production Analysis 2020 & 2033
- Table 41: Global Satellite Parts and Components Market Revenue billion Forecast, by Consumption Analysis 2020 & 2033
- Table 42: Global Satellite Parts and Components Market Revenue billion Forecast, by Import Market Analysis (Value & Volume) 2020 & 2033
- Table 43: Global Satellite Parts and Components Market Revenue billion Forecast, by Export Market Analysis (Value & Volume) 2020 & 2033
- Table 44: Global Satellite Parts and Components Market Revenue billion Forecast, by Price Trend Analysis 2020 & 2033
- Table 45: Global Satellite Parts and Components Market Revenue billion Forecast, by Country 2020 & 2033
- Table 46: Turkey Satellite Parts and Components Market Revenue (billion) Forecast, by Application 2020 & 2033
- Table 47: Israel Satellite Parts and Components Market Revenue (billion) Forecast, by Application 2020 & 2033
- Table 48: GCC Satellite Parts and Components Market Revenue (billion) Forecast, by Application 2020 & 2033
- Table 49: North Africa Satellite Parts and Components Market Revenue (billion) Forecast, by Application 2020 & 2033
- Table 50: South Africa Satellite Parts and Components Market Revenue (billion) Forecast, by Application 2020 & 2033
- Table 51: Rest of Middle East & Africa Satellite Parts and Components Market Revenue (billion) Forecast, by Application 2020 & 2033
- Table 52: Global Satellite Parts and Components Market Revenue billion Forecast, by Production Analysis 2020 & 2033
- Table 53: Global Satellite Parts and Components Market Revenue billion Forecast, by Consumption Analysis 2020 & 2033
- Table 54: Global Satellite Parts and Components Market Revenue billion Forecast, by Import Market Analysis (Value & Volume) 2020 & 2033
- Table 55: Global Satellite Parts and Components Market Revenue billion Forecast, by Export Market Analysis (Value & Volume) 2020 & 2033
- Table 56: Global Satellite Parts and Components Market Revenue billion Forecast, by Price Trend Analysis 2020 & 2033
- Table 57: Global Satellite Parts and Components Market Revenue billion Forecast, by Country 2020 & 2033
- Table 58: China Satellite Parts and Components Market Revenue (billion) Forecast, by Application 2020 & 2033
- Table 59: India Satellite Parts and Components Market Revenue (billion) Forecast, by Application 2020 & 2033
- Table 60: Japan Satellite Parts and Components Market Revenue (billion) Forecast, by Application 2020 & 2033
- Table 61: South Korea Satellite Parts and Components Market Revenue (billion) Forecast, by Application 2020 & 2033
- Table 62: ASEAN Satellite Parts and Components Market Revenue (billion) Forecast, by Application 2020 & 2033
- Table 63: Oceania Satellite Parts and Components Market Revenue (billion) Forecast, by Application 2020 & 2033
- Table 64: Rest of Asia Pacific Satellite Parts and Components Market Revenue (billion) Forecast, by Application 2020 & 2033
Frequently Asked Questions
1. What is the projected Compound Annual Growth Rate (CAGR) of the Satellite Parts and Components Market?
The projected CAGR is approximately 7%.
2. Which companies are prominent players in the Satellite Parts and Components Market?
Key companies in the market include BAE Systems, SENER Group, Lockheed Martin Corporation, The Boeing Compan, General Dynamics, Thales, OHB SE, Innovative Solutions in Space BV, Sitael S p A, Northrop Grumman Corporation, Jena-Optronik, AAC Clyde Space.
3. What are the main segments of the Satellite Parts and Components Market?
The market segments include Production Analysis, Consumption Analysis, Import Market Analysis (Value & Volume), Export Market Analysis (Value & Volume), Price Trend Analysis.
4. Can you provide details about the market size?
The market size is estimated to be USD 25 billion as of 2022.
5. What are some drivers contributing to market growth?
N/A
6. What are the notable trends driving market growth?
OTHER KEY INDUSTRY TRENDS COVERED IN THE REPORT.
7. Are there any restraints impacting market growth?
N/A
8. Can you provide examples of recent developments in the market?
January 2023: ISISPACE has launched 47 payloads from 8 different countries during its ISILAUNCH38 mission on board Falcon 9 Rocket. ISILAUNCH partnered with SpaceBD from Japan, to jointly manifest payloads from Japan, Europe, and other parts of the world on the launch on one of the ports on this launch.December 2022: ASTRO CL, the smallest member of the Jena-Optronik star sensor family was be used on the new LEO platform from Maxar. Each satellite is equipped with two ASTRO CL sensors, which support the attitude control of these satellites.November 2022: As part of NASA's Artemis I mission, the Orion spacecraft successfully launched into space on November 16, 2022. Two star trackers from Jena-Optronik GmbH guided the Orion on its way to lunar orbit.
9. What pricing options are available for accessing the report?
Pricing options include single-user, multi-user, and enterprise licenses priced at USD 3800, USD 4500, and USD 5800 respectively.
10. Is the market size provided in terms of value or volume?
The market size is provided in terms of value, measured in billion.
11. Are there any specific market keywords associated with the report?
Yes, the market keyword associated with the report is "Satellite Parts and Components Market," which aids in identifying and referencing the specific market segment covered.
12. How do I determine which pricing option suits my needs best?
The pricing options vary based on user requirements and access needs. Individual users may opt for single-user licenses, while businesses requiring broader access may choose multi-user or enterprise licenses for cost-effective access to the report.
13. Are there any additional resources or data provided in the Satellite Parts and Components Market report?
While the report offers comprehensive insights, it's advisable to review the specific contents or supplementary materials provided to ascertain if additional resources or data are available.
14. How can I stay updated on further developments or reports in the Satellite Parts and Components Market?
To stay informed about further developments, trends, and reports in the Satellite Parts and Components Market, consider subscribing to industry newsletters, following relevant companies and organizations, or regularly checking reputable industry news sources and publications.
Methodology
Step 1 - Identification of Relevant Samples Size from Population Database


Step 2 - Approaches for Defining Global Market Size (Value, Volume* & Price*)

Note*: In applicable scenarios
Step 3 - Data Sources
Primary Research
- Web Analytics
- Survey Reports
- Research Institute
- Latest Research Reports
- Opinion Leaders
Secondary Research
- Annual Reports
- White Paper
- Latest Press Release
- Industry Association
- Paid Database
- Investor Presentations

Step 4 - Data Triangulation
Involves using different sources of information in order to increase the validity of a study
These sources are likely to be stakeholders in a program - participants, other researchers, program staff, other community members, and so on.
Then we put all data in single framework & apply various statistical tools to find out the dynamic on the market.
During the analysis stage, feedback from the stakeholder groups would be compared to determine areas of agreement as well as areas of divergence