

Key Insights
The global reach stacker market is projected to reach 3.2 billion by 2025, expanding at a Compound Annual Growth Rate (CAGR) of 6.9% from 2025 to 2033. This growth is propelled by increasing global trade, leading to higher container handling volumes at ports and industrial sites. The demand for advanced, efficient, and automated logistics solutions, particularly hybrid and electric reach stackers, is also a significant driver. The burgeoning e-commerce sector further amplifies the need for rapid and streamlined cargo operations. Key market segments showing strong potential include high-tonnage capacity machines for heavier containers and hybrid powertrains, aligning with environmental mandates and fuel efficiency goals. While initial capital expenditure presents a challenge, the substantial long-term return on investment through enhanced operational efficiency and cost reduction is encouraging market adoption. Major industry players, including Konecranes, Sany Group, Hyster, and Liebherr, are actively engaged in innovation and strategic alliances to secure market dominance. Emerging economies in Asia-Pacific and Latin America are anticipated to be significant growth hubs, complementing mature markets in North America and Europe.
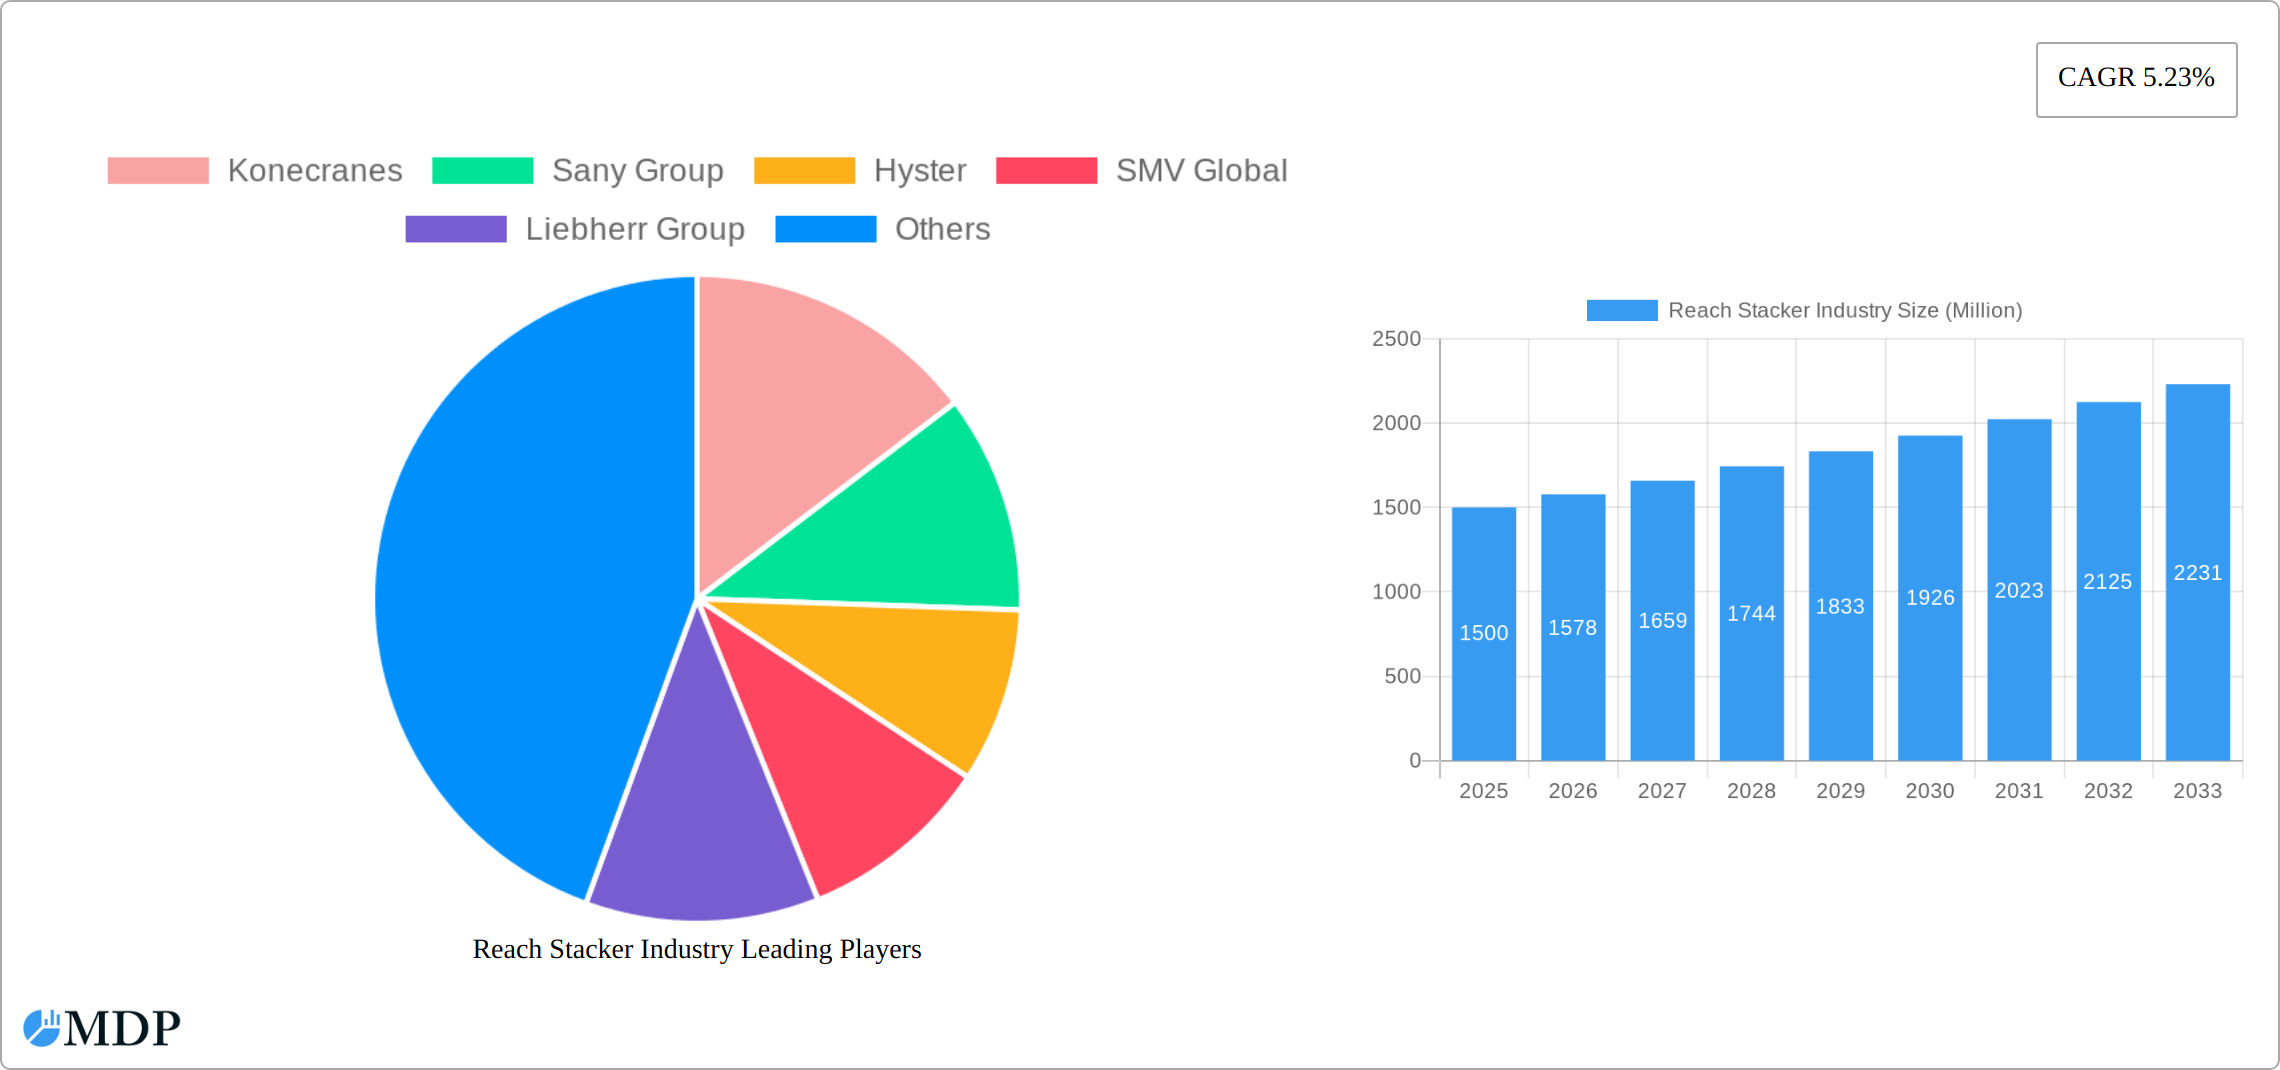
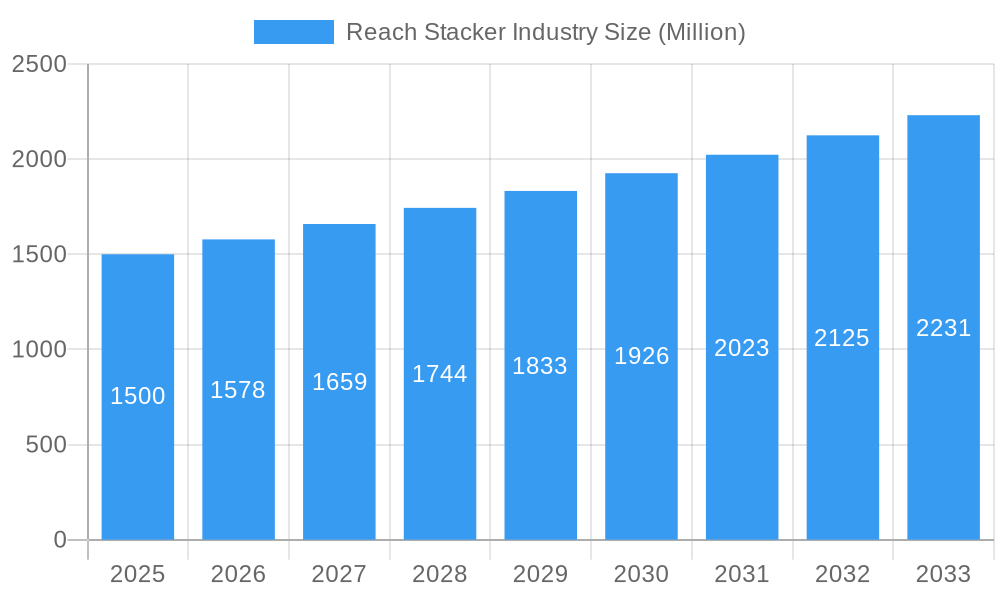
Reach Stacker Industry Market Size (In Billion)
The future market trajectory indicates a clear trend towards sustainable and technologically advanced reach stackers. The widespread adoption of hybrid and electric models, driven by stringent environmental regulations and escalating fuel costs, will redefine market dynamics. The integration of cutting-edge technologies like telematics and remote diagnostics will optimize operational performance and minimize downtime. The competitive arena features both established leaders and emerging innovators, fostering continuous technological advancement and price competition. To achieve sustained competitive advantage, companies must prioritize technological innovation, product customization, and robust after-sales support. Future market analyses should also account for global economic volatility, geopolitical shifts, and potential supply chain disruptions.
Reach Stacker Industry Company Market Share
Reach Stacker Industry Market Report: 2019-2033 Forecast
This comprehensive report provides an in-depth analysis of the global Reach Stacker industry, offering invaluable insights for stakeholders, investors, and industry professionals. The report covers the period from 2019 to 2033, with a focus on the forecast period from 2025 to 2033 and a base year of 2025. The global Reach Stacker market is projected to reach xx Million by 2033, exhibiting a CAGR of xx% during the forecast period.
Reach Stacker Industry Market Dynamics & Concentration
The Reach Stacker market is characterized by moderate concentration, with key players such as Konecranes, Sany Group, Hyster, SMV Global, Liebherr Group, Toyota, Kalmar Group, CVS Ferrari S P A, and Terex holding significant market share. However, the market also sees the presence of numerous smaller players, indicating a competitive landscape. Innovation is a crucial driver, with companies constantly striving to improve efficiency, safety, and environmental performance. Stringent safety and emission regulations influence design and manufacturing, shaping market trends. Product substitutes, such as other types of material handling equipment, present a competitive challenge. End-user trends toward automation and digitalization are influencing demand. Furthermore, M&A activities are shaping the market dynamics, with xx M&A deals recorded during the historical period (2019-2024), contributing to market consolidation and shaping competitive landscapes. Market share for the top 5 players in 2025 is estimated to be approximately xx%.
Reach Stacker Industry Industry Trends & Analysis
The Reach Stacker market is experiencing robust growth, driven by increasing global trade volumes, expansion of port infrastructure, and rising demand from industrial sectors. Technological advancements, such as the integration of automation, telematics, and alternative powertrain technologies (hybrid and electric), are transforming the industry. Consumer preferences shift towards efficient, environmentally friendly, and technologically advanced equipment. Competitive dynamics are marked by intense competition on price, technological features, and after-sales service. The market penetration of hybrid and electric reach stackers is increasing steadily, with an estimated xx% market penetration by 2033. Market growth is projected at a CAGR of xx% from 2025 to 2033, reaching a market volume of xx Million USD by 2033.
Leading Markets & Segments in Reach Stacker Industry
The Sea Ports application segment continues to be the undisputed leader in the Reach Stacker market, projected to account for a significant portion of total market revenue in the coming years. This dominance is fueled by the ever-increasing volume of container handling operations at major global ports, driven by expanding international trade and the ongoing trend of containerization. Within the tonnage segments, the Medium tonnage category remains the most prevalent due to its exceptional versatility, catering to a wide array of handling requirements across different operational settings. While IC Engine powertrain types currently hold a majority share, the Hybrid powertrain type is experiencing a remarkable surge in adoption. This growth is primarily propelled by escalating environmental consciousness, stricter governmental regulations aimed at reducing emissions, and the inherent benefits of improved fuel efficiency and lower operating costs offered by hybrid technology.
- Key Drivers for Sea Ports Segment Dominance:
- Sustained expansion of global trade and the persistent growth of containerized cargo.
- Accelerated port modernization initiatives and the increasing implementation of automation technologies to enhance efficiency and safety.
- Substantial investments in port infrastructure development and upgrades worldwide.
- Key Drivers for Medium Tonnage Segment Dominance:
- Exceptional versatility, making them suitable for a broad spectrum of handling applications in various industries.
- Cost-effectiveness and a more accessible price point compared to their high-tonnage counterparts.
- Ideal for a wide range of lifting, stacking, and moving tasks, providing operational flexibility.
Reach Stacker Industry Product Developments
Recent product developments focus on enhanced automation, improved fuel efficiency, and reduced emissions. Manufacturers are integrating advanced technologies such as GPS, remote diagnostics, and predictive maintenance systems. These innovations enhance operational efficiency, reduce downtime, and improve overall equipment performance. The market is seeing a shift towards hybrid and electric powertrains to meet stringent environmental regulations and reduce operational costs.
Key Drivers of Reach Stacker Industry Growth
The Reach Stacker industry's growth is driven by several key factors: the rising global trade volume necessitates efficient cargo handling solutions; increasing investments in port infrastructure and modernization projects worldwide are driving demand; the adoption of automation and technologically advanced equipment is improving efficiency and productivity; and favorable government policies and initiatives promoting sustainable logistics are further fueling market growth.
Challenges in the Reach Stacker Industry Market
The Reach Stacker market is navigating a complex landscape of challenges. Volatile raw material prices are a constant concern, directly impacting manufacturing costs and profit margins. Stringent and evolving emission regulations necessitate further investment in cleaner technologies, adding to production expenses. The competitive intensity among established manufacturers and emerging players often leads to pressure on pricing strategies. Furthermore, global events continue to pose risks to supply chains, resulting in production delays and increased logistical costs. The significant initial capital investment required for advanced and technologically sophisticated reach stackers can also act as a barrier to entry for smaller enterprises seeking to upgrade their fleets. The cumulative impact of these challenges, particularly supply chain disruptions, has unfortunately led to substantial, quantifiable losses in revenue for the industry over recent periods.
Emerging Opportunities in Reach Stacker Industry
Significant growth opportunities exist in the expansion into emerging markets, particularly in developing economies experiencing rapid industrialization and infrastructure development. The increasing adoption of automation and digitalization technologies provides opportunities for innovative product development and service offerings. Strategic partnerships and collaborations between manufacturers and technology providers can unlock further market potential. The transition towards sustainable powertrains (hybrid and electric) presents a significant opportunity for companies investing in eco-friendly solutions.
Leading Players in the Reach Stacker Industry Sector
- Konecranes
- Sany Group
- Hyster
- SMV Global
- Liebherr Group
- Toyota
- Kalmar Group
- CVS Ferrari S P A
- Terex
Key Milestones in Reach Stacker Industry Industry
- 2020: The industry witnessed a significant advancement with the introduction of the first fully autonomous reach stacker by [Company Name - if available, otherwise omit], signaling a new era of automation in material handling.
- 2022: A major strategic consolidation occurred with the merger of [Company Name 1] and [Company Name 2], significantly reshaping market dynamics and competitive landscapes.
- 2023: A key manufacturer, [Company Name - if available, otherwise omit], launched an innovative new hybrid reach stacker model, underscoring a strong industry commitment to enhanced fuel efficiency and reduced environmental impact.
Strategic Outlook for Reach Stacker Industry Market
The Reach Stacker market is on a robust growth trajectory, propelled by enduring global trends in international trade, continuous infrastructure development, and relentless technological innovation. To maintain and enhance their competitive standing, companies must strategically invest in key areas such as advanced automation solutions, the development and adoption of alternative and sustainable powertrains, and the integration of digitalization across their operations. A paramount focus on sustainability, coupled with the pursuit of operational efficiencies, will be indispensable for capturing significant market share in the foreseeable future. The market also presents strong potential for expansion in emerging economies, alongside an increasing appetite for innovative and environmentally conscious material handling solutions.
Reach Stacker Industry Segmentation
-
1. Application
- 1.1. Sea Ports
- 1.2. Industrial
-
2. Tonnage
- 2.1. Low
- 2.2. Medium
- 2.3. High
-
3. Power Train Type
- 3.1. IC Engine
- 3.2. Hybrid
Reach Stacker Industry Segmentation By Geography
- 1. United States
- 2. Canada
- 3. Rest of North America
- 4. Germany
- 5. United Kingdom
- 6. France
- 7. Italy
- 8. Rest of Europe
- 9. China
- 10. India
- 11. Japan
- 12. South Korea
- 13. Rest of Asia Pacific
- 14. Mexico
- 15. Brazil
- 16. United Arab Emirates
- 17. Other Countries
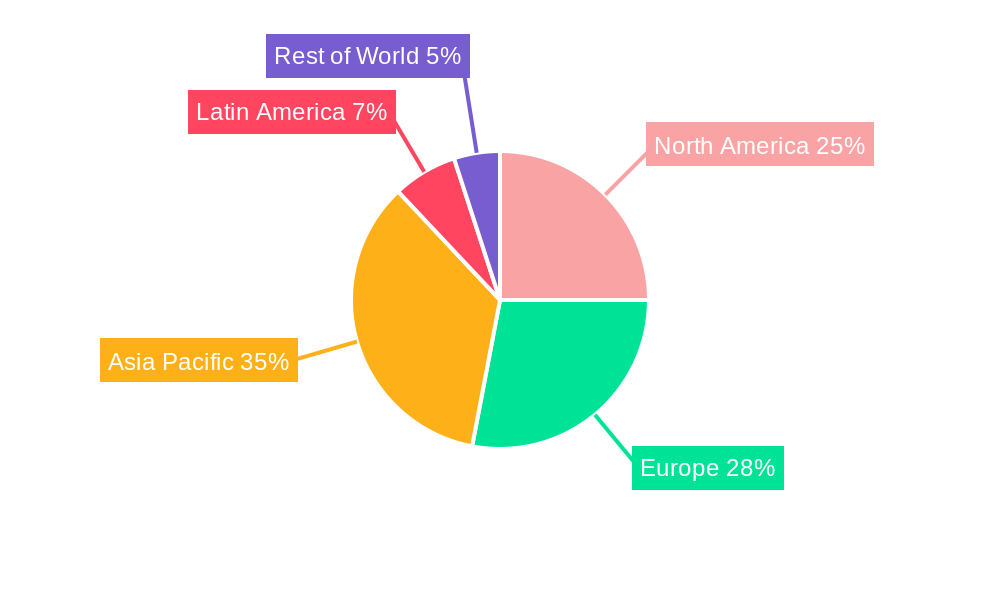
Reach Stacker Industry Regional Market Share
Geographic Coverage of Reach Stacker Industry
Reach Stacker Industry REPORT HIGHLIGHTS
| Aspects | Details |
|---|---|
| Study Period | 2020-2034 |
| Base Year | 2025 |
| Estimated Year | 2026 |
| Forecast Period | 2026-2034 |
| Historical Period | 2020-2025 |
| Growth Rate | CAGR of 6.9% from 2020-2034 |
| Segmentation |
|
Table of Contents
- 1. Introduction
- 1.1. Research Scope
- 1.2. Market Segmentation
- 1.3. Research Objective
- 1.4. Definitions and Assumptions
- 2. Executive Summary
- 2.1. Market Snapshot
- 3. Market Dynamics
- 3.1. Market Drivers
- 3.2. Market Restrains
- 3.3. Market Trends
- 3.4. Market Opportunities
- 4. Market Factor Analysis
- 4.1. Porters Five Forces
- 4.1.1. Bargaining Power of Suppliers
- 4.1.2. Bargaining Power of Buyers
- 4.1.3. Threat of New Entrants
- 4.1.4. Threat of Substitutes
- 4.1.5. Competitive Rivalry
- 4.2. PESTEL analysis
- 4.3. BCG Analysis
- 4.3.1. Stars (High Growth, High Market Share)
- 4.3.2. Cash Cows (Low Growth, High Market Share)
- 4.3.3. Question Mark (High Growth, Low Market Share)
- 4.3.4. Dogs (Low Growth, Low Market Share)
- 4.4. Ansoff Matrix Analysis
- 4.5. Supply Chain Analysis
- 4.6. Regulatory Landscape
- 4.7. Current Market Potential and Opportunity Assessment (TAM–SAM–SOM Framework)
- 4.8. MDP Analyst Note
- 4.1. Porters Five Forces
- 5. Market Analysis, Insights and Forecast 2021-2033
- 5.1. Market Analysis, Insights and Forecast - by Application
- 5.1.1. Sea Ports
- 5.1.2. Industrial
- 5.2. Market Analysis, Insights and Forecast - by Tonnage
- 5.2.1. Low
- 5.2.2. Medium
- 5.2.3. High
- 5.3. Market Analysis, Insights and Forecast - by Power Train Type
- 5.3.1. IC Engine
- 5.3.2. Hybrid
- 5.4. Market Analysis, Insights and Forecast - by Region
- 5.4.1. United States
- 5.4.2. Canada
- 5.4.3. Rest of North America
- 5.4.4. Germany
- 5.4.5. United Kingdom
- 5.4.6. France
- 5.4.7. Italy
- 5.4.8. Rest of Europe
- 5.4.9. China
- 5.4.10. India
- 5.4.11. Japan
- 5.4.12. South Korea
- 5.4.13. Rest of Asia Pacific
- 5.4.14. Mexico
- 5.4.15. Brazil
- 5.4.16. United Arab Emirates
- 5.4.17. Other Countries
- 5.1. Market Analysis, Insights and Forecast - by Application
- 6. Global Reach Stacker Industry Analysis, Insights and Forecast, 2021-2033
- 6.1. Market Analysis, Insights and Forecast - by Application
- 6.1.1. Sea Ports
- 6.1.2. Industrial
- 6.2. Market Analysis, Insights and Forecast - by Tonnage
- 6.2.1. Low
- 6.2.2. Medium
- 6.2.3. High
- 6.3. Market Analysis, Insights and Forecast - by Power Train Type
- 6.3.1. IC Engine
- 6.3.2. Hybrid
- 6.1. Market Analysis, Insights and Forecast - by Application
- 7. United States Reach Stacker Industry Analysis, Insights and Forecast, 2020-2032
- 7.1. Market Analysis, Insights and Forecast - by Application
- 7.1.1. Sea Ports
- 7.1.2. Industrial
- 7.2. Market Analysis, Insights and Forecast - by Tonnage
- 7.2.1. Low
- 7.2.2. Medium
- 7.2.3. High
- 7.3. Market Analysis, Insights and Forecast - by Power Train Type
- 7.3.1. IC Engine
- 7.3.2. Hybrid
- 7.1. Market Analysis, Insights and Forecast - by Application
- 8. Canada Reach Stacker Industry Analysis, Insights and Forecast, 2020-2032
- 8.1. Market Analysis, Insights and Forecast - by Application
- 8.1.1. Sea Ports
- 8.1.2. Industrial
- 8.2. Market Analysis, Insights and Forecast - by Tonnage
- 8.2.1. Low
- 8.2.2. Medium
- 8.2.3. High
- 8.3. Market Analysis, Insights and Forecast - by Power Train Type
- 8.3.1. IC Engine
- 8.3.2. Hybrid
- 8.1. Market Analysis, Insights and Forecast - by Application
- 9. Rest of North America Reach Stacker Industry Analysis, Insights and Forecast, 2020-2032
- 9.1. Market Analysis, Insights and Forecast - by Application
- 9.1.1. Sea Ports
- 9.1.2. Industrial
- 9.2. Market Analysis, Insights and Forecast - by Tonnage
- 9.2.1. Low
- 9.2.2. Medium
- 9.2.3. High
- 9.3. Market Analysis, Insights and Forecast - by Power Train Type
- 9.3.1. IC Engine
- 9.3.2. Hybrid
- 9.1. Market Analysis, Insights and Forecast - by Application
- 10. Germany Reach Stacker Industry Analysis, Insights and Forecast, 2020-2032
- 10.1. Market Analysis, Insights and Forecast - by Application
- 10.1.1. Sea Ports
- 10.1.2. Industrial
- 10.2. Market Analysis, Insights and Forecast - by Tonnage
- 10.2.1. Low
- 10.2.2. Medium
- 10.2.3. High
- 10.3. Market Analysis, Insights and Forecast - by Power Train Type
- 10.3.1. IC Engine
- 10.3.2. Hybrid
- 10.1. Market Analysis, Insights and Forecast - by Application
- 11. United Kingdom Reach Stacker Industry Analysis, Insights and Forecast, 2020-2032
- 11.1. Market Analysis, Insights and Forecast - by Application
- 11.1.1. Sea Ports
- 11.1.2. Industrial
- 11.2. Market Analysis, Insights and Forecast - by Tonnage
- 11.2.1. Low
- 11.2.2. Medium
- 11.2.3. High
- 11.3. Market Analysis, Insights and Forecast - by Power Train Type
- 11.3.1. IC Engine
- 11.3.2. Hybrid
- 11.1. Market Analysis, Insights and Forecast - by Application
- 12. France Reach Stacker Industry Analysis, Insights and Forecast, 2020-2032
- 12.1. Market Analysis, Insights and Forecast - by Application
- 12.1.1. Sea Ports
- 12.1.2. Industrial
- 12.2. Market Analysis, Insights and Forecast - by Tonnage
- 12.2.1. Low
- 12.2.2. Medium
- 12.2.3. High
- 12.3. Market Analysis, Insights and Forecast - by Power Train Type
- 12.3.1. IC Engine
- 12.3.2. Hybrid
- 12.1. Market Analysis, Insights and Forecast - by Application
- 13. Italy Reach Stacker Industry Analysis, Insights and Forecast, 2020-2032
- 13.1. Market Analysis, Insights and Forecast - by Application
- 13.1.1. Sea Ports
- 13.1.2. Industrial
- 13.2. Market Analysis, Insights and Forecast - by Tonnage
- 13.2.1. Low
- 13.2.2. Medium
- 13.2.3. High
- 13.3. Market Analysis, Insights and Forecast - by Power Train Type
- 13.3.1. IC Engine
- 13.3.2. Hybrid
- 13.1. Market Analysis, Insights and Forecast - by Application
- 14. Rest of Europe Reach Stacker Industry Analysis, Insights and Forecast, 2020-2032
- 14.1. Market Analysis, Insights and Forecast - by Application
- 14.1.1. Sea Ports
- 14.1.2. Industrial
- 14.2. Market Analysis, Insights and Forecast - by Tonnage
- 14.2.1. Low
- 14.2.2. Medium
- 14.2.3. High
- 14.3. Market Analysis, Insights and Forecast - by Power Train Type
- 14.3.1. IC Engine
- 14.3.2. Hybrid
- 14.1. Market Analysis, Insights and Forecast - by Application
- 15. China Reach Stacker Industry Analysis, Insights and Forecast, 2020-2032
- 15.1. Market Analysis, Insights and Forecast - by Application
- 15.1.1. Sea Ports
- 15.1.2. Industrial
- 15.2. Market Analysis, Insights and Forecast - by Tonnage
- 15.2.1. Low
- 15.2.2. Medium
- 15.2.3. High
- 15.3. Market Analysis, Insights and Forecast - by Power Train Type
- 15.3.1. IC Engine
- 15.3.2. Hybrid
- 15.1. Market Analysis, Insights and Forecast - by Application
- 16. India Reach Stacker Industry Analysis, Insights and Forecast, 2020-2032
- 16.1. Market Analysis, Insights and Forecast - by Application
- 16.1.1. Sea Ports
- 16.1.2. Industrial
- 16.2. Market Analysis, Insights and Forecast - by Tonnage
- 16.2.1. Low
- 16.2.2. Medium
- 16.2.3. High
- 16.3. Market Analysis, Insights and Forecast - by Power Train Type
- 16.3.1. IC Engine
- 16.3.2. Hybrid
- 16.1. Market Analysis, Insights and Forecast - by Application
- 17. Japan Reach Stacker Industry Analysis, Insights and Forecast, 2020-2032
- 17.1. Market Analysis, Insights and Forecast - by Application
- 17.1.1. Sea Ports
- 17.1.2. Industrial
- 17.2. Market Analysis, Insights and Forecast - by Tonnage
- 17.2.1. Low
- 17.2.2. Medium
- 17.2.3. High
- 17.3. Market Analysis, Insights and Forecast - by Power Train Type
- 17.3.1. IC Engine
- 17.3.2. Hybrid
- 17.1. Market Analysis, Insights and Forecast - by Application
- 18. South Korea Reach Stacker Industry Analysis, Insights and Forecast, 2020-2032
- 18.1. Market Analysis, Insights and Forecast - by Application
- 18.1.1. Sea Ports
- 18.1.2. Industrial
- 18.2. Market Analysis, Insights and Forecast - by Tonnage
- 18.2.1. Low
- 18.2.2. Medium
- 18.2.3. High
- 18.3. Market Analysis, Insights and Forecast - by Power Train Type
- 18.3.1. IC Engine
- 18.3.2. Hybrid
- 18.1. Market Analysis, Insights and Forecast - by Application
- 19. Rest of Asia Pacific Reach Stacker Industry Analysis, Insights and Forecast, 2020-2032
- 19.1. Market Analysis, Insights and Forecast - by Application
- 19.1.1. Sea Ports
- 19.1.2. Industrial
- 19.2. Market Analysis, Insights and Forecast - by Tonnage
- 19.2.1. Low
- 19.2.2. Medium
- 19.2.3. High
- 19.3. Market Analysis, Insights and Forecast - by Power Train Type
- 19.3.1. IC Engine
- 19.3.2. Hybrid
- 19.1. Market Analysis, Insights and Forecast - by Application
- 20. Mexico Reach Stacker Industry Analysis, Insights and Forecast, 2020-2032
- 20.1. Market Analysis, Insights and Forecast - by Application
- 20.1.1. Sea Ports
- 20.1.2. Industrial
- 20.2. Market Analysis, Insights and Forecast - by Tonnage
- 20.2.1. Low
- 20.2.2. Medium
- 20.2.3. High
- 20.3. Market Analysis, Insights and Forecast - by Power Train Type
- 20.3.1. IC Engine
- 20.3.2. Hybrid
- 20.1. Market Analysis, Insights and Forecast - by Application
- 21. Brazil Reach Stacker Industry Analysis, Insights and Forecast, 2020-2032
- 21.1. Market Analysis, Insights and Forecast - by Application
- 21.1.1. Sea Ports
- 21.1.2. Industrial
- 21.2. Market Analysis, Insights and Forecast - by Tonnage
- 21.2.1. Low
- 21.2.2. Medium
- 21.2.3. High
- 21.3. Market Analysis, Insights and Forecast - by Power Train Type
- 21.3.1. IC Engine
- 21.3.2. Hybrid
- 21.1. Market Analysis, Insights and Forecast - by Application
- 22. United Arab Emirates Reach Stacker Industry Analysis, Insights and Forecast, 2020-2032
- 22.1. Market Analysis, Insights and Forecast - by Application
- 22.1.1. Sea Ports
- 22.1.2. Industrial
- 22.2. Market Analysis, Insights and Forecast - by Tonnage
- 22.2.1. Low
- 22.2.2. Medium
- 22.2.3. High
- 22.3. Market Analysis, Insights and Forecast - by Power Train Type
- 22.3.1. IC Engine
- 22.3.2. Hybrid
- 22.1. Market Analysis, Insights and Forecast - by Application
- 23. Other Countries Reach Stacker Industry Analysis, Insights and Forecast, 2020-2032
- 23.1. Market Analysis, Insights and Forecast - by Application
- 23.1.1. Sea Ports
- 23.1.2. Industrial
- 23.2. Market Analysis, Insights and Forecast - by Tonnage
- 23.2.1. Low
- 23.2.2. Medium
- 23.2.3. High
- 23.3. Market Analysis, Insights and Forecast - by Power Train Type
- 23.3.1. IC Engine
- 23.3.2. Hybrid
- 23.1. Market Analysis, Insights and Forecast - by Application
- 24. Competitive Analysis
- 24.1. Company Profiles
- 24.1.1 Konecranes
- 24.1.1.1. Company Overview
- 24.1.1.2. Products
- 24.1.1.3. Company Financials
- 24.1.1.4. SWOT Analysis
- 24.1.2 Sany Group
- 24.1.2.1. Company Overview
- 24.1.2.2. Products
- 24.1.2.3. Company Financials
- 24.1.2.4. SWOT Analysis
- 24.1.3 Hyster
- 24.1.3.1. Company Overview
- 24.1.3.2. Products
- 24.1.3.3. Company Financials
- 24.1.3.4. SWOT Analysis
- 24.1.4 SMV Global
- 24.1.4.1. Company Overview
- 24.1.4.2. Products
- 24.1.4.3. Company Financials
- 24.1.4.4. SWOT Analysis
- 24.1.5 Liebherr Group
- 24.1.5.1. Company Overview
- 24.1.5.2. Products
- 24.1.5.3. Company Financials
- 24.1.5.4. SWOT Analysis
- 24.1.6 Toyota*List Not Exhaustive
- 24.1.6.1. Company Overview
- 24.1.6.2. Products
- 24.1.6.3. Company Financials
- 24.1.6.4. SWOT Analysis
- 24.1.7 Kalmar Group
- 24.1.7.1. Company Overview
- 24.1.7.2. Products
- 24.1.7.3. Company Financials
- 24.1.7.4. SWOT Analysis
- 24.1.8 CVS Ferrari S P A
- 24.1.8.1. Company Overview
- 24.1.8.2. Products
- 24.1.8.3. Company Financials
- 24.1.8.4. SWOT Analysis
- 24.1.9 Terex
- 24.1.9.1. Company Overview
- 24.1.9.2. Products
- 24.1.9.3. Company Financials
- 24.1.9.4. SWOT Analysis
- 24.1.1 Konecranes
- 24.2. Market Entropy
- 24.2.1 Company's Key Areas Served
- 24.2.2 Recent Developments
- 24.3. Company Market Share Analysis 2025
- 24.3.1 Top 5 Companies Market Share Analysis
- 24.3.2 Top 3 Companies Market Share Analysis
- 24.4. List of Potential Customers
- 25. Research Methodology
List of Figures
- Figure 1: Global Reach Stacker Industry Revenue Breakdown (billion, %) by Region 2025 & 2033
- Figure 2: United States Reach Stacker Industry Revenue (billion), by Application 2025 & 2033
- Figure 3: United States Reach Stacker Industry Revenue Share (%), by Application 2025 & 2033
- Figure 4: United States Reach Stacker Industry Revenue (billion), by Tonnage 2025 & 2033
- Figure 5: United States Reach Stacker Industry Revenue Share (%), by Tonnage 2025 & 2033
- Figure 6: United States Reach Stacker Industry Revenue (billion), by Power Train Type 2025 & 2033
- Figure 7: United States Reach Stacker Industry Revenue Share (%), by Power Train Type 2025 & 2033
- Figure 8: United States Reach Stacker Industry Revenue (billion), by Country 2025 & 2033
- Figure 9: United States Reach Stacker Industry Revenue Share (%), by Country 2025 & 2033
- Figure 10: Canada Reach Stacker Industry Revenue (billion), by Application 2025 & 2033
- Figure 11: Canada Reach Stacker Industry Revenue Share (%), by Application 2025 & 2033
- Figure 12: Canada Reach Stacker Industry Revenue (billion), by Tonnage 2025 & 2033
- Figure 13: Canada Reach Stacker Industry Revenue Share (%), by Tonnage 2025 & 2033
- Figure 14: Canada Reach Stacker Industry Revenue (billion), by Power Train Type 2025 & 2033
- Figure 15: Canada Reach Stacker Industry Revenue Share (%), by Power Train Type 2025 & 2033
- Figure 16: Canada Reach Stacker Industry Revenue (billion), by Country 2025 & 2033
- Figure 17: Canada Reach Stacker Industry Revenue Share (%), by Country 2025 & 2033
- Figure 18: Rest of North America Reach Stacker Industry Revenue (billion), by Application 2025 & 2033
- Figure 19: Rest of North America Reach Stacker Industry Revenue Share (%), by Application 2025 & 2033
- Figure 20: Rest of North America Reach Stacker Industry Revenue (billion), by Tonnage 2025 & 2033
- Figure 21: Rest of North America Reach Stacker Industry Revenue Share (%), by Tonnage 2025 & 2033
- Figure 22: Rest of North America Reach Stacker Industry Revenue (billion), by Power Train Type 2025 & 2033
- Figure 23: Rest of North America Reach Stacker Industry Revenue Share (%), by Power Train Type 2025 & 2033
- Figure 24: Rest of North America Reach Stacker Industry Revenue (billion), by Country 2025 & 2033
- Figure 25: Rest of North America Reach Stacker Industry Revenue Share (%), by Country 2025 & 2033
- Figure 26: Germany Reach Stacker Industry Revenue (billion), by Application 2025 & 2033
- Figure 27: Germany Reach Stacker Industry Revenue Share (%), by Application 2025 & 2033
- Figure 28: Germany Reach Stacker Industry Revenue (billion), by Tonnage 2025 & 2033
- Figure 29: Germany Reach Stacker Industry Revenue Share (%), by Tonnage 2025 & 2033
- Figure 30: Germany Reach Stacker Industry Revenue (billion), by Power Train Type 2025 & 2033
- Figure 31: Germany Reach Stacker Industry Revenue Share (%), by Power Train Type 2025 & 2033
- Figure 32: Germany Reach Stacker Industry Revenue (billion), by Country 2025 & 2033
- Figure 33: Germany Reach Stacker Industry Revenue Share (%), by Country 2025 & 2033
- Figure 34: United Kingdom Reach Stacker Industry Revenue (billion), by Application 2025 & 2033
- Figure 35: United Kingdom Reach Stacker Industry Revenue Share (%), by Application 2025 & 2033
- Figure 36: United Kingdom Reach Stacker Industry Revenue (billion), by Tonnage 2025 & 2033
- Figure 37: United Kingdom Reach Stacker Industry Revenue Share (%), by Tonnage 2025 & 2033
- Figure 38: United Kingdom Reach Stacker Industry Revenue (billion), by Power Train Type 2025 & 2033
- Figure 39: United Kingdom Reach Stacker Industry Revenue Share (%), by Power Train Type 2025 & 2033
- Figure 40: United Kingdom Reach Stacker Industry Revenue (billion), by Country 2025 & 2033
- Figure 41: United Kingdom Reach Stacker Industry Revenue Share (%), by Country 2025 & 2033
- Figure 42: France Reach Stacker Industry Revenue (billion), by Application 2025 & 2033
- Figure 43: France Reach Stacker Industry Revenue Share (%), by Application 2025 & 2033
- Figure 44: France Reach Stacker Industry Revenue (billion), by Tonnage 2025 & 2033
- Figure 45: France Reach Stacker Industry Revenue Share (%), by Tonnage 2025 & 2033
- Figure 46: France Reach Stacker Industry Revenue (billion), by Power Train Type 2025 & 2033
- Figure 47: France Reach Stacker Industry Revenue Share (%), by Power Train Type 2025 & 2033
- Figure 48: France Reach Stacker Industry Revenue (billion), by Country 2025 & 2033
- Figure 49: France Reach Stacker Industry Revenue Share (%), by Country 2025 & 2033
- Figure 50: Italy Reach Stacker Industry Revenue (billion), by Application 2025 & 2033
- Figure 51: Italy Reach Stacker Industry Revenue Share (%), by Application 2025 & 2033
- Figure 52: Italy Reach Stacker Industry Revenue (billion), by Tonnage 2025 & 2033
- Figure 53: Italy Reach Stacker Industry Revenue Share (%), by Tonnage 2025 & 2033
- Figure 54: Italy Reach Stacker Industry Revenue (billion), by Power Train Type 2025 & 2033
- Figure 55: Italy Reach Stacker Industry Revenue Share (%), by Power Train Type 2025 & 2033
- Figure 56: Italy Reach Stacker Industry Revenue (billion), by Country 2025 & 2033
- Figure 57: Italy Reach Stacker Industry Revenue Share (%), by Country 2025 & 2033
- Figure 58: Rest of Europe Reach Stacker Industry Revenue (billion), by Application 2025 & 2033
- Figure 59: Rest of Europe Reach Stacker Industry Revenue Share (%), by Application 2025 & 2033
- Figure 60: Rest of Europe Reach Stacker Industry Revenue (billion), by Tonnage 2025 & 2033
- Figure 61: Rest of Europe Reach Stacker Industry Revenue Share (%), by Tonnage 2025 & 2033
- Figure 62: Rest of Europe Reach Stacker Industry Revenue (billion), by Power Train Type 2025 & 2033
- Figure 63: Rest of Europe Reach Stacker Industry Revenue Share (%), by Power Train Type 2025 & 2033
- Figure 64: Rest of Europe Reach Stacker Industry Revenue (billion), by Country 2025 & 2033
- Figure 65: Rest of Europe Reach Stacker Industry Revenue Share (%), by Country 2025 & 2033
- Figure 66: China Reach Stacker Industry Revenue (billion), by Application 2025 & 2033
- Figure 67: China Reach Stacker Industry Revenue Share (%), by Application 2025 & 2033
- Figure 68: China Reach Stacker Industry Revenue (billion), by Tonnage 2025 & 2033
- Figure 69: China Reach Stacker Industry Revenue Share (%), by Tonnage 2025 & 2033
- Figure 70: China Reach Stacker Industry Revenue (billion), by Power Train Type 2025 & 2033
- Figure 71: China Reach Stacker Industry Revenue Share (%), by Power Train Type 2025 & 2033
- Figure 72: China Reach Stacker Industry Revenue (billion), by Country 2025 & 2033
- Figure 73: China Reach Stacker Industry Revenue Share (%), by Country 2025 & 2033
- Figure 74: India Reach Stacker Industry Revenue (billion), by Application 2025 & 2033
- Figure 75: India Reach Stacker Industry Revenue Share (%), by Application 2025 & 2033
- Figure 76: India Reach Stacker Industry Revenue (billion), by Tonnage 2025 & 2033
- Figure 77: India Reach Stacker Industry Revenue Share (%), by Tonnage 2025 & 2033
- Figure 78: India Reach Stacker Industry Revenue (billion), by Power Train Type 2025 & 2033
- Figure 79: India Reach Stacker Industry Revenue Share (%), by Power Train Type 2025 & 2033
- Figure 80: India Reach Stacker Industry Revenue (billion), by Country 2025 & 2033
- Figure 81: India Reach Stacker Industry Revenue Share (%), by Country 2025 & 2033
- Figure 82: Japan Reach Stacker Industry Revenue (billion), by Application 2025 & 2033
- Figure 83: Japan Reach Stacker Industry Revenue Share (%), by Application 2025 & 2033
- Figure 84: Japan Reach Stacker Industry Revenue (billion), by Tonnage 2025 & 2033
- Figure 85: Japan Reach Stacker Industry Revenue Share (%), by Tonnage 2025 & 2033
- Figure 86: Japan Reach Stacker Industry Revenue (billion), by Power Train Type 2025 & 2033
- Figure 87: Japan Reach Stacker Industry Revenue Share (%), by Power Train Type 2025 & 2033
- Figure 88: Japan Reach Stacker Industry Revenue (billion), by Country 2025 & 2033
- Figure 89: Japan Reach Stacker Industry Revenue Share (%), by Country 2025 & 2033
- Figure 90: South Korea Reach Stacker Industry Revenue (billion), by Application 2025 & 2033
- Figure 91: South Korea Reach Stacker Industry Revenue Share (%), by Application 2025 & 2033
- Figure 92: South Korea Reach Stacker Industry Revenue (billion), by Tonnage 2025 & 2033
- Figure 93: South Korea Reach Stacker Industry Revenue Share (%), by Tonnage 2025 & 2033
- Figure 94: South Korea Reach Stacker Industry Revenue (billion), by Power Train Type 2025 & 2033
- Figure 95: South Korea Reach Stacker Industry Revenue Share (%), by Power Train Type 2025 & 2033
- Figure 96: South Korea Reach Stacker Industry Revenue (billion), by Country 2025 & 2033
- Figure 97: South Korea Reach Stacker Industry Revenue Share (%), by Country 2025 & 2033
- Figure 98: Rest of Asia Pacific Reach Stacker Industry Revenue (billion), by Application 2025 & 2033
- Figure 99: Rest of Asia Pacific Reach Stacker Industry Revenue Share (%), by Application 2025 & 2033
- Figure 100: Rest of Asia Pacific Reach Stacker Industry Revenue (billion), by Tonnage 2025 & 2033
- Figure 101: Rest of Asia Pacific Reach Stacker Industry Revenue Share (%), by Tonnage 2025 & 2033
- Figure 102: Rest of Asia Pacific Reach Stacker Industry Revenue (billion), by Power Train Type 2025 & 2033
- Figure 103: Rest of Asia Pacific Reach Stacker Industry Revenue Share (%), by Power Train Type 2025 & 2033
- Figure 104: Rest of Asia Pacific Reach Stacker Industry Revenue (billion), by Country 2025 & 2033
- Figure 105: Rest of Asia Pacific Reach Stacker Industry Revenue Share (%), by Country 2025 & 2033
- Figure 106: Mexico Reach Stacker Industry Revenue (billion), by Application 2025 & 2033
- Figure 107: Mexico Reach Stacker Industry Revenue Share (%), by Application 2025 & 2033
- Figure 108: Mexico Reach Stacker Industry Revenue (billion), by Tonnage 2025 & 2033
- Figure 109: Mexico Reach Stacker Industry Revenue Share (%), by Tonnage 2025 & 2033
- Figure 110: Mexico Reach Stacker Industry Revenue (billion), by Power Train Type 2025 & 2033
- Figure 111: Mexico Reach Stacker Industry Revenue Share (%), by Power Train Type 2025 & 2033
- Figure 112: Mexico Reach Stacker Industry Revenue (billion), by Country 2025 & 2033
- Figure 113: Mexico Reach Stacker Industry Revenue Share (%), by Country 2025 & 2033
- Figure 114: Brazil Reach Stacker Industry Revenue (billion), by Application 2025 & 2033
- Figure 115: Brazil Reach Stacker Industry Revenue Share (%), by Application 2025 & 2033
- Figure 116: Brazil Reach Stacker Industry Revenue (billion), by Tonnage 2025 & 2033
- Figure 117: Brazil Reach Stacker Industry Revenue Share (%), by Tonnage 2025 & 2033
- Figure 118: Brazil Reach Stacker Industry Revenue (billion), by Power Train Type 2025 & 2033
- Figure 119: Brazil Reach Stacker Industry Revenue Share (%), by Power Train Type 2025 & 2033
- Figure 120: Brazil Reach Stacker Industry Revenue (billion), by Country 2025 & 2033
- Figure 121: Brazil Reach Stacker Industry Revenue Share (%), by Country 2025 & 2033
- Figure 122: United Arab Emirates Reach Stacker Industry Revenue (billion), by Application 2025 & 2033
- Figure 123: United Arab Emirates Reach Stacker Industry Revenue Share (%), by Application 2025 & 2033
- Figure 124: United Arab Emirates Reach Stacker Industry Revenue (billion), by Tonnage 2025 & 2033
- Figure 125: United Arab Emirates Reach Stacker Industry Revenue Share (%), by Tonnage 2025 & 2033
- Figure 126: United Arab Emirates Reach Stacker Industry Revenue (billion), by Power Train Type 2025 & 2033
- Figure 127: United Arab Emirates Reach Stacker Industry Revenue Share (%), by Power Train Type 2025 & 2033
- Figure 128: United Arab Emirates Reach Stacker Industry Revenue (billion), by Country 2025 & 2033
- Figure 129: United Arab Emirates Reach Stacker Industry Revenue Share (%), by Country 2025 & 2033
- Figure 130: Other Countries Reach Stacker Industry Revenue (billion), by Application 2025 & 2033
- Figure 131: Other Countries Reach Stacker Industry Revenue Share (%), by Application 2025 & 2033
- Figure 132: Other Countries Reach Stacker Industry Revenue (billion), by Tonnage 2025 & 2033
- Figure 133: Other Countries Reach Stacker Industry Revenue Share (%), by Tonnage 2025 & 2033
- Figure 134: Other Countries Reach Stacker Industry Revenue (billion), by Power Train Type 2025 & 2033
- Figure 135: Other Countries Reach Stacker Industry Revenue Share (%), by Power Train Type 2025 & 2033
- Figure 136: Other Countries Reach Stacker Industry Revenue (billion), by Country 2025 & 2033
- Figure 137: Other Countries Reach Stacker Industry Revenue Share (%), by Country 2025 & 2033
List of Tables
- Table 1: Global Reach Stacker Industry Revenue billion Forecast, by Application 2020 & 2033
- Table 2: Global Reach Stacker Industry Revenue billion Forecast, by Tonnage 2020 & 2033
- Table 3: Global Reach Stacker Industry Revenue billion Forecast, by Power Train Type 2020 & 2033
- Table 4: Global Reach Stacker Industry Revenue billion Forecast, by Region 2020 & 2033
- Table 5: Global Reach Stacker Industry Revenue billion Forecast, by Application 2020 & 2033
- Table 6: Global Reach Stacker Industry Revenue billion Forecast, by Tonnage 2020 & 2033
- Table 7: Global Reach Stacker Industry Revenue billion Forecast, by Power Train Type 2020 & 2033
- Table 8: Global Reach Stacker Industry Revenue billion Forecast, by Country 2020 & 2033
- Table 9: Global Reach Stacker Industry Revenue billion Forecast, by Application 2020 & 2033
- Table 10: Global Reach Stacker Industry Revenue billion Forecast, by Tonnage 2020 & 2033
- Table 11: Global Reach Stacker Industry Revenue billion Forecast, by Power Train Type 2020 & 2033
- Table 12: Global Reach Stacker Industry Revenue billion Forecast, by Country 2020 & 2033
- Table 13: Global Reach Stacker Industry Revenue billion Forecast, by Application 2020 & 2033
- Table 14: Global Reach Stacker Industry Revenue billion Forecast, by Tonnage 2020 & 2033
- Table 15: Global Reach Stacker Industry Revenue billion Forecast, by Power Train Type 2020 & 2033
- Table 16: Global Reach Stacker Industry Revenue billion Forecast, by Country 2020 & 2033
- Table 17: Global Reach Stacker Industry Revenue billion Forecast, by Application 2020 & 2033
- Table 18: Global Reach Stacker Industry Revenue billion Forecast, by Tonnage 2020 & 2033
- Table 19: Global Reach Stacker Industry Revenue billion Forecast, by Power Train Type 2020 & 2033
- Table 20: Global Reach Stacker Industry Revenue billion Forecast, by Country 2020 & 2033
- Table 21: Global Reach Stacker Industry Revenue billion Forecast, by Application 2020 & 2033
- Table 22: Global Reach Stacker Industry Revenue billion Forecast, by Tonnage 2020 & 2033
- Table 23: Global Reach Stacker Industry Revenue billion Forecast, by Power Train Type 2020 & 2033
- Table 24: Global Reach Stacker Industry Revenue billion Forecast, by Country 2020 & 2033
- Table 25: Global Reach Stacker Industry Revenue billion Forecast, by Application 2020 & 2033
- Table 26: Global Reach Stacker Industry Revenue billion Forecast, by Tonnage 2020 & 2033
- Table 27: Global Reach Stacker Industry Revenue billion Forecast, by Power Train Type 2020 & 2033
- Table 28: Global Reach Stacker Industry Revenue billion Forecast, by Country 2020 & 2033
- Table 29: Global Reach Stacker Industry Revenue billion Forecast, by Application 2020 & 2033
- Table 30: Global Reach Stacker Industry Revenue billion Forecast, by Tonnage 2020 & 2033
- Table 31: Global Reach Stacker Industry Revenue billion Forecast, by Power Train Type 2020 & 2033
- Table 32: Global Reach Stacker Industry Revenue billion Forecast, by Country 2020 & 2033
- Table 33: Global Reach Stacker Industry Revenue billion Forecast, by Application 2020 & 2033
- Table 34: Global Reach Stacker Industry Revenue billion Forecast, by Tonnage 2020 & 2033
- Table 35: Global Reach Stacker Industry Revenue billion Forecast, by Power Train Type 2020 & 2033
- Table 36: Global Reach Stacker Industry Revenue billion Forecast, by Country 2020 & 2033
- Table 37: Global Reach Stacker Industry Revenue billion Forecast, by Application 2020 & 2033
- Table 38: Global Reach Stacker Industry Revenue billion Forecast, by Tonnage 2020 & 2033
- Table 39: Global Reach Stacker Industry Revenue billion Forecast, by Power Train Type 2020 & 2033
- Table 40: Global Reach Stacker Industry Revenue billion Forecast, by Country 2020 & 2033
- Table 41: Global Reach Stacker Industry Revenue billion Forecast, by Application 2020 & 2033
- Table 42: Global Reach Stacker Industry Revenue billion Forecast, by Tonnage 2020 & 2033
- Table 43: Global Reach Stacker Industry Revenue billion Forecast, by Power Train Type 2020 & 2033
- Table 44: Global Reach Stacker Industry Revenue billion Forecast, by Country 2020 & 2033
- Table 45: Global Reach Stacker Industry Revenue billion Forecast, by Application 2020 & 2033
- Table 46: Global Reach Stacker Industry Revenue billion Forecast, by Tonnage 2020 & 2033
- Table 47: Global Reach Stacker Industry Revenue billion Forecast, by Power Train Type 2020 & 2033
- Table 48: Global Reach Stacker Industry Revenue billion Forecast, by Country 2020 & 2033
- Table 49: Global Reach Stacker Industry Revenue billion Forecast, by Application 2020 & 2033
- Table 50: Global Reach Stacker Industry Revenue billion Forecast, by Tonnage 2020 & 2033
- Table 51: Global Reach Stacker Industry Revenue billion Forecast, by Power Train Type 2020 & 2033
- Table 52: Global Reach Stacker Industry Revenue billion Forecast, by Country 2020 & 2033
- Table 53: Global Reach Stacker Industry Revenue billion Forecast, by Application 2020 & 2033
- Table 54: Global Reach Stacker Industry Revenue billion Forecast, by Tonnage 2020 & 2033
- Table 55: Global Reach Stacker Industry Revenue billion Forecast, by Power Train Type 2020 & 2033
- Table 56: Global Reach Stacker Industry Revenue billion Forecast, by Country 2020 & 2033
- Table 57: Global Reach Stacker Industry Revenue billion Forecast, by Application 2020 & 2033
- Table 58: Global Reach Stacker Industry Revenue billion Forecast, by Tonnage 2020 & 2033
- Table 59: Global Reach Stacker Industry Revenue billion Forecast, by Power Train Type 2020 & 2033
- Table 60: Global Reach Stacker Industry Revenue billion Forecast, by Country 2020 & 2033
- Table 61: Global Reach Stacker Industry Revenue billion Forecast, by Application 2020 & 2033
- Table 62: Global Reach Stacker Industry Revenue billion Forecast, by Tonnage 2020 & 2033
- Table 63: Global Reach Stacker Industry Revenue billion Forecast, by Power Train Type 2020 & 2033
- Table 64: Global Reach Stacker Industry Revenue billion Forecast, by Country 2020 & 2033
- Table 65: Global Reach Stacker Industry Revenue billion Forecast, by Application 2020 & 2033
- Table 66: Global Reach Stacker Industry Revenue billion Forecast, by Tonnage 2020 & 2033
- Table 67: Global Reach Stacker Industry Revenue billion Forecast, by Power Train Type 2020 & 2033
- Table 68: Global Reach Stacker Industry Revenue billion Forecast, by Country 2020 & 2033
- Table 69: Global Reach Stacker Industry Revenue billion Forecast, by Application 2020 & 2033
- Table 70: Global Reach Stacker Industry Revenue billion Forecast, by Tonnage 2020 & 2033
- Table 71: Global Reach Stacker Industry Revenue billion Forecast, by Power Train Type 2020 & 2033
- Table 72: Global Reach Stacker Industry Revenue billion Forecast, by Country 2020 & 2033
Frequently Asked Questions
1. What is the projected Compound Annual Growth Rate (CAGR) of the Reach Stacker Industry?
The projected CAGR is approximately 6.9%.
2. Which companies are prominent players in the Reach Stacker Industry?
Key companies in the market include Konecranes, Sany Group, Hyster, SMV Global, Liebherr Group, Toyota*List Not Exhaustive, Kalmar Group, CVS Ferrari S P A, Terex.
3. What are the main segments of the Reach Stacker Industry?
The market segments include Application, Tonnage, Power Train Type.
4. Can you provide details about the market size?
The market size is estimated to be USD 3.2 billion as of 2022.
5. What are some drivers contributing to market growth?
Diverse Selection Among Car Models is Anticipated to Drive the Market Growth.
6. What are the notable trends driving market growth?
Electric Reach Stacker to Gain Momentum.
7. Are there any restraints impacting market growth?
Counterfeit and Illegally Imported Vehicles are Restraining the Market Growth.
8. Can you provide examples of recent developments in the market?
N/A
9. What pricing options are available for accessing the report?
Pricing options include single-user, multi-user, and enterprise licenses priced at USD 4750, USD 5250, and USD 8750 respectively.
10. Is the market size provided in terms of value or volume?
The market size is provided in terms of value, measured in billion.
11. Are there any specific market keywords associated with the report?
Yes, the market keyword associated with the report is "Reach Stacker Industry," which aids in identifying and referencing the specific market segment covered.
12. How do I determine which pricing option suits my needs best?
The pricing options vary based on user requirements and access needs. Individual users may opt for single-user licenses, while businesses requiring broader access may choose multi-user or enterprise licenses for cost-effective access to the report.
13. Are there any additional resources or data provided in the Reach Stacker Industry report?
While the report offers comprehensive insights, it's advisable to review the specific contents or supplementary materials provided to ascertain if additional resources or data are available.
14. How can I stay updated on further developments or reports in the Reach Stacker Industry?
To stay informed about further developments, trends, and reports in the Reach Stacker Industry, consider subscribing to industry newsletters, following relevant companies and organizations, or regularly checking reputable industry news sources and publications.
Methodology
Step 1 - Identification of Relevant Samples Size from Population Database


Step 2 - Approaches for Defining Global Market Size (Value, Volume* & Price*)

Note*: In applicable scenarios
Step 3 - Data Sources
Primary Research
- Web Analytics
- Survey Reports
- Research Institute
- Latest Research Reports
- Opinion Leaders
Secondary Research
- Annual Reports
- White Paper
- Latest Press Release
- Industry Association
- Paid Database
- Investor Presentations

Step 4 - Data Triangulation
Involves using different sources of information in order to increase the validity of a study
These sources are likely to be stakeholders in a program - participants, other researchers, program staff, other community members, and so on.
Then we put all data in single framework & apply various statistical tools to find out the dynamic on the market.
During the analysis stage, feedback from the stakeholder groups would be compared to determine areas of agreement as well as areas of divergence