

Key Insights
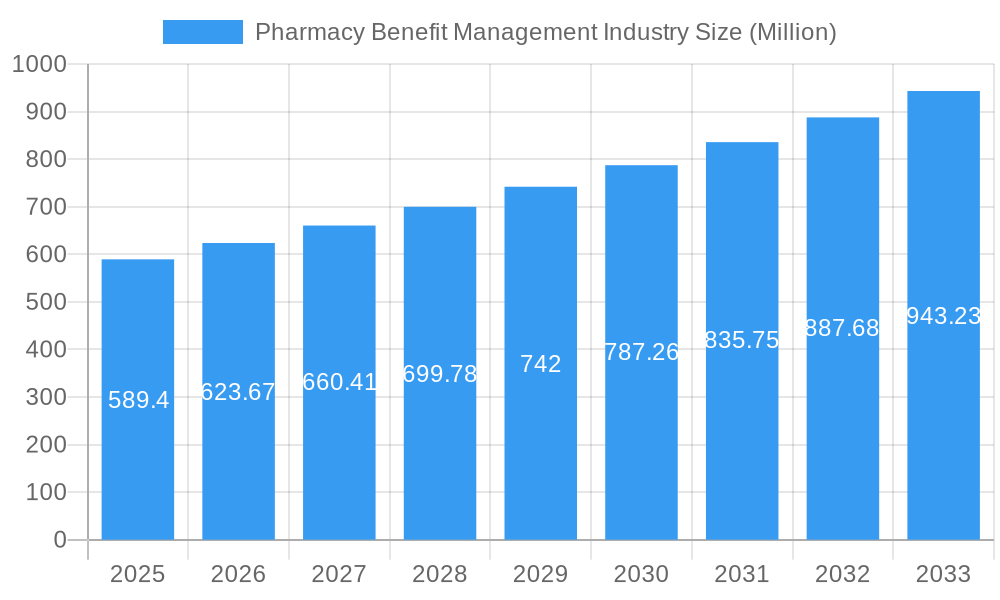
The Pharmacy Benefit Management (PBM) industry, valued at $589.40 million in 2025, is projected to experience robust growth, driven by several key factors. The increasing prevalence of chronic diseases, coupled with the aging global population, necessitates greater reliance on prescription medications, fueling demand for PBM services. Technological advancements, such as the rise of telehealth and data analytics, are streamlining processes, improving efficiency, and enabling personalized medication management. Furthermore, government initiatives promoting cost-effective healthcare solutions and regulations aimed at increasing medication adherence are contributing to market expansion. The shift towards value-based care models, focusing on improved patient outcomes and cost containment, also presents significant opportunities for PBMs. Competition is intense, with established players like CVS Health and Express Scripts alongside emerging innovative companies. However, challenges remain including increasing drug costs, stringent regulations, and the need for robust data security measures.
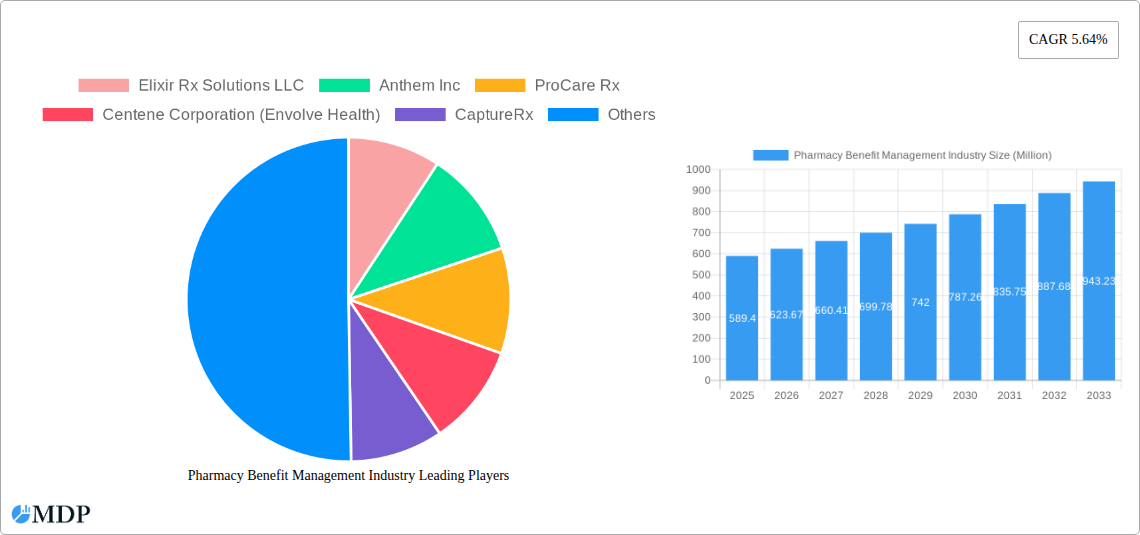
Pharmacy Benefit Management Industry Market Size (In Million)
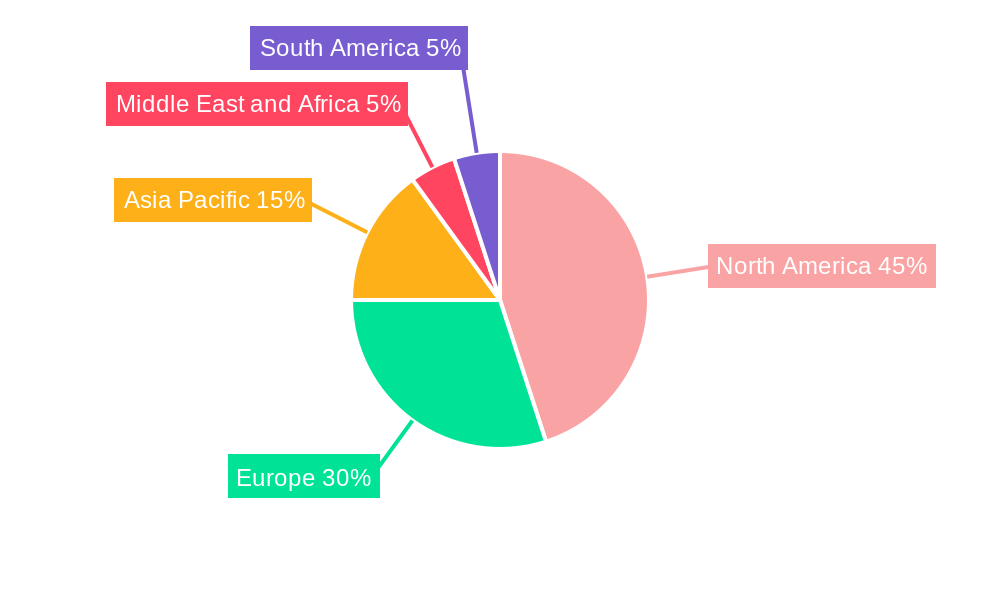
The industry's segmentation reflects diverse service offerings and business models. Specialty pharmacy services are witnessing rapid growth due to the increasing use of expensive biologics and specialty drugs. Employer-sponsored programs and government health programs remain dominant market segments, though the rise of private health insurance management presents a substantial growth avenue. Geographically, North America is currently the largest market, however, significant potential for growth exists in rapidly developing economies in Asia Pacific and other regions due to rising healthcare spending and increased adoption of PBMs. The forecast period (2025-2033) suggests a continuation of this upward trajectory, with a compound annual growth rate (CAGR) of 5.64%, indicating substantial investment opportunities and considerable industry expansion.
Pharmacy Benefit Management Industry Company Market Share
Pharmacy Benefit Management (PBM) Industry Report: 2019-2033
This comprehensive report provides a detailed analysis of the Pharmacy Benefit Management (PBM) industry, offering actionable insights for stakeholders across the value chain. With a study period spanning 2019-2033, a base year of 2025, and a forecast period of 2025-2033, this report leverages historical data (2019-2024) and projected growth to paint a clear picture of this dynamic market. The market is estimated to be worth xx Million in 2025.
Pharmacy Benefit Management Industry Market Dynamics & Concentration
The PBM industry is characterized by a moderate level of concentration, with a few dominant players controlling a significant market share. In 2025, the top 5 companies are estimated to hold approximately 60% of the market share, while the remaining share is distributed among numerous smaller players. Innovation is driven by advancements in technology, particularly in areas such as data analytics and telehealth. Stringent regulatory frameworks, including those related to drug pricing and patient privacy, significantly impact industry operations. The rise of generic drugs and biosimilars acts as a substitute, influencing pricing strategies and market dynamics. End-user trends indicate increasing demand for value-based care models and personalized medication management. M&A activity remains prevalent, with an estimated xx M&A deals occurring in the historical period (2019-2024), reflecting consolidation efforts and strategic expansion within the industry.
- Market Concentration: Top 5 players hold approximately 60% market share (2025 est.)
- Innovation Drivers: Data analytics, telehealth, AI-powered drug discovery.
- Regulatory Framework: Stringent regulations on drug pricing and patient data.
- Product Substitutes: Generic drugs and biosimilars.
- End-User Trends: Demand for value-based care and personalized medicine.
- M&A Activity: xx M&A deals (2019-2024), indicating ongoing consolidation.
Pharmacy Benefit Management Industry Industry Trends & Analysis
The PBM industry is experiencing robust growth, driven by factors such as the aging population, rising prevalence of chronic diseases, and increasing healthcare expenditure. The Compound Annual Growth Rate (CAGR) from 2025 to 2033 is projected to be xx%. Technological disruptions, such as the adoption of blockchain technology for secure data management and AI-powered clinical decision support systems, are transforming industry operations. Consumer preferences are shifting towards greater transparency and control over healthcare costs, influencing demand for personalized medication plans and digital health solutions. The competitive landscape is characterized by intense rivalry among established players and the emergence of new entrants offering innovative services. Market penetration of advanced PBM technologies is projected to reach xx% by 2033.
Leading Markets & Segments in Pharmacy Benefit Management Industry
The United States currently represents the largest market for PBM services globally. However, significant growth potential exists in other developed and emerging markets.
By Service:
- Specialty Pharmacy: High growth due to the increasing prevalence of complex and costly specialty medications. Key driver: Increased demand for specialized medications.
- Drug Formulatory Management: Steady growth driven by the need to optimize formularies for cost-effectiveness. Key driver: Focus on reducing healthcare spending.
- Benefit Plan Design and Consultation: Growth driven by rising demand for customized benefit plans. Key driver: Personalized healthcare plans.
- Other Services: Growth attributed to emerging areas like medication adherence programs. Key driver: Improving medication compliance and patient outcomes.
By Business Model:
- Government Health Programs: Significant market share due to extensive government healthcare initiatives. Key driver: Public healthcare coverage expansion.
- Employer-Sponsored Programs: Robust market due to widespread employer-sponsored health insurance. Key driver: Employer provision of healthcare benefits.
- Health Insurance Management: Growth is tied to the increasing number of insured individuals. Key driver: Increase in health insurance coverage.
By End-User:
- Pharmacy Benefit Management Organization (PBMO): Dominant segment as PBMOs are central to PBM operations. Key driver: Core PBM operational management.
- Mail Order Pharmacies: Significant segment with growth driven by convenience and cost savings. Key driver: Cost efficiency and patient convenience.
- Retail Pharmacies: Large segment integrated into the PBM ecosystem. Key driver: Patient accessibility to medications.
- Other End-Users: This segment is growing with innovative services for niche populations.
Pharmacy Benefit Management Industry Product Developments
Recent product innovations in the PBM industry focus on advanced analytics, AI-driven clinical decision support, and integrated telehealth solutions. These innovations aim to improve medication adherence, reduce healthcare costs, and personalize patient care. The market fit for these products is strong, as payers and providers seek cost-effective solutions to manage the rising cost of healthcare.
Key Drivers of Pharmacy Benefit Management Industry Growth
The PBM industry's growth is driven by several factors, including:
- Technological advancements: AI, data analytics, and telehealth solutions enhance efficiency and personalize care.
- Economic factors: Rising healthcare costs and increasing prevalence of chronic diseases fuel demand for cost-effective PBM solutions.
- Regulatory changes: Government initiatives promoting value-based care and medication adherence incentivize PBM innovation.
Challenges in the Pharmacy Benefit Management Industry Market
The PBM industry faces several challenges, including:
- Regulatory hurdles: Complex and evolving regulations impact operational efficiency and cost management.
- Supply chain disruptions: Fluctuations in drug prices and supply shortages can affect profitability.
- Competitive pressures: Intense competition among established and emerging players creates price pressures and impacts market share. Estimated annual impact on industry profitability: xx Million.
Emerging Opportunities in Pharmacy Benefit Management Industry
Significant opportunities exist for growth within the PBM industry. Technological breakthroughs in personalized medicine and AI-driven drug discovery will further propel market expansion. Strategic partnerships between PBMs, health systems, and technology providers will enhance service delivery. The expansion into emerging markets with growing healthcare needs presents substantial opportunities.
Leading Players in the Pharmacy Benefit Management Industry Sector
Key Milestones in Pharmacy Benefit Management Industry Industry
- October 2022: Omnicell, Inc. launched Specialty Pharmacy Services, expanding its offerings in the specialty pharmacy segment. This broadened its market reach and intensified competition.
- March 2022: ProdigyRx launched its business operations, offering PBM services and clinical solutions to a new customer base (workers' compensation insurers, etc.). This increased the competition and expanded service offerings within the industry.
Strategic Outlook for Pharmacy Benefit Management Industry Market
The PBM industry is poised for continued growth, driven by technological innovation, evolving healthcare models, and expanding market access. Strategic opportunities lie in leveraging data analytics for personalized medication management, developing innovative telehealth solutions, and expanding into underserved markets. Strategic partnerships and acquisitions will play a crucial role in shaping the future competitive landscape.
Pharmacy Benefit Management Industry Segmentation
-
1. Service
- 1.1. Specialty Pharmacy
- 1.2. Drug Formulatory Management
- 1.3. Benefit Plan Design and Consultation
- 1.4. Other Services
-
2. Business Model
- 2.1. Government Health Programs
- 2.2. Employer-Sponsored Programs
- 2.3. Health Insurance Management
-
3. End User
- 3.1. Pharmacy Benefit Management Organization
- 3.2. Mail Order Pharmacies
- 3.3. Retail Pharmacies
- 3.4. Other End Users
Pharmacy Benefit Management Industry Segmentation By Geography
-
1. North America
- 1.1. United States
- 1.2. Canada
- 1.3. Mexico
-
2. Europe
- 2.1. Germany
- 2.2. United Kingdom
- 2.3. France
- 2.4. Italy
- 2.5. Spain
- 2.6. Rest of Europe
-
3. Asia Pacific
- 3.1. China
- 3.2. Japan
- 3.3. India
- 3.4. Australia
- 3.5. South Korea
- 3.6. Rest of Asia Pacific
-
4. Middle East and Africa
- 4.1. GCC
- 4.2. South Africa
- 4.3. Rest of Middle East and Africa
-
5. South America
- 5.1. Brazil
- 5.2. Argentina
- 5.3. Rest of South America
Pharmacy Benefit Management Industry Regional Market Share
Geographic Coverage of Pharmacy Benefit Management Industry
Pharmacy Benefit Management Industry REPORT HIGHLIGHTS
| Aspects | Details |
|---|---|
| Study Period | 2020-2034 |
| Base Year | 2025 |
| Estimated Year | 2026 |
| Forecast Period | 2026-2034 |
| Historical Period | 2020-2025 |
| Growth Rate | CAGR of 5.64% from 2020-2034 |
| Segmentation |
|
Table of Contents
- 1. Introduction
- 1.1. Research Scope
- 1.2. Market Segmentation
- 1.3. Research Objective
- 1.4. Definitions and Assumptions
- 2. Executive Summary
- 2.1. Market Snapshot
- 3. Market Dynamics
- 3.1. Market Drivers
- 3.2. Market Restrains
- 3.3. Market Trends
- 3.4. Market Opportunities
- 4. Market Factor Analysis
- 4.1. Porters Five Forces
- 4.1.1. Bargaining Power of Suppliers
- 4.1.2. Bargaining Power of Buyers
- 4.1.3. Threat of New Entrants
- 4.1.4. Threat of Substitutes
- 4.1.5. Competitive Rivalry
- 4.2. PESTEL analysis
- 4.3. BCG Analysis
- 4.3.1. Stars (High Growth, High Market Share)
- 4.3.2. Cash Cows (Low Growth, High Market Share)
- 4.3.3. Question Mark (High Growth, Low Market Share)
- 4.3.4. Dogs (Low Growth, Low Market Share)
- 4.4. Ansoff Matrix Analysis
- 4.5. Supply Chain Analysis
- 4.6. Regulatory Landscape
- 4.7. Current Market Potential and Opportunity Assessment (TAM–SAM–SOM Framework)
- 4.8. MDP Analyst Note
- 4.1. Porters Five Forces
- 5. Market Analysis, Insights and Forecast 2021-2033
- 5.1. Market Analysis, Insights and Forecast - by Service
- 5.1.1. Specialty Pharmacy
- 5.1.2. Drug Formulatory Management
- 5.1.3. Benefit Plan Design and Consultation
- 5.1.4. Other Services
- 5.2. Market Analysis, Insights and Forecast - by Business Model
- 5.2.1. Government Health Programs
- 5.2.2. Employer-Sponsored Programs
- 5.2.3. Health Insurance Management
- 5.3. Market Analysis, Insights and Forecast - by End User
- 5.3.1. Pharmacy Benefit Management Organization
- 5.3.2. Mail Order Pharmacies
- 5.3.3. Retail Pharmacies
- 5.3.4. Other End Users
- 5.4. Market Analysis, Insights and Forecast - by Region
- 5.4.1. North America
- 5.4.2. Europe
- 5.4.3. Asia Pacific
- 5.4.4. Middle East and Africa
- 5.4.5. South America
- 5.1. Market Analysis, Insights and Forecast - by Service
- 6. Global Pharmacy Benefit Management Industry Analysis, Insights and Forecast, 2021-2033
- 6.1. Market Analysis, Insights and Forecast - by Service
- 6.1.1. Specialty Pharmacy
- 6.1.2. Drug Formulatory Management
- 6.1.3. Benefit Plan Design and Consultation
- 6.1.4. Other Services
- 6.2. Market Analysis, Insights and Forecast - by Business Model
- 6.2.1. Government Health Programs
- 6.2.2. Employer-Sponsored Programs
- 6.2.3. Health Insurance Management
- 6.3. Market Analysis, Insights and Forecast - by End User
- 6.3.1. Pharmacy Benefit Management Organization
- 6.3.2. Mail Order Pharmacies
- 6.3.3. Retail Pharmacies
- 6.3.4. Other End Users
- 6.1. Market Analysis, Insights and Forecast - by Service
- 7. North America Pharmacy Benefit Management Industry Analysis, Insights and Forecast, 2020-2032
- 7.1. Market Analysis, Insights and Forecast - by Service
- 7.1.1. Specialty Pharmacy
- 7.1.2. Drug Formulatory Management
- 7.1.3. Benefit Plan Design and Consultation
- 7.1.4. Other Services
- 7.2. Market Analysis, Insights and Forecast - by Business Model
- 7.2.1. Government Health Programs
- 7.2.2. Employer-Sponsored Programs
- 7.2.3. Health Insurance Management
- 7.3. Market Analysis, Insights and Forecast - by End User
- 7.3.1. Pharmacy Benefit Management Organization
- 7.3.2. Mail Order Pharmacies
- 7.3.3. Retail Pharmacies
- 7.3.4. Other End Users
- 7.1. Market Analysis, Insights and Forecast - by Service
- 8. Europe Pharmacy Benefit Management Industry Analysis, Insights and Forecast, 2020-2032
- 8.1. Market Analysis, Insights and Forecast - by Service
- 8.1.1. Specialty Pharmacy
- 8.1.2. Drug Formulatory Management
- 8.1.3. Benefit Plan Design and Consultation
- 8.1.4. Other Services
- 8.2. Market Analysis, Insights and Forecast - by Business Model
- 8.2.1. Government Health Programs
- 8.2.2. Employer-Sponsored Programs
- 8.2.3. Health Insurance Management
- 8.3. Market Analysis, Insights and Forecast - by End User
- 8.3.1. Pharmacy Benefit Management Organization
- 8.3.2. Mail Order Pharmacies
- 8.3.3. Retail Pharmacies
- 8.3.4. Other End Users
- 8.1. Market Analysis, Insights and Forecast - by Service
- 9. Asia Pacific Pharmacy Benefit Management Industry Analysis, Insights and Forecast, 2020-2032
- 9.1. Market Analysis, Insights and Forecast - by Service
- 9.1.1. Specialty Pharmacy
- 9.1.2. Drug Formulatory Management
- 9.1.3. Benefit Plan Design and Consultation
- 9.1.4. Other Services
- 9.2. Market Analysis, Insights and Forecast - by Business Model
- 9.2.1. Government Health Programs
- 9.2.2. Employer-Sponsored Programs
- 9.2.3. Health Insurance Management
- 9.3. Market Analysis, Insights and Forecast - by End User
- 9.3.1. Pharmacy Benefit Management Organization
- 9.3.2. Mail Order Pharmacies
- 9.3.3. Retail Pharmacies
- 9.3.4. Other End Users
- 9.1. Market Analysis, Insights and Forecast - by Service
- 10. Middle East and Africa Pharmacy Benefit Management Industry Analysis, Insights and Forecast, 2020-2032
- 10.1. Market Analysis, Insights and Forecast - by Service
- 10.1.1. Specialty Pharmacy
- 10.1.2. Drug Formulatory Management
- 10.1.3. Benefit Plan Design and Consultation
- 10.1.4. Other Services
- 10.2. Market Analysis, Insights and Forecast - by Business Model
- 10.2.1. Government Health Programs
- 10.2.2. Employer-Sponsored Programs
- 10.2.3. Health Insurance Management
- 10.3. Market Analysis, Insights and Forecast - by End User
- 10.3.1. Pharmacy Benefit Management Organization
- 10.3.2. Mail Order Pharmacies
- 10.3.3. Retail Pharmacies
- 10.3.4. Other End Users
- 10.1. Market Analysis, Insights and Forecast - by Service
- 11. South America Pharmacy Benefit Management Industry Analysis, Insights and Forecast, 2020-2032
- 11.1. Market Analysis, Insights and Forecast - by Service
- 11.1.1. Specialty Pharmacy
- 11.1.2. Drug Formulatory Management
- 11.1.3. Benefit Plan Design and Consultation
- 11.1.4. Other Services
- 11.2. Market Analysis, Insights and Forecast - by Business Model
- 11.2.1. Government Health Programs
- 11.2.2. Employer-Sponsored Programs
- 11.2.3. Health Insurance Management
- 11.3. Market Analysis, Insights and Forecast - by End User
- 11.3.1. Pharmacy Benefit Management Organization
- 11.3.2. Mail Order Pharmacies
- 11.3.3. Retail Pharmacies
- 11.3.4. Other End Users
- 11.1. Market Analysis, Insights and Forecast - by Service
- 12. Competitive Analysis
- 12.1. Company Profiles
- 12.1.1 Elixir Rx Solutions LLC
- 12.1.1.1. Company Overview
- 12.1.1.2. Products
- 12.1.1.3. Company Financials
- 12.1.1.4. SWOT Analysis
- 12.1.2 Anthem Inc
- 12.1.2.1. Company Overview
- 12.1.2.2. Products
- 12.1.2.3. Company Financials
- 12.1.2.4. SWOT Analysis
- 12.1.3 ProCare Rx
- 12.1.3.1. Company Overview
- 12.1.3.2. Products
- 12.1.3.3. Company Financials
- 12.1.3.4. SWOT Analysis
- 12.1.4 Centene Corporation (Envolve Health)
- 12.1.4.1. Company Overview
- 12.1.4.2. Products
- 12.1.4.3. Company Financials
- 12.1.4.4. SWOT Analysis
- 12.1.5 CaptureRx
- 12.1.5.1. Company Overview
- 12.1.5.2. Products
- 12.1.5.3. Company Financials
- 12.1.5.4. SWOT Analysis
- 12.1.6 Abarca Health
- 12.1.6.1. Company Overview
- 12.1.6.2. Products
- 12.1.6.3. Company Financials
- 12.1.6.4. SWOT Analysis
- 12.1.7 Optum Inc
- 12.1.7.1. Company Overview
- 12.1.7.2. Products
- 12.1.7.3. Company Financials
- 12.1.7.4. SWOT Analysis
- 12.1.8 Benecard Services LLC
- 12.1.8.1. Company Overview
- 12.1.8.2. Products
- 12.1.8.3. Company Financials
- 12.1.8.4. SWOT Analysis
- 12.1.9 Express Scripts Holding Company
- 12.1.9.1. Company Overview
- 12.1.9.2. Products
- 12.1.9.3. Company Financials
- 12.1.9.4. SWOT Analysis
- 12.1.10 SS&C Technologies Inc
- 12.1.10.1. Company Overview
- 12.1.10.2. Products
- 12.1.10.3. Company Financials
- 12.1.10.4. SWOT Analysis
- 12.1.11 Change Healthcare
- 12.1.11.1. Company Overview
- 12.1.11.2. Products
- 12.1.11.3. Company Financials
- 12.1.11.4. SWOT Analysis
- 12.1.12 Cigna
- 12.1.12.1. Company Overview
- 12.1.12.2. Products
- 12.1.12.3. Company Financials
- 12.1.12.4. SWOT Analysis
- 12.1.13 CVS Health
- 12.1.13.1. Company Overview
- 12.1.13.2. Products
- 12.1.13.3. Company Financials
- 12.1.13.4. SWOT Analysis
- 12.1.1 Elixir Rx Solutions LLC
- 12.2. Market Entropy
- 12.2.1 Company's Key Areas Served
- 12.2.2 Recent Developments
- 12.3. Company Market Share Analysis 2025
- 12.3.1 Top 5 Companies Market Share Analysis
- 12.3.2 Top 3 Companies Market Share Analysis
- 12.4. List of Potential Customers
- 13. Research Methodology
List of Figures
- Figure 1: Global Pharmacy Benefit Management Industry Revenue Breakdown (Million, %) by Region 2025 & 2033
- Figure 2: North America Pharmacy Benefit Management Industry Revenue (Million), by Service 2025 & 2033
- Figure 3: North America Pharmacy Benefit Management Industry Revenue Share (%), by Service 2025 & 2033
- Figure 4: North America Pharmacy Benefit Management Industry Revenue (Million), by Business Model 2025 & 2033
- Figure 5: North America Pharmacy Benefit Management Industry Revenue Share (%), by Business Model 2025 & 2033
- Figure 6: North America Pharmacy Benefit Management Industry Revenue (Million), by End User 2025 & 2033
- Figure 7: North America Pharmacy Benefit Management Industry Revenue Share (%), by End User 2025 & 2033
- Figure 8: North America Pharmacy Benefit Management Industry Revenue (Million), by Country 2025 & 2033
- Figure 9: North America Pharmacy Benefit Management Industry Revenue Share (%), by Country 2025 & 2033
- Figure 10: Europe Pharmacy Benefit Management Industry Revenue (Million), by Service 2025 & 2033
- Figure 11: Europe Pharmacy Benefit Management Industry Revenue Share (%), by Service 2025 & 2033
- Figure 12: Europe Pharmacy Benefit Management Industry Revenue (Million), by Business Model 2025 & 2033
- Figure 13: Europe Pharmacy Benefit Management Industry Revenue Share (%), by Business Model 2025 & 2033
- Figure 14: Europe Pharmacy Benefit Management Industry Revenue (Million), by End User 2025 & 2033
- Figure 15: Europe Pharmacy Benefit Management Industry Revenue Share (%), by End User 2025 & 2033
- Figure 16: Europe Pharmacy Benefit Management Industry Revenue (Million), by Country 2025 & 2033
- Figure 17: Europe Pharmacy Benefit Management Industry Revenue Share (%), by Country 2025 & 2033
- Figure 18: Asia Pacific Pharmacy Benefit Management Industry Revenue (Million), by Service 2025 & 2033
- Figure 19: Asia Pacific Pharmacy Benefit Management Industry Revenue Share (%), by Service 2025 & 2033
- Figure 20: Asia Pacific Pharmacy Benefit Management Industry Revenue (Million), by Business Model 2025 & 2033
- Figure 21: Asia Pacific Pharmacy Benefit Management Industry Revenue Share (%), by Business Model 2025 & 2033
- Figure 22: Asia Pacific Pharmacy Benefit Management Industry Revenue (Million), by End User 2025 & 2033
- Figure 23: Asia Pacific Pharmacy Benefit Management Industry Revenue Share (%), by End User 2025 & 2033
- Figure 24: Asia Pacific Pharmacy Benefit Management Industry Revenue (Million), by Country 2025 & 2033
- Figure 25: Asia Pacific Pharmacy Benefit Management Industry Revenue Share (%), by Country 2025 & 2033
- Figure 26: Middle East and Africa Pharmacy Benefit Management Industry Revenue (Million), by Service 2025 & 2033
- Figure 27: Middle East and Africa Pharmacy Benefit Management Industry Revenue Share (%), by Service 2025 & 2033
- Figure 28: Middle East and Africa Pharmacy Benefit Management Industry Revenue (Million), by Business Model 2025 & 2033
- Figure 29: Middle East and Africa Pharmacy Benefit Management Industry Revenue Share (%), by Business Model 2025 & 2033
- Figure 30: Middle East and Africa Pharmacy Benefit Management Industry Revenue (Million), by End User 2025 & 2033
- Figure 31: Middle East and Africa Pharmacy Benefit Management Industry Revenue Share (%), by End User 2025 & 2033
- Figure 32: Middle East and Africa Pharmacy Benefit Management Industry Revenue (Million), by Country 2025 & 2033
- Figure 33: Middle East and Africa Pharmacy Benefit Management Industry Revenue Share (%), by Country 2025 & 2033
- Figure 34: South America Pharmacy Benefit Management Industry Revenue (Million), by Service 2025 & 2033
- Figure 35: South America Pharmacy Benefit Management Industry Revenue Share (%), by Service 2025 & 2033
- Figure 36: South America Pharmacy Benefit Management Industry Revenue (Million), by Business Model 2025 & 2033
- Figure 37: South America Pharmacy Benefit Management Industry Revenue Share (%), by Business Model 2025 & 2033
- Figure 38: South America Pharmacy Benefit Management Industry Revenue (Million), by End User 2025 & 2033
- Figure 39: South America Pharmacy Benefit Management Industry Revenue Share (%), by End User 2025 & 2033
- Figure 40: South America Pharmacy Benefit Management Industry Revenue (Million), by Country 2025 & 2033
- Figure 41: South America Pharmacy Benefit Management Industry Revenue Share (%), by Country 2025 & 2033
List of Tables
- Table 1: Global Pharmacy Benefit Management Industry Revenue Million Forecast, by Service 2020 & 2033
- Table 2: Global Pharmacy Benefit Management Industry Revenue Million Forecast, by Business Model 2020 & 2033
- Table 3: Global Pharmacy Benefit Management Industry Revenue Million Forecast, by End User 2020 & 2033
- Table 4: Global Pharmacy Benefit Management Industry Revenue Million Forecast, by Region 2020 & 2033
- Table 5: Global Pharmacy Benefit Management Industry Revenue Million Forecast, by Service 2020 & 2033
- Table 6: Global Pharmacy Benefit Management Industry Revenue Million Forecast, by Business Model 2020 & 2033
- Table 7: Global Pharmacy Benefit Management Industry Revenue Million Forecast, by End User 2020 & 2033
- Table 8: Global Pharmacy Benefit Management Industry Revenue Million Forecast, by Country 2020 & 2033
- Table 9: United States Pharmacy Benefit Management Industry Revenue (Million) Forecast, by Application 2020 & 2033
- Table 10: Canada Pharmacy Benefit Management Industry Revenue (Million) Forecast, by Application 2020 & 2033
- Table 11: Mexico Pharmacy Benefit Management Industry Revenue (Million) Forecast, by Application 2020 & 2033
- Table 12: Global Pharmacy Benefit Management Industry Revenue Million Forecast, by Service 2020 & 2033
- Table 13: Global Pharmacy Benefit Management Industry Revenue Million Forecast, by Business Model 2020 & 2033
- Table 14: Global Pharmacy Benefit Management Industry Revenue Million Forecast, by End User 2020 & 2033
- Table 15: Global Pharmacy Benefit Management Industry Revenue Million Forecast, by Country 2020 & 2033
- Table 16: Germany Pharmacy Benefit Management Industry Revenue (Million) Forecast, by Application 2020 & 2033
- Table 17: United Kingdom Pharmacy Benefit Management Industry Revenue (Million) Forecast, by Application 2020 & 2033
- Table 18: France Pharmacy Benefit Management Industry Revenue (Million) Forecast, by Application 2020 & 2033
- Table 19: Italy Pharmacy Benefit Management Industry Revenue (Million) Forecast, by Application 2020 & 2033
- Table 20: Spain Pharmacy Benefit Management Industry Revenue (Million) Forecast, by Application 2020 & 2033
- Table 21: Rest of Europe Pharmacy Benefit Management Industry Revenue (Million) Forecast, by Application 2020 & 2033
- Table 22: Global Pharmacy Benefit Management Industry Revenue Million Forecast, by Service 2020 & 2033
- Table 23: Global Pharmacy Benefit Management Industry Revenue Million Forecast, by Business Model 2020 & 2033
- Table 24: Global Pharmacy Benefit Management Industry Revenue Million Forecast, by End User 2020 & 2033
- Table 25: Global Pharmacy Benefit Management Industry Revenue Million Forecast, by Country 2020 & 2033
- Table 26: China Pharmacy Benefit Management Industry Revenue (Million) Forecast, by Application 2020 & 2033
- Table 27: Japan Pharmacy Benefit Management Industry Revenue (Million) Forecast, by Application 2020 & 2033
- Table 28: India Pharmacy Benefit Management Industry Revenue (Million) Forecast, by Application 2020 & 2033
- Table 29: Australia Pharmacy Benefit Management Industry Revenue (Million) Forecast, by Application 2020 & 2033
- Table 30: South Korea Pharmacy Benefit Management Industry Revenue (Million) Forecast, by Application 2020 & 2033
- Table 31: Rest of Asia Pacific Pharmacy Benefit Management Industry Revenue (Million) Forecast, by Application 2020 & 2033
- Table 32: Global Pharmacy Benefit Management Industry Revenue Million Forecast, by Service 2020 & 2033
- Table 33: Global Pharmacy Benefit Management Industry Revenue Million Forecast, by Business Model 2020 & 2033
- Table 34: Global Pharmacy Benefit Management Industry Revenue Million Forecast, by End User 2020 & 2033
- Table 35: Global Pharmacy Benefit Management Industry Revenue Million Forecast, by Country 2020 & 2033
- Table 36: GCC Pharmacy Benefit Management Industry Revenue (Million) Forecast, by Application 2020 & 2033
- Table 37: South Africa Pharmacy Benefit Management Industry Revenue (Million) Forecast, by Application 2020 & 2033
- Table 38: Rest of Middle East and Africa Pharmacy Benefit Management Industry Revenue (Million) Forecast, by Application 2020 & 2033
- Table 39: Global Pharmacy Benefit Management Industry Revenue Million Forecast, by Service 2020 & 2033
- Table 40: Global Pharmacy Benefit Management Industry Revenue Million Forecast, by Business Model 2020 & 2033
- Table 41: Global Pharmacy Benefit Management Industry Revenue Million Forecast, by End User 2020 & 2033
- Table 42: Global Pharmacy Benefit Management Industry Revenue Million Forecast, by Country 2020 & 2033
- Table 43: Brazil Pharmacy Benefit Management Industry Revenue (Million) Forecast, by Application 2020 & 2033
- Table 44: Argentina Pharmacy Benefit Management Industry Revenue (Million) Forecast, by Application 2020 & 2033
- Table 45: Rest of South America Pharmacy Benefit Management Industry Revenue (Million) Forecast, by Application 2020 & 2033
Frequently Asked Questions
1. What is the projected Compound Annual Growth Rate (CAGR) of the Pharmacy Benefit Management Industry?
The projected CAGR is approximately 5.64%.
2. Which companies are prominent players in the Pharmacy Benefit Management Industry?
Key companies in the market include Elixir Rx Solutions LLC, Anthem Inc, ProCare Rx, Centene Corporation (Envolve Health), CaptureRx, Abarca Health, Optum Inc, Benecard Services LLC, Express Scripts Holding Company, SS&C Technologies Inc, Change Healthcare, Cigna, CVS Health.
3. What are the main segments of the Pharmacy Benefit Management Industry?
The market segments include Service, Business Model, End User.
4. Can you provide details about the market size?
The market size is estimated to be USD 589.40 Million as of 2022.
5. What are some drivers contributing to market growth?
Rising Inclination Towards Pharmacy Benefit Management System (PBMS); Increasing Health Expenditure; Growing Demand for Prescription Products.
6. What are the notable trends driving market growth?
Specialty Pharmacy Segment is Expected to Witness Significant Growth Over the Forecast Period.
7. Are there any restraints impacting market growth?
Reluctance To Adopt Pharmacy Automation Systems and Stringent Regulatory Procedures on Confidentiality.
8. Can you provide examples of recent developments in the market?
October 2022: Omnicell, Inc., a provider of medication management and adherence tools for health systems and pharmacies, launched Specialty Pharmacy Services, a comprehensive offering designed to help health systems launch and/or optimize a fully managed, hospital-owned specialty pharmacy.
9. What pricing options are available for accessing the report?
Pricing options include single-user, multi-user, and enterprise licenses priced at USD 4750, USD 5250, and USD 8750 respectively.
10. Is the market size provided in terms of value or volume?
The market size is provided in terms of value, measured in Million.
11. Are there any specific market keywords associated with the report?
Yes, the market keyword associated with the report is "Pharmacy Benefit Management Industry," which aids in identifying and referencing the specific market segment covered.
12. How do I determine which pricing option suits my needs best?
The pricing options vary based on user requirements and access needs. Individual users may opt for single-user licenses, while businesses requiring broader access may choose multi-user or enterprise licenses for cost-effective access to the report.
13. Are there any additional resources or data provided in the Pharmacy Benefit Management Industry report?
While the report offers comprehensive insights, it's advisable to review the specific contents or supplementary materials provided to ascertain if additional resources or data are available.
14. How can I stay updated on further developments or reports in the Pharmacy Benefit Management Industry?
To stay informed about further developments, trends, and reports in the Pharmacy Benefit Management Industry, consider subscribing to industry newsletters, following relevant companies and organizations, or regularly checking reputable industry news sources and publications.
Methodology
Step 1 - Identification of Relevant Samples Size from Population Database


Step 2 - Approaches for Defining Global Market Size (Value, Volume* & Price*)

Note*: In applicable scenarios
Step 3 - Data Sources
Primary Research
- Web Analytics
- Survey Reports
- Research Institute
- Latest Research Reports
- Opinion Leaders
Secondary Research
- Annual Reports
- White Paper
- Latest Press Release
- Industry Association
- Paid Database
- Investor Presentations

Step 4 - Data Triangulation
Involves using different sources of information in order to increase the validity of a study
These sources are likely to be stakeholders in a program - participants, other researchers, program staff, other community members, and so on.
Then we put all data in single framework & apply various statistical tools to find out the dynamic on the market.
During the analysis stage, feedback from the stakeholder groups would be compared to determine areas of agreement as well as areas of divergence