

Key Insights
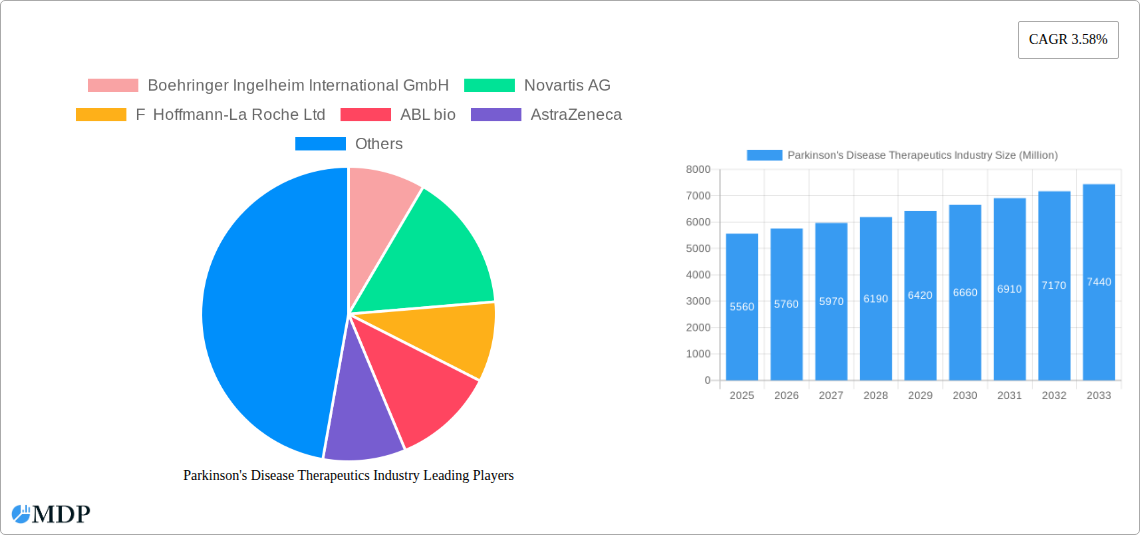
The Parkinson's Disease Therapeutics market, valued at $5.56 billion in 2025, is projected to experience steady growth, driven by a rising geriatric population globally and an increasing prevalence of Parkinson's disease. The market's Compound Annual Growth Rate (CAGR) of 3.58% from 2025 to 2033 reflects a consistent demand for effective therapies. Key growth drivers include advancements in drug development, focusing on novel mechanisms of action beyond levodopa, a growing understanding of disease pathogenesis leading to targeted therapies, and increased investment in research and development by pharmaceutical companies. The market is segmented by mechanism of action, with Dopamine Agonists, Carbidopa-levodopa, and MAO-B inhibitors representing significant portions, while newer therapies like COMT inhibitors and other innovative approaches are gaining traction. Geographic distribution shows a significant concentration in North America and Europe, reflecting higher healthcare expenditure and awareness, but the Asia-Pacific region is anticipated to witness substantial growth owing to increasing prevalence rates and improving healthcare infrastructure. Competitive dynamics are shaped by a mix of established players like Boehringer Ingelheim, Novartis, and Roche, alongside emerging biotech companies developing innovative treatments. Challenges such as the lack of disease-modifying therapies, the complexity of the disease, and variable patient responses to treatment continue to influence market dynamics.
Despite the promising growth trajectory, the market faces some restraints. The high cost of treatment, especially for novel therapies, can limit accessibility, particularly in developing economies. Furthermore, the progressive nature of the disease necessitates long-term treatment, leading to significant healthcare costs. The ongoing research into disease-modifying therapies holds immense potential to alter the long-term outlook for patients, and a successful outcome could significantly boost market growth beyond the current projections. The effectiveness of different treatment approaches varies among patients, highlighting the need for personalized medicine approaches and advancements in diagnostic tools for early disease identification and improved treatment strategies. This personalized approach and the development of novel therapies will shape the future of this market.
Parkinson's Disease Therapeutics Industry: A Comprehensive Market Report (2019-2033)
This comprehensive report provides an in-depth analysis of the Parkinson's Disease Therapeutics industry, offering crucial insights for stakeholders, investors, and industry professionals. Covering the period 2019-2033, with a base year of 2025 and a forecast period of 2025-2033, this report unveils market dynamics, leading players, emerging trends, and future opportunities within this rapidly evolving sector. The report leverages extensive data analysis to provide actionable intelligence and strategic recommendations for navigating the complexities of this vital market. Expected market size is projected to reach xx Million by 2033.
Parkinson's Disease Therapeutics Industry Market Dynamics & Concentration
The Parkinson's Disease Therapeutics market is characterized by a moderately concentrated landscape, with key players such as Boehringer Ingelheim, Novartis, Roche, and AstraZeneca holding significant market share. However, the influx of innovative biotech companies and strategic partnerships is fostering increased competition. The market's growth is driven by rising prevalence of Parkinson's disease globally, aging populations, and increasing awareness and diagnosis rates. Regulatory frameworks play a crucial role, influencing drug approvals and market access. The presence of substitute therapies, albeit limited in efficacy, affects market dynamics. End-user trends, including patient preferences and physician prescribing habits, are also factored in. M&A activities in the industry have been significant, with xx major deals recorded between 2019 and 2024, consolidating market share and accelerating innovation. Market concentration is expected to remain relatively stable in the forecast period, with a Herfindahl-Hirschman Index (HHI) of xx.
- Market Share (2024): Boehringer Ingelheim (xx%), Novartis (xx%), Roche (xx%), AstraZeneca (xx%), Others (xx%).
- M&A Deal Count (2019-2024): xx
- Key Innovation Drivers: Development of novel mechanisms of action, improved drug delivery systems, and personalized medicine approaches.
- Regulatory Landscape: Stringent approval processes and evolving reimbursement policies impact market access.
Parkinson's Disease Therapeutics Industry Industry Trends & Analysis
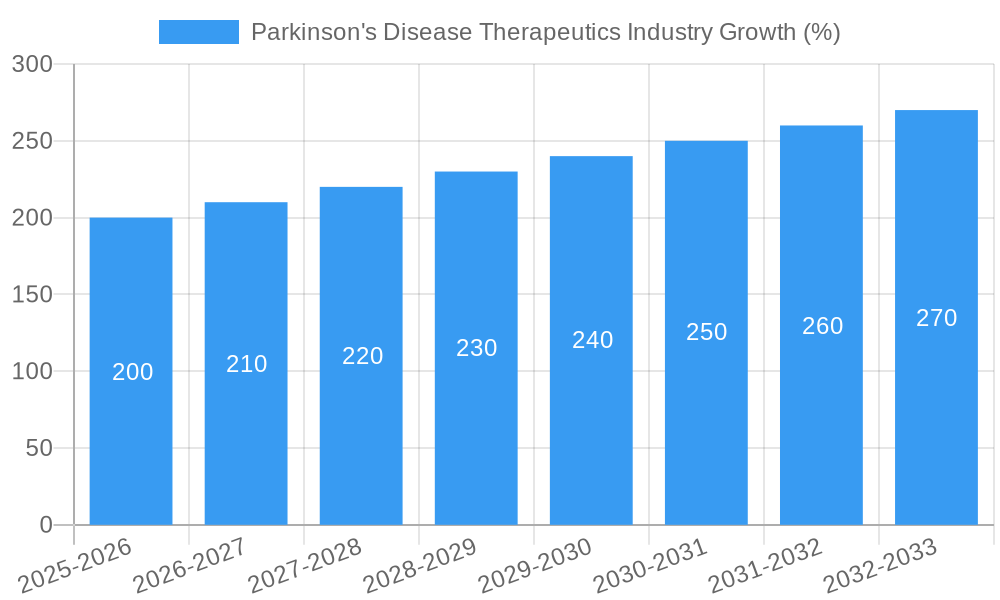
The Parkinson's Disease Therapeutics market is projected to experience a Compound Annual Growth Rate (CAGR) of xx% during the forecast period (2025-2033). This growth is fueled by several factors including the increasing prevalence of Parkinson's disease, advancements in research and development leading to novel therapies, and an expanding global geriatric population. Technological disruptions, such as the development of advanced diagnostic tools and personalized medicine approaches, are significantly altering the treatment landscape. Consumer preferences are shifting towards less invasive treatments with fewer side effects, which necessitates the development of novel drug delivery systems and therapeutic modalities. Competitive dynamics are intensifying with increased investment in R&D and the emergence of new players. Market penetration of new therapies varies depending on their efficacy, safety profile, and overall cost-effectiveness.
Leading Markets & Segments in Parkinson's Disease Therapeutics Industry
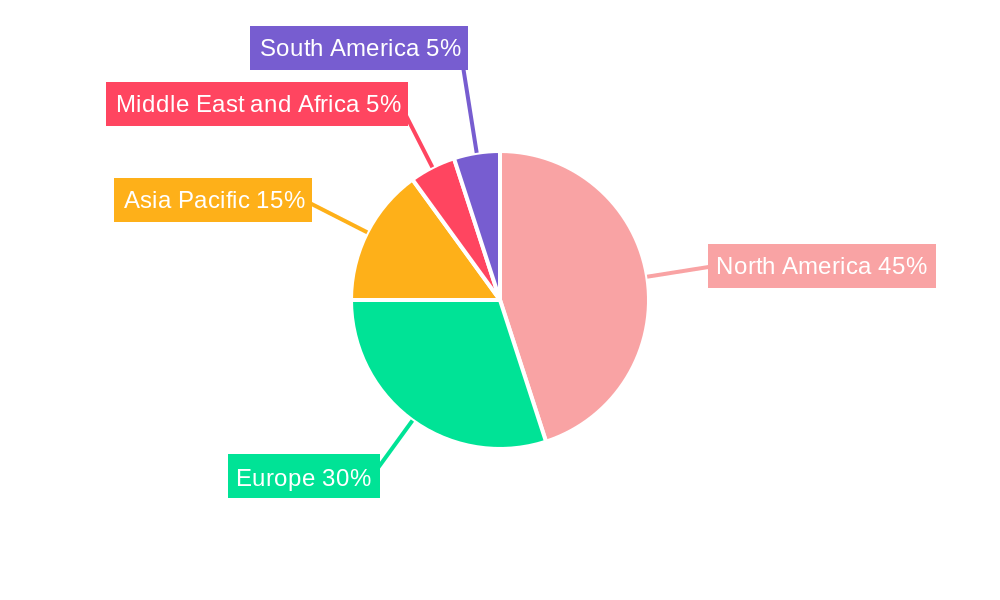
North America currently dominates the Parkinson's Disease Therapeutics market due to high prevalence rates, robust healthcare infrastructure, and a higher per capita spending on healthcare. Within the market, Carbidopa-levodopa remains the dominant mechanism of action segment due to its established efficacy and cost-effectiveness. Other significant segments include Dopamine Agonists, MAO-B inhibitors, and COMT inhibitors. However, the market is witnessing a gradual shift towards newer mechanisms of action as research progresses and novel therapies emerge.
- Key Drivers for North American Dominance: High healthcare expenditure, well-established healthcare infrastructure, and high prevalence rates of Parkinson's disease.
- Key Drivers for Carbidopa-levodopa Segment Dominance: Established efficacy, relatively lower cost compared to newer therapies, and widespread physician familiarity.
- Other Segment Growth Drivers: Increased awareness of alternative treatment options, improved efficacy profiles of newer drugs, and focus on patient-centric care.
Parkinson's Disease Therapeutics Industry Product Developments
The industry is witnessing significant product innovations, focusing on improved efficacy, reduced side effects, and novel drug delivery systems. These developments aim to address unmet medical needs and enhance patient outcomes. Specific examples include the development of next-generation dopamine agonists with improved tolerability, novel MAO-B inhibitors with enhanced brain penetration, and advanced drug delivery systems to improve bioavailability and reduce side effects. These advancements are gaining traction due to their potential to improve the quality of life for patients with Parkinson’s disease.
Key Drivers of Parkinson's Disease Therapeutics Industry Growth
Several factors are driving the growth of the Parkinson's Disease Therapeutics market. Firstly, the increasing prevalence of Parkinson's disease globally, particularly in aging populations, is creating substantial demand. Secondly, advancements in research and development are resulting in the development of novel therapies with improved efficacy and safety profiles. Thirdly, the rising awareness and understanding of Parkinson's disease among healthcare professionals and patients leads to increased diagnosis and treatment rates. Finally, supportive government initiatives and increased funding for research further accelerate market expansion.
Challenges in the Parkinson's Disease Therapeutics Industry Market
The Parkinson's Disease Therapeutics market faces several challenges. Stringent regulatory pathways for drug approvals can delay the introduction of new therapies, impacting market entry and growth. Supply chain disruptions can affect the availability and affordability of essential medicines. Furthermore, intense competition among established pharmaceutical companies and emerging biotech firms exerts pressure on pricing and market share. These challenges create uncertainty and demand strategic approaches to navigate the market effectively. The cost of development and the limited success rate of clinical trials also poses significant challenges.
Emerging Opportunities in Parkinson's Disease Therapeutics Industry
Significant opportunities exist within the Parkinson's Disease Therapeutics market. Technological advancements, such as gene therapy and stem cell therapy, hold the potential to revolutionize treatment strategies. Strategic partnerships and collaborations between pharmaceutical companies and research institutions are accelerating the development and commercialization of innovative therapies. Expansion into emerging markets with high unmet medical needs presents substantial growth potential.
Leading Players in the Parkinson's Disease Therapeutics Industry Sector
- Boehringer Ingelheim International GmbH
- Novartis AG
- F Hoffmann-La Roche Ltd
- ABL bio
- AstraZeneca
- Teva Pharmaceuticals Industries Ltd
- Prevail Therapeutics
- Kissei Pharmaceutical Co Ltd
- Newron Pharmaceuticals SPA
- Viatris
- AbbVie Inc
- GSK plc
- Amneal Pharmaceuticals LLC
- Pfizer Inc
Key Milestones in Parkinson's Disease Therapeutics Industry Industry
- March 2022: Neuron23 raised USD 100 Million to advance Parkinson's disease therapy, initiating trials of NEU-723.
- January 2022: ABL Bio Inc. partnered with Sanofi for worldwide licensing of ABL301, a bispecific antibody targeting alpha-synuclein and IGF1R.
Strategic Outlook for Parkinson's Disease Therapeutics Industry Market
The future of the Parkinson's Disease Therapeutics market is promising, driven by continuous innovation in drug development and an increasing understanding of disease mechanisms. Strategic partnerships, focusing on early-stage research and development, will play a crucial role in accelerating the pace of innovation. Expansion into emerging markets will offer substantial opportunities for growth. The development of personalized medicine approaches, tailored to individual patient needs, holds immense potential for improving treatment outcomes and enhancing patient quality of life. Overall, the market is poised for significant expansion, offering lucrative prospects for industry players who embrace innovation and strategic partnerships.
Parkinson's Disease Therapeutics Industry Segmentation
-
1. Mechanism of Action
- 1.1. Dopamine Agonists
- 1.2. Anticholinergic
- 1.3. MAO-B inhibitors
- 1.4. Amantadine
- 1.5. Carbidopa-levodopa
- 1.6. COMT Inhibitors
- 1.7. Other Mechanisms of Action
Parkinson's Disease Therapeutics Industry Segmentation By Geography
-
1. North America
- 1.1. United States
- 1.2. Canada
- 1.3. Mexico
-
2. Europe
- 2.1. Germany
- 2.2. United Kingdom
- 2.3. France
- 2.4. Italy
- 2.5. Spain
- 2.6. Rest of Europe
-
3. Asia Pacific
- 3.1. China
- 3.2. Japan
- 3.3. India
- 3.4. Australia
- 3.5. South Korea
- 3.6. Rest of Asia Pacific
-
4. Middle East and Africa
- 4.1. GCC
- 4.2. South Africa
- 4.3. Rest of Middle East and Africa
-
5. South America
- 5.1. Brazil
- 5.2. Argentina
- 5.3. Rest of South America
Parkinson's Disease Therapeutics Industry REPORT HIGHLIGHTS
| Aspects | Details |
|---|---|
| Study Period | 2019-2033 |
| Base Year | 2024 |
| Estimated Year | 2025 |
| Forecast Period | 2025-2033 |
| Historical Period | 2019-2024 |
| Growth Rate | CAGR of 3.58% from 2019-2033 |
| Segmentation |
|
Table of Contents
- 1. Introduction
- 1.1. Research Scope
- 1.2. Market Segmentation
- 1.3. Research Methodology
- 1.4. Definitions and Assumptions
- 2. Executive Summary
- 2.1. Introduction
- 3. Market Dynamics
- 3.1. Introduction
- 3.2. Market Drivers
- 3.2.1. Rising Geriatric Population and Burden of Parkinson's Disease; Growing Awareness Among the Population; Increasing R&D and Continuous Drug Approvals
- 3.3. Market Restrains
- 3.3.1. Adverse Events Associated with Therapeutics; High Cost of Treatments Followed by Extremely High R&D Expenditure
- 3.4. Market Trends
- 3.4.1. MAO-B inhibitors Segment is Expected to Dominate the Market Over the Forecast Period
- 4. Market Factor Analysis
- 4.1. Porters Five Forces
- 4.2. Supply/Value Chain
- 4.3. PESTEL analysis
- 4.4. Market Entropy
- 4.5. Patent/Trademark Analysis
- 5. Global Parkinson's Disease Therapeutics Industry Analysis, Insights and Forecast, 2019-2031
- 5.1. Market Analysis, Insights and Forecast - by Mechanism of Action
- 5.1.1. Dopamine Agonists
- 5.1.2. Anticholinergic
- 5.1.3. MAO-B inhibitors
- 5.1.4. Amantadine
- 5.1.5. Carbidopa-levodopa
- 5.1.6. COMT Inhibitors
- 5.1.7. Other Mechanisms of Action
- 5.2. Market Analysis, Insights and Forecast - by Region
- 5.2.1. North America
- 5.2.2. Europe
- 5.2.3. Asia Pacific
- 5.2.4. Middle East and Africa
- 5.2.5. South America
- 5.1. Market Analysis, Insights and Forecast - by Mechanism of Action
- 6. North America Parkinson's Disease Therapeutics Industry Analysis, Insights and Forecast, 2019-2031
- 6.1. Market Analysis, Insights and Forecast - by Mechanism of Action
- 6.1.1. Dopamine Agonists
- 6.1.2. Anticholinergic
- 6.1.3. MAO-B inhibitors
- 6.1.4. Amantadine
- 6.1.5. Carbidopa-levodopa
- 6.1.6. COMT Inhibitors
- 6.1.7. Other Mechanisms of Action
- 6.1. Market Analysis, Insights and Forecast - by Mechanism of Action
- 7. Europe Parkinson's Disease Therapeutics Industry Analysis, Insights and Forecast, 2019-2031
- 7.1. Market Analysis, Insights and Forecast - by Mechanism of Action
- 7.1.1. Dopamine Agonists
- 7.1.2. Anticholinergic
- 7.1.3. MAO-B inhibitors
- 7.1.4. Amantadine
- 7.1.5. Carbidopa-levodopa
- 7.1.6. COMT Inhibitors
- 7.1.7. Other Mechanisms of Action
- 7.1. Market Analysis, Insights and Forecast - by Mechanism of Action
- 8. Asia Pacific Parkinson's Disease Therapeutics Industry Analysis, Insights and Forecast, 2019-2031
- 8.1. Market Analysis, Insights and Forecast - by Mechanism of Action
- 8.1.1. Dopamine Agonists
- 8.1.2. Anticholinergic
- 8.1.3. MAO-B inhibitors
- 8.1.4. Amantadine
- 8.1.5. Carbidopa-levodopa
- 8.1.6. COMT Inhibitors
- 8.1.7. Other Mechanisms of Action
- 8.1. Market Analysis, Insights and Forecast - by Mechanism of Action
- 9. Middle East and Africa Parkinson's Disease Therapeutics Industry Analysis, Insights and Forecast, 2019-2031
- 9.1. Market Analysis, Insights and Forecast - by Mechanism of Action
- 9.1.1. Dopamine Agonists
- 9.1.2. Anticholinergic
- 9.1.3. MAO-B inhibitors
- 9.1.4. Amantadine
- 9.1.5. Carbidopa-levodopa
- 9.1.6. COMT Inhibitors
- 9.1.7. Other Mechanisms of Action
- 9.1. Market Analysis, Insights and Forecast - by Mechanism of Action
- 10. South America Parkinson's Disease Therapeutics Industry Analysis, Insights and Forecast, 2019-2031
- 10.1. Market Analysis, Insights and Forecast - by Mechanism of Action
- 10.1.1. Dopamine Agonists
- 10.1.2. Anticholinergic
- 10.1.3. MAO-B inhibitors
- 10.1.4. Amantadine
- 10.1.5. Carbidopa-levodopa
- 10.1.6. COMT Inhibitors
- 10.1.7. Other Mechanisms of Action
- 10.1. Market Analysis, Insights and Forecast - by Mechanism of Action
- 11. North America Parkinson's Disease Therapeutics Industry Analysis, Insights and Forecast, 2019-2031
- 11.1. Market Analysis, Insights and Forecast - By Country/Sub-region
- 11.1.1 United States
- 11.1.2 Canada
- 11.1.3 Mexico
- 12. Europe Parkinson's Disease Therapeutics Industry Analysis, Insights and Forecast, 2019-2031
- 12.1. Market Analysis, Insights and Forecast - By Country/Sub-region
- 12.1.1 Germany
- 12.1.2 United Kingdom
- 12.1.3 France
- 12.1.4 Italy
- 12.1.5 Spain
- 12.1.6 Rest of Europe
- 13. Asia Pacific Parkinson's Disease Therapeutics Industry Analysis, Insights and Forecast, 2019-2031
- 13.1. Market Analysis, Insights and Forecast - By Country/Sub-region
- 13.1.1 China
- 13.1.2 Japan
- 13.1.3 India
- 13.1.4 Australia
- 13.1.5 South Korea
- 13.1.6 Rest of Asia Pacific
- 14. Middle East and Africa Parkinson's Disease Therapeutics Industry Analysis, Insights and Forecast, 2019-2031
- 14.1. Market Analysis, Insights and Forecast - By Country/Sub-region
- 14.1.1 GCC
- 14.1.2 South Africa
- 14.1.3 Rest of Middle East and Africa
- 15. South America Parkinson's Disease Therapeutics Industry Analysis, Insights and Forecast, 2019-2031
- 15.1. Market Analysis, Insights and Forecast - By Country/Sub-region
- 15.1.1 Brazil
- 15.1.2 Argentina
- 15.1.3 Rest of South America
- 16. Competitive Analysis
- 16.1. Global Market Share Analysis 2024
- 16.2. Company Profiles
- 16.2.1 Boehringer Ingelheim International GmbH
- 16.2.1.1. Overview
- 16.2.1.2. Products
- 16.2.1.3. SWOT Analysis
- 16.2.1.4. Recent Developments
- 16.2.1.5. Financials (Based on Availability)
- 16.2.2 Novartis AG
- 16.2.2.1. Overview
- 16.2.2.2. Products
- 16.2.2.3. SWOT Analysis
- 16.2.2.4. Recent Developments
- 16.2.2.5. Financials (Based on Availability)
- 16.2.3 F Hoffmann-La Roche Ltd
- 16.2.3.1. Overview
- 16.2.3.2. Products
- 16.2.3.3. SWOT Analysis
- 16.2.3.4. Recent Developments
- 16.2.3.5. Financials (Based on Availability)
- 16.2.4 ABL bio
- 16.2.4.1. Overview
- 16.2.4.2. Products
- 16.2.4.3. SWOT Analysis
- 16.2.4.4. Recent Developments
- 16.2.4.5. Financials (Based on Availability)
- 16.2.5 AstraZeneca
- 16.2.5.1. Overview
- 16.2.5.2. Products
- 16.2.5.3. SWOT Analysis
- 16.2.5.4. Recent Developments
- 16.2.5.5. Financials (Based on Availability)
- 16.2.6 Teva Pharmaceuticals Industries Ltd
- 16.2.6.1. Overview
- 16.2.6.2. Products
- 16.2.6.3. SWOT Analysis
- 16.2.6.4. Recent Developments
- 16.2.6.5. Financials (Based on Availability)
- 16.2.7 Prevail Therapeutics
- 16.2.7.1. Overview
- 16.2.7.2. Products
- 16.2.7.3. SWOT Analysis
- 16.2.7.4. Recent Developments
- 16.2.7.5. Financials (Based on Availability)
- 16.2.8 Kissei Pharmaceutical Co Ltd
- 16.2.8.1. Overview
- 16.2.8.2. Products
- 16.2.8.3. SWOT Analysis
- 16.2.8.4. Recent Developments
- 16.2.8.5. Financials (Based on Availability)
- 16.2.9 Newron Pharmaceuticals SPA
- 16.2.9.1. Overview
- 16.2.9.2. Products
- 16.2.9.3. SWOT Analysis
- 16.2.9.4. Recent Developments
- 16.2.9.5. Financials (Based on Availability)
- 16.2.10 Viatris
- 16.2.10.1. Overview
- 16.2.10.2. Products
- 16.2.10.3. SWOT Analysis
- 16.2.10.4. Recent Developments
- 16.2.10.5. Financials (Based on Availability)
- 16.2.11 AbbVie Inc
- 16.2.11.1. Overview
- 16.2.11.2. Products
- 16.2.11.3. SWOT Analysis
- 16.2.11.4. Recent Developments
- 16.2.11.5. Financials (Based on Availability)
- 16.2.12 GSK plc
- 16.2.12.1. Overview
- 16.2.12.2. Products
- 16.2.12.3. SWOT Analysis
- 16.2.12.4. Recent Developments
- 16.2.12.5. Financials (Based on Availability)
- 16.2.13 Amneal Pharmaceuticals LLC
- 16.2.13.1. Overview
- 16.2.13.2. Products
- 16.2.13.3. SWOT Analysis
- 16.2.13.4. Recent Developments
- 16.2.13.5. Financials (Based on Availability)
- 16.2.14 Pfizer Inc
- 16.2.14.1. Overview
- 16.2.14.2. Products
- 16.2.14.3. SWOT Analysis
- 16.2.14.4. Recent Developments
- 16.2.14.5. Financials (Based on Availability)
- 16.2.1 Boehringer Ingelheim International GmbH
List of Figures
- Figure 1: Global Parkinson's Disease Therapeutics Industry Revenue Breakdown (Million, %) by Region 2024 & 2032
- Figure 2: Global Parkinson's Disease Therapeutics Industry Volume Breakdown (K Unit, %) by Region 2024 & 2032
- Figure 3: North America Parkinson's Disease Therapeutics Industry Revenue (Million), by Country 2024 & 2032
- Figure 4: North America Parkinson's Disease Therapeutics Industry Volume (K Unit), by Country 2024 & 2032
- Figure 5: North America Parkinson's Disease Therapeutics Industry Revenue Share (%), by Country 2024 & 2032
- Figure 6: North America Parkinson's Disease Therapeutics Industry Volume Share (%), by Country 2024 & 2032
- Figure 7: Europe Parkinson's Disease Therapeutics Industry Revenue (Million), by Country 2024 & 2032
- Figure 8: Europe Parkinson's Disease Therapeutics Industry Volume (K Unit), by Country 2024 & 2032
- Figure 9: Europe Parkinson's Disease Therapeutics Industry Revenue Share (%), by Country 2024 & 2032
- Figure 10: Europe Parkinson's Disease Therapeutics Industry Volume Share (%), by Country 2024 & 2032
- Figure 11: Asia Pacific Parkinson's Disease Therapeutics Industry Revenue (Million), by Country 2024 & 2032
- Figure 12: Asia Pacific Parkinson's Disease Therapeutics Industry Volume (K Unit), by Country 2024 & 2032
- Figure 13: Asia Pacific Parkinson's Disease Therapeutics Industry Revenue Share (%), by Country 2024 & 2032
- Figure 14: Asia Pacific Parkinson's Disease Therapeutics Industry Volume Share (%), by Country 2024 & 2032
- Figure 15: Middle East and Africa Parkinson's Disease Therapeutics Industry Revenue (Million), by Country 2024 & 2032
- Figure 16: Middle East and Africa Parkinson's Disease Therapeutics Industry Volume (K Unit), by Country 2024 & 2032
- Figure 17: Middle East and Africa Parkinson's Disease Therapeutics Industry Revenue Share (%), by Country 2024 & 2032
- Figure 18: Middle East and Africa Parkinson's Disease Therapeutics Industry Volume Share (%), by Country 2024 & 2032
- Figure 19: South America Parkinson's Disease Therapeutics Industry Revenue (Million), by Country 2024 & 2032
- Figure 20: South America Parkinson's Disease Therapeutics Industry Volume (K Unit), by Country 2024 & 2032
- Figure 21: South America Parkinson's Disease Therapeutics Industry Revenue Share (%), by Country 2024 & 2032
- Figure 22: South America Parkinson's Disease Therapeutics Industry Volume Share (%), by Country 2024 & 2032
- Figure 23: North America Parkinson's Disease Therapeutics Industry Revenue (Million), by Mechanism of Action 2024 & 2032
- Figure 24: North America Parkinson's Disease Therapeutics Industry Volume (K Unit), by Mechanism of Action 2024 & 2032
- Figure 25: North America Parkinson's Disease Therapeutics Industry Revenue Share (%), by Mechanism of Action 2024 & 2032
- Figure 26: North America Parkinson's Disease Therapeutics Industry Volume Share (%), by Mechanism of Action 2024 & 2032
- Figure 27: North America Parkinson's Disease Therapeutics Industry Revenue (Million), by Country 2024 & 2032
- Figure 28: North America Parkinson's Disease Therapeutics Industry Volume (K Unit), by Country 2024 & 2032
- Figure 29: North America Parkinson's Disease Therapeutics Industry Revenue Share (%), by Country 2024 & 2032
- Figure 30: North America Parkinson's Disease Therapeutics Industry Volume Share (%), by Country 2024 & 2032
- Figure 31: Europe Parkinson's Disease Therapeutics Industry Revenue (Million), by Mechanism of Action 2024 & 2032
- Figure 32: Europe Parkinson's Disease Therapeutics Industry Volume (K Unit), by Mechanism of Action 2024 & 2032
- Figure 33: Europe Parkinson's Disease Therapeutics Industry Revenue Share (%), by Mechanism of Action 2024 & 2032
- Figure 34: Europe Parkinson's Disease Therapeutics Industry Volume Share (%), by Mechanism of Action 2024 & 2032
- Figure 35: Europe Parkinson's Disease Therapeutics Industry Revenue (Million), by Country 2024 & 2032
- Figure 36: Europe Parkinson's Disease Therapeutics Industry Volume (K Unit), by Country 2024 & 2032
- Figure 37: Europe Parkinson's Disease Therapeutics Industry Revenue Share (%), by Country 2024 & 2032
- Figure 38: Europe Parkinson's Disease Therapeutics Industry Volume Share (%), by Country 2024 & 2032
- Figure 39: Asia Pacific Parkinson's Disease Therapeutics Industry Revenue (Million), by Mechanism of Action 2024 & 2032
- Figure 40: Asia Pacific Parkinson's Disease Therapeutics Industry Volume (K Unit), by Mechanism of Action 2024 & 2032
- Figure 41: Asia Pacific Parkinson's Disease Therapeutics Industry Revenue Share (%), by Mechanism of Action 2024 & 2032
- Figure 42: Asia Pacific Parkinson's Disease Therapeutics Industry Volume Share (%), by Mechanism of Action 2024 & 2032
- Figure 43: Asia Pacific Parkinson's Disease Therapeutics Industry Revenue (Million), by Country 2024 & 2032
- Figure 44: Asia Pacific Parkinson's Disease Therapeutics Industry Volume (K Unit), by Country 2024 & 2032
- Figure 45: Asia Pacific Parkinson's Disease Therapeutics Industry Revenue Share (%), by Country 2024 & 2032
- Figure 46: Asia Pacific Parkinson's Disease Therapeutics Industry Volume Share (%), by Country 2024 & 2032
- Figure 47: Middle East and Africa Parkinson's Disease Therapeutics Industry Revenue (Million), by Mechanism of Action 2024 & 2032
- Figure 48: Middle East and Africa Parkinson's Disease Therapeutics Industry Volume (K Unit), by Mechanism of Action 2024 & 2032
- Figure 49: Middle East and Africa Parkinson's Disease Therapeutics Industry Revenue Share (%), by Mechanism of Action 2024 & 2032
- Figure 50: Middle East and Africa Parkinson's Disease Therapeutics Industry Volume Share (%), by Mechanism of Action 2024 & 2032
- Figure 51: Middle East and Africa Parkinson's Disease Therapeutics Industry Revenue (Million), by Country 2024 & 2032
- Figure 52: Middle East and Africa Parkinson's Disease Therapeutics Industry Volume (K Unit), by Country 2024 & 2032
- Figure 53: Middle East and Africa Parkinson's Disease Therapeutics Industry Revenue Share (%), by Country 2024 & 2032
- Figure 54: Middle East and Africa Parkinson's Disease Therapeutics Industry Volume Share (%), by Country 2024 & 2032
- Figure 55: South America Parkinson's Disease Therapeutics Industry Revenue (Million), by Mechanism of Action 2024 & 2032
- Figure 56: South America Parkinson's Disease Therapeutics Industry Volume (K Unit), by Mechanism of Action 2024 & 2032
- Figure 57: South America Parkinson's Disease Therapeutics Industry Revenue Share (%), by Mechanism of Action 2024 & 2032
- Figure 58: South America Parkinson's Disease Therapeutics Industry Volume Share (%), by Mechanism of Action 2024 & 2032
- Figure 59: South America Parkinson's Disease Therapeutics Industry Revenue (Million), by Country 2024 & 2032
- Figure 60: South America Parkinson's Disease Therapeutics Industry Volume (K Unit), by Country 2024 & 2032
- Figure 61: South America Parkinson's Disease Therapeutics Industry Revenue Share (%), by Country 2024 & 2032
- Figure 62: South America Parkinson's Disease Therapeutics Industry Volume Share (%), by Country 2024 & 2032
List of Tables
- Table 1: Global Parkinson's Disease Therapeutics Industry Revenue Million Forecast, by Region 2019 & 2032
- Table 2: Global Parkinson's Disease Therapeutics Industry Volume K Unit Forecast, by Region 2019 & 2032
- Table 3: Global Parkinson's Disease Therapeutics Industry Revenue Million Forecast, by Mechanism of Action 2019 & 2032
- Table 4: Global Parkinson's Disease Therapeutics Industry Volume K Unit Forecast, by Mechanism of Action 2019 & 2032
- Table 5: Global Parkinson's Disease Therapeutics Industry Revenue Million Forecast, by Region 2019 & 2032
- Table 6: Global Parkinson's Disease Therapeutics Industry Volume K Unit Forecast, by Region 2019 & 2032
- Table 7: Global Parkinson's Disease Therapeutics Industry Revenue Million Forecast, by Country 2019 & 2032
- Table 8: Global Parkinson's Disease Therapeutics Industry Volume K Unit Forecast, by Country 2019 & 2032
- Table 9: United States Parkinson's Disease Therapeutics Industry Revenue (Million) Forecast, by Application 2019 & 2032
- Table 10: United States Parkinson's Disease Therapeutics Industry Volume (K Unit) Forecast, by Application 2019 & 2032
- Table 11: Canada Parkinson's Disease Therapeutics Industry Revenue (Million) Forecast, by Application 2019 & 2032
- Table 12: Canada Parkinson's Disease Therapeutics Industry Volume (K Unit) Forecast, by Application 2019 & 2032
- Table 13: Mexico Parkinson's Disease Therapeutics Industry Revenue (Million) Forecast, by Application 2019 & 2032
- Table 14: Mexico Parkinson's Disease Therapeutics Industry Volume (K Unit) Forecast, by Application 2019 & 2032
- Table 15: Global Parkinson's Disease Therapeutics Industry Revenue Million Forecast, by Country 2019 & 2032
- Table 16: Global Parkinson's Disease Therapeutics Industry Volume K Unit Forecast, by Country 2019 & 2032
- Table 17: Germany Parkinson's Disease Therapeutics Industry Revenue (Million) Forecast, by Application 2019 & 2032
- Table 18: Germany Parkinson's Disease Therapeutics Industry Volume (K Unit) Forecast, by Application 2019 & 2032
- Table 19: United Kingdom Parkinson's Disease Therapeutics Industry Revenue (Million) Forecast, by Application 2019 & 2032
- Table 20: United Kingdom Parkinson's Disease Therapeutics Industry Volume (K Unit) Forecast, by Application 2019 & 2032
- Table 21: France Parkinson's Disease Therapeutics Industry Revenue (Million) Forecast, by Application 2019 & 2032
- Table 22: France Parkinson's Disease Therapeutics Industry Volume (K Unit) Forecast, by Application 2019 & 2032
- Table 23: Italy Parkinson's Disease Therapeutics Industry Revenue (Million) Forecast, by Application 2019 & 2032
- Table 24: Italy Parkinson's Disease Therapeutics Industry Volume (K Unit) Forecast, by Application 2019 & 2032
- Table 25: Spain Parkinson's Disease Therapeutics Industry Revenue (Million) Forecast, by Application 2019 & 2032
- Table 26: Spain Parkinson's Disease Therapeutics Industry Volume (K Unit) Forecast, by Application 2019 & 2032
- Table 27: Rest of Europe Parkinson's Disease Therapeutics Industry Revenue (Million) Forecast, by Application 2019 & 2032
- Table 28: Rest of Europe Parkinson's Disease Therapeutics Industry Volume (K Unit) Forecast, by Application 2019 & 2032
- Table 29: Global Parkinson's Disease Therapeutics Industry Revenue Million Forecast, by Country 2019 & 2032
- Table 30: Global Parkinson's Disease Therapeutics Industry Volume K Unit Forecast, by Country 2019 & 2032
- Table 31: China Parkinson's Disease Therapeutics Industry Revenue (Million) Forecast, by Application 2019 & 2032
- Table 32: China Parkinson's Disease Therapeutics Industry Volume (K Unit) Forecast, by Application 2019 & 2032
- Table 33: Japan Parkinson's Disease Therapeutics Industry Revenue (Million) Forecast, by Application 2019 & 2032
- Table 34: Japan Parkinson's Disease Therapeutics Industry Volume (K Unit) Forecast, by Application 2019 & 2032
- Table 35: India Parkinson's Disease Therapeutics Industry Revenue (Million) Forecast, by Application 2019 & 2032
- Table 36: India Parkinson's Disease Therapeutics Industry Volume (K Unit) Forecast, by Application 2019 & 2032
- Table 37: Australia Parkinson's Disease Therapeutics Industry Revenue (Million) Forecast, by Application 2019 & 2032
- Table 38: Australia Parkinson's Disease Therapeutics Industry Volume (K Unit) Forecast, by Application 2019 & 2032
- Table 39: South Korea Parkinson's Disease Therapeutics Industry Revenue (Million) Forecast, by Application 2019 & 2032
- Table 40: South Korea Parkinson's Disease Therapeutics Industry Volume (K Unit) Forecast, by Application 2019 & 2032
- Table 41: Rest of Asia Pacific Parkinson's Disease Therapeutics Industry Revenue (Million) Forecast, by Application 2019 & 2032
- Table 42: Rest of Asia Pacific Parkinson's Disease Therapeutics Industry Volume (K Unit) Forecast, by Application 2019 & 2032
- Table 43: Global Parkinson's Disease Therapeutics Industry Revenue Million Forecast, by Country 2019 & 2032
- Table 44: Global Parkinson's Disease Therapeutics Industry Volume K Unit Forecast, by Country 2019 & 2032
- Table 45: GCC Parkinson's Disease Therapeutics Industry Revenue (Million) Forecast, by Application 2019 & 2032
- Table 46: GCC Parkinson's Disease Therapeutics Industry Volume (K Unit) Forecast, by Application 2019 & 2032
- Table 47: South Africa Parkinson's Disease Therapeutics Industry Revenue (Million) Forecast, by Application 2019 & 2032
- Table 48: South Africa Parkinson's Disease Therapeutics Industry Volume (K Unit) Forecast, by Application 2019 & 2032
- Table 49: Rest of Middle East and Africa Parkinson's Disease Therapeutics Industry Revenue (Million) Forecast, by Application 2019 & 2032
- Table 50: Rest of Middle East and Africa Parkinson's Disease Therapeutics Industry Volume (K Unit) Forecast, by Application 2019 & 2032
- Table 51: Global Parkinson's Disease Therapeutics Industry Revenue Million Forecast, by Country 2019 & 2032
- Table 52: Global Parkinson's Disease Therapeutics Industry Volume K Unit Forecast, by Country 2019 & 2032
- Table 53: Brazil Parkinson's Disease Therapeutics Industry Revenue (Million) Forecast, by Application 2019 & 2032
- Table 54: Brazil Parkinson's Disease Therapeutics Industry Volume (K Unit) Forecast, by Application 2019 & 2032
- Table 55: Argentina Parkinson's Disease Therapeutics Industry Revenue (Million) Forecast, by Application 2019 & 2032
- Table 56: Argentina Parkinson's Disease Therapeutics Industry Volume (K Unit) Forecast, by Application 2019 & 2032
- Table 57: Rest of South America Parkinson's Disease Therapeutics Industry Revenue (Million) Forecast, by Application 2019 & 2032
- Table 58: Rest of South America Parkinson's Disease Therapeutics Industry Volume (K Unit) Forecast, by Application 2019 & 2032
- Table 59: Global Parkinson's Disease Therapeutics Industry Revenue Million Forecast, by Mechanism of Action 2019 & 2032
- Table 60: Global Parkinson's Disease Therapeutics Industry Volume K Unit Forecast, by Mechanism of Action 2019 & 2032
- Table 61: Global Parkinson's Disease Therapeutics Industry Revenue Million Forecast, by Country 2019 & 2032
- Table 62: Global Parkinson's Disease Therapeutics Industry Volume K Unit Forecast, by Country 2019 & 2032
- Table 63: United States Parkinson's Disease Therapeutics Industry Revenue (Million) Forecast, by Application 2019 & 2032
- Table 64: United States Parkinson's Disease Therapeutics Industry Volume (K Unit) Forecast, by Application 2019 & 2032
- Table 65: Canada Parkinson's Disease Therapeutics Industry Revenue (Million) Forecast, by Application 2019 & 2032
- Table 66: Canada Parkinson's Disease Therapeutics Industry Volume (K Unit) Forecast, by Application 2019 & 2032
- Table 67: Mexico Parkinson's Disease Therapeutics Industry Revenue (Million) Forecast, by Application 2019 & 2032
- Table 68: Mexico Parkinson's Disease Therapeutics Industry Volume (K Unit) Forecast, by Application 2019 & 2032
- Table 69: Global Parkinson's Disease Therapeutics Industry Revenue Million Forecast, by Mechanism of Action 2019 & 2032
- Table 70: Global Parkinson's Disease Therapeutics Industry Volume K Unit Forecast, by Mechanism of Action 2019 & 2032
- Table 71: Global Parkinson's Disease Therapeutics Industry Revenue Million Forecast, by Country 2019 & 2032
- Table 72: Global Parkinson's Disease Therapeutics Industry Volume K Unit Forecast, by Country 2019 & 2032
- Table 73: Germany Parkinson's Disease Therapeutics Industry Revenue (Million) Forecast, by Application 2019 & 2032
- Table 74: Germany Parkinson's Disease Therapeutics Industry Volume (K Unit) Forecast, by Application 2019 & 2032
- Table 75: United Kingdom Parkinson's Disease Therapeutics Industry Revenue (Million) Forecast, by Application 2019 & 2032
- Table 76: United Kingdom Parkinson's Disease Therapeutics Industry Volume (K Unit) Forecast, by Application 2019 & 2032
- Table 77: France Parkinson's Disease Therapeutics Industry Revenue (Million) Forecast, by Application 2019 & 2032
- Table 78: France Parkinson's Disease Therapeutics Industry Volume (K Unit) Forecast, by Application 2019 & 2032
- Table 79: Italy Parkinson's Disease Therapeutics Industry Revenue (Million) Forecast, by Application 2019 & 2032
- Table 80: Italy Parkinson's Disease Therapeutics Industry Volume (K Unit) Forecast, by Application 2019 & 2032
- Table 81: Spain Parkinson's Disease Therapeutics Industry Revenue (Million) Forecast, by Application 2019 & 2032
- Table 82: Spain Parkinson's Disease Therapeutics Industry Volume (K Unit) Forecast, by Application 2019 & 2032
- Table 83: Rest of Europe Parkinson's Disease Therapeutics Industry Revenue (Million) Forecast, by Application 2019 & 2032
- Table 84: Rest of Europe Parkinson's Disease Therapeutics Industry Volume (K Unit) Forecast, by Application 2019 & 2032
- Table 85: Global Parkinson's Disease Therapeutics Industry Revenue Million Forecast, by Mechanism of Action 2019 & 2032
- Table 86: Global Parkinson's Disease Therapeutics Industry Volume K Unit Forecast, by Mechanism of Action 2019 & 2032
- Table 87: Global Parkinson's Disease Therapeutics Industry Revenue Million Forecast, by Country 2019 & 2032
- Table 88: Global Parkinson's Disease Therapeutics Industry Volume K Unit Forecast, by Country 2019 & 2032
- Table 89: China Parkinson's Disease Therapeutics Industry Revenue (Million) Forecast, by Application 2019 & 2032
- Table 90: China Parkinson's Disease Therapeutics Industry Volume (K Unit) Forecast, by Application 2019 & 2032
- Table 91: Japan Parkinson's Disease Therapeutics Industry Revenue (Million) Forecast, by Application 2019 & 2032
- Table 92: Japan Parkinson's Disease Therapeutics Industry Volume (K Unit) Forecast, by Application 2019 & 2032
- Table 93: India Parkinson's Disease Therapeutics Industry Revenue (Million) Forecast, by Application 2019 & 2032
- Table 94: India Parkinson's Disease Therapeutics Industry Volume (K Unit) Forecast, by Application 2019 & 2032
- Table 95: Australia Parkinson's Disease Therapeutics Industry Revenue (Million) Forecast, by Application 2019 & 2032
- Table 96: Australia Parkinson's Disease Therapeutics Industry Volume (K Unit) Forecast, by Application 2019 & 2032
- Table 97: South Korea Parkinson's Disease Therapeutics Industry Revenue (Million) Forecast, by Application 2019 & 2032
- Table 98: South Korea Parkinson's Disease Therapeutics Industry Volume (K Unit) Forecast, by Application 2019 & 2032
- Table 99: Rest of Asia Pacific Parkinson's Disease Therapeutics Industry Revenue (Million) Forecast, by Application 2019 & 2032
- Table 100: Rest of Asia Pacific Parkinson's Disease Therapeutics Industry Volume (K Unit) Forecast, by Application 2019 & 2032
- Table 101: Global Parkinson's Disease Therapeutics Industry Revenue Million Forecast, by Mechanism of Action 2019 & 2032
- Table 102: Global Parkinson's Disease Therapeutics Industry Volume K Unit Forecast, by Mechanism of Action 2019 & 2032
- Table 103: Global Parkinson's Disease Therapeutics Industry Revenue Million Forecast, by Country 2019 & 2032
- Table 104: Global Parkinson's Disease Therapeutics Industry Volume K Unit Forecast, by Country 2019 & 2032
- Table 105: GCC Parkinson's Disease Therapeutics Industry Revenue (Million) Forecast, by Application 2019 & 2032
- Table 106: GCC Parkinson's Disease Therapeutics Industry Volume (K Unit) Forecast, by Application 2019 & 2032
- Table 107: South Africa Parkinson's Disease Therapeutics Industry Revenue (Million) Forecast, by Application 2019 & 2032
- Table 108: South Africa Parkinson's Disease Therapeutics Industry Volume (K Unit) Forecast, by Application 2019 & 2032
- Table 109: Rest of Middle East and Africa Parkinson's Disease Therapeutics Industry Revenue (Million) Forecast, by Application 2019 & 2032
- Table 110: Rest of Middle East and Africa Parkinson's Disease Therapeutics Industry Volume (K Unit) Forecast, by Application 2019 & 2032
- Table 111: Global Parkinson's Disease Therapeutics Industry Revenue Million Forecast, by Mechanism of Action 2019 & 2032
- Table 112: Global Parkinson's Disease Therapeutics Industry Volume K Unit Forecast, by Mechanism of Action 2019 & 2032
- Table 113: Global Parkinson's Disease Therapeutics Industry Revenue Million Forecast, by Country 2019 & 2032
- Table 114: Global Parkinson's Disease Therapeutics Industry Volume K Unit Forecast, by Country 2019 & 2032
- Table 115: Brazil Parkinson's Disease Therapeutics Industry Revenue (Million) Forecast, by Application 2019 & 2032
- Table 116: Brazil Parkinson's Disease Therapeutics Industry Volume (K Unit) Forecast, by Application 2019 & 2032
- Table 117: Argentina Parkinson's Disease Therapeutics Industry Revenue (Million) Forecast, by Application 2019 & 2032
- Table 118: Argentina Parkinson's Disease Therapeutics Industry Volume (K Unit) Forecast, by Application 2019 & 2032
- Table 119: Rest of South America Parkinson's Disease Therapeutics Industry Revenue (Million) Forecast, by Application 2019 & 2032
- Table 120: Rest of South America Parkinson's Disease Therapeutics Industry Volume (K Unit) Forecast, by Application 2019 & 2032
Frequently Asked Questions
1. What is the projected Compound Annual Growth Rate (CAGR) of the Parkinson's Disease Therapeutics Industry?
The projected CAGR is approximately 3.58%.
2. Which companies are prominent players in the Parkinson's Disease Therapeutics Industry?
Key companies in the market include Boehringer Ingelheim International GmbH, Novartis AG, F Hoffmann-La Roche Ltd, ABL bio, AstraZeneca, Teva Pharmaceuticals Industries Ltd, Prevail Therapeutics, Kissei Pharmaceutical Co Ltd, Newron Pharmaceuticals SPA, Viatris, AbbVie Inc, GSK plc, Amneal Pharmaceuticals LLC, Pfizer Inc.
3. What are the main segments of the Parkinson's Disease Therapeutics Industry?
The market segments include Mechanism of Action.
4. Can you provide details about the market size?
The market size is estimated to be USD 5.56 Million as of 2022.
5. What are some drivers contributing to market growth?
Rising Geriatric Population and Burden of Parkinson's Disease; Growing Awareness Among the Population; Increasing R&D and Continuous Drug Approvals.
6. What are the notable trends driving market growth?
MAO-B inhibitors Segment is Expected to Dominate the Market Over the Forecast Period.
7. Are there any restraints impacting market growth?
Adverse Events Associated with Therapeutics; High Cost of Treatments Followed by Extremely High R&D Expenditure.
8. Can you provide examples of recent developments in the market?
In March 2022, Neuron23 raised USD 100 million to advance Parkinson's disease therapy. The company intends to commence the trials of NEU-723 to potentially treat Parkinson's disease by the end of this year.
9. What pricing options are available for accessing the report?
Pricing options include single-user, multi-user, and enterprise licenses priced at USD 4750, USD 5250, and USD 8750 respectively.
10. Is the market size provided in terms of value or volume?
The market size is provided in terms of value, measured in Million and volume, measured in K Unit.
11. Are there any specific market keywords associated with the report?
Yes, the market keyword associated with the report is "Parkinson's Disease Therapeutics Industry," which aids in identifying and referencing the specific market segment covered.
12. How do I determine which pricing option suits my needs best?
The pricing options vary based on user requirements and access needs. Individual users may opt for single-user licenses, while businesses requiring broader access may choose multi-user or enterprise licenses for cost-effective access to the report.
13. Are there any additional resources or data provided in the Parkinson's Disease Therapeutics Industry report?
While the report offers comprehensive insights, it's advisable to review the specific contents or supplementary materials provided to ascertain if additional resources or data are available.
14. How can I stay updated on further developments or reports in the Parkinson's Disease Therapeutics Industry?
To stay informed about further developments, trends, and reports in the Parkinson's Disease Therapeutics Industry, consider subscribing to industry newsletters, following relevant companies and organizations, or regularly checking reputable industry news sources and publications.
Methodology
Step 1 - Identification of Relevant Samples Size from Population Database


Step 2 - Approaches for Defining Global Market Size (Value, Volume* & Price*)

Note*: In applicable scenarios
Step 3 - Data Sources
Primary Research
- Web Analytics
- Survey Reports
- Research Institute
- Latest Research Reports
- Opinion Leaders
Secondary Research
- Annual Reports
- White Paper
- Latest Press Release
- Industry Association
- Paid Database
- Investor Presentations

Step 4 - Data Triangulation
Involves using different sources of information in order to increase the validity of a study
These sources are likely to be stakeholders in a program - participants, other researchers, program staff, other community members, and so on.
Then we put all data in single framework & apply various statistical tools to find out the dynamic on the market.
During the analysis stage, feedback from the stakeholder groups would be compared to determine areas of agreement as well as areas of divergence
