

Key Insights
The North America Real Estate Brokerage Market is poised for steady expansion, projected to reach $227.08 million by 2025, with a Compound Annual Growth Rate (CAGR) of 2.30% anticipated over the forecast period of 2025-2033. This growth is primarily fueled by a sustained demand for housing and commercial spaces across the United States, Canada, and Mexico. Key drivers include urbanization, demographic shifts, and ongoing investment in real estate development. The market's resilience is further bolstered by the dynamic interplay of sales and rental services, catering to diverse client needs from first-time homebuyers to seasoned investors. Residential properties continue to dominate the market landscape, driven by a strong desire for homeownership and evolving lifestyle preferences. Concurrently, the non-residential sector is experiencing a resurgence, supported by increased business expansion and commercial real estate transactions.
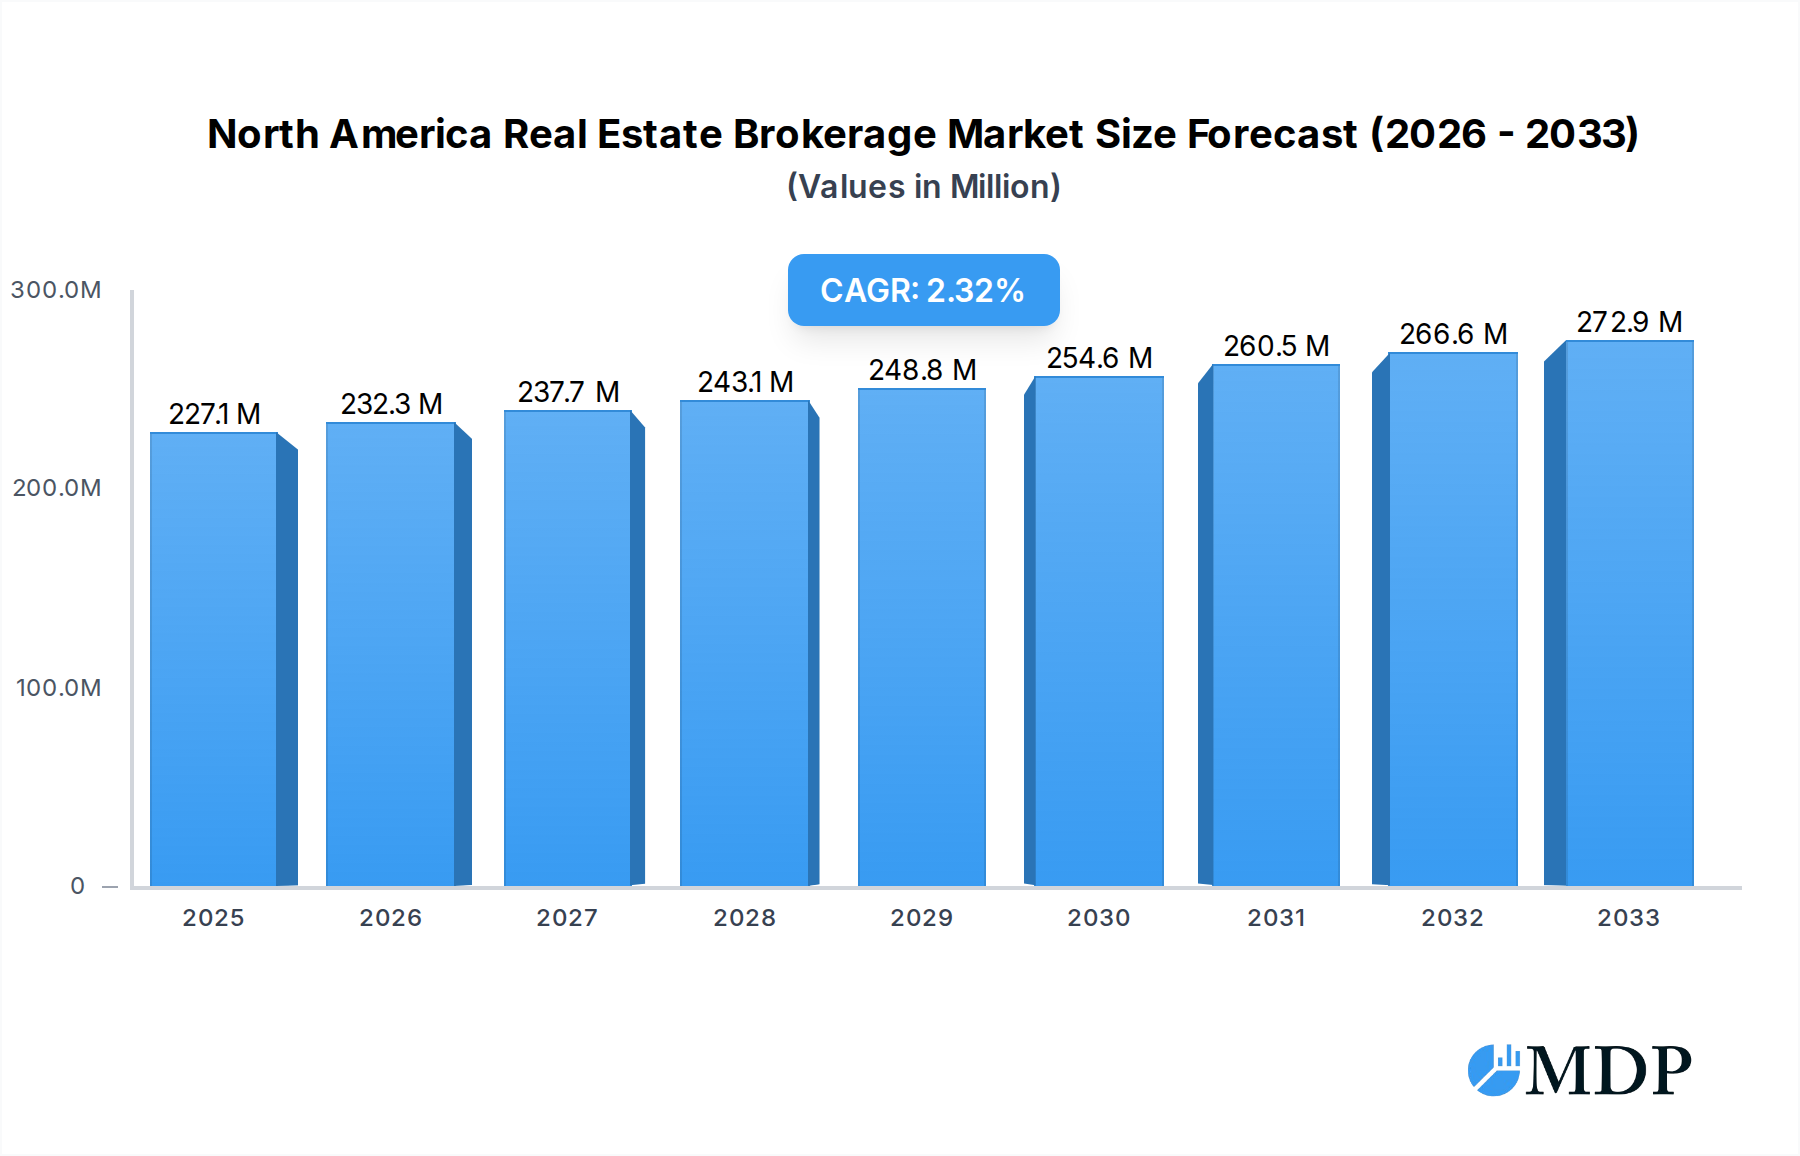
North America Real Estate Brokerage Market Market Size (In Million)
Despite the overall positive outlook, the market faces certain restraints, including rising interest rates, fluctuating economic conditions, and evolving regulatory frameworks that can impact transaction volumes and property values. However, emerging trends such as the increasing adoption of technology in real estate, including virtual tours, AI-powered property matching, and streamlined digital transaction processes, are expected to mitigate these challenges and enhance efficiency. The brokerage segment itself is witnessing a trend towards consolidation and specialization, with established players like Keller Williams Realty, RE/MAX, and Coldwell Banker Real Estate adapting to the digital age while new entrants like Compass push innovation. The North American region, encompassing the United States, Canada, and Mexico, remains the focal point of this market, with each country presenting unique opportunities and challenges influenced by local economic policies and consumer behavior.

North America Real Estate Brokerage Market Company Market Share
Unlock the Future of North American Real Estate: A Comprehensive Market Report
This in-depth report offers a pivotal analysis of the North America Real Estate Brokerage Market, a dynamic sector poised for significant evolution. Covering the historical period from 2019 to 2024 and projecting growth through 2033, with a base and estimated year of 2025, this report provides unparalleled insights into market dynamics, industry trends, leading segments, product developments, growth drivers, challenges, and emerging opportunities. Leveraging high-traffic keywords such as "real estate brokerage," "residential real estate," "commercial real estate," "housing market," "property sales," "rental market," "real estate technology," and "real estate investment," this report is essential for real estate professionals, investors, policymakers, and technology providers seeking a competitive edge. We meticulously dissect market concentration, regulatory frameworks, innovation drivers, and M&A activities, offering actionable intelligence to navigate this complex landscape. Dive deep into the U.S. real estate market, Canadian real estate trends, and Mexico's evolving property sector, understanding the forces shaping residential and non-residential segments, and the critical roles of sales and rental services.
North America Real Estate Brokerage Market Market Dynamics & Concentration
The North America real estate brokerage market, valued at over $350 Billion in 2025, exhibits a moderate to high concentration, with established national and international players dominating significant market shares. Key players like Keller Williams Realty, RE/MAX, and Coldwell Banker Real Estate hold substantial portions of the market, driving innovation and setting industry standards. The market is characterized by a continuous pursuit of technological advancements, including AI-powered property matching, virtual tours, and blockchain for transaction security, which act as critical innovation drivers. Regulatory frameworks, while varying by jurisdiction, generally focus on agent licensing, fair housing laws, and transaction transparency. Product substitutes, such as For Sale By Owner (FSBO) platforms and direct sales models, pose a competitive threat, yet the personalized service and market expertise of brokerages remain a strong differentiator. End-user trends indicate a growing demand for digital tools, personalized service, and a preference for agents with strong online presence and local market knowledge. Mergers and acquisitions (M&A) activity remains robust, with an estimated 250+ significant M&A deals in the historical period (2019-2024), aimed at market consolidation, geographic expansion, and technology acquisition. For instance, Compass' acquisition of Latter & Blum underscores this trend, enhancing its market share in key regions. The ongoing expansion of Real Brokerage Inc., surpassing 19,000 agents, signals a shift towards agent-centric models and technology-driven recruitment strategies.
North America Real Estate Brokerage Market Industry Trends & Analysis
The North America real estate brokerage market is experiencing a steady growth trajectory, projected to grow at a Compound Annual Growth Rate (CAGR) of approximately 5.8% from 2025 to 2033. This expansion is fueled by a confluence of factors, including a resilient housing demand, particularly in suburban and emerging urban areas, and a sustained need for professional real estate services. Technological disruptions are fundamentally reshaping the industry. The integration of Artificial Intelligence (AI) for lead generation and predictive analytics, the proliferation of Virtual Reality (VR) and Augmented Reality (AR) for immersive property tours, and the increasing adoption of sophisticated Customer Relationship Management (CRM) systems are enhancing efficiency and client engagement. Consumer preferences are evolving; buyers and sellers increasingly expect seamless digital experiences, transparent communication, and data-driven insights from their agents. This has led to a rise in tech-forward brokerages and a demand for agents proficient in digital marketing and online collaboration tools. Competitive dynamics are intensifying, with a discernible bifurcation between large, well-capitalized firms and a growing number of agile, technology-focused independent brokerages. Market penetration for digital real estate platforms continues to climb, pushing traditional brokerages to innovate and adapt their service models. Furthermore, the increasing prevalence of remote work has broadened geographical considerations for homebuyers, driving demand in previously less sought-after locations and creating new opportunities for brokerages with a broad geographic reach. The historical period saw significant investment in proptech solutions, a trend expected to accelerate, further differentiating market leaders.
Leading Markets & Segments in North America Real Estate Brokerage Market
The United States stands as the dominant market within the North America real estate brokerage sector, representing over 70% of the total market value in 2025, projected to exceed $250 Billion. This dominance is driven by its large population, robust economy, and diverse real estate landscape. Key drivers for the U.S. market include favorable economic policies, particularly interest rate stability, strong consumer confidence, and ongoing infrastructure development in key metropolitan and suburban areas.
- Residential Segment: This segment, accounting for approximately 75% of the market share, is the largest and most influential.
- Key Drivers: Increasing millennial homeownership, demand for single-family homes, and evolving lifestyle preferences.
- Dominance Analysis: The U.S. residential market benefits from a large and relatively stable population, with a consistent demand for home purchases and sales. The availability of financing options and the perceived long-term value of real estate investments contribute to its strength.
- Non-Residential Segment: This segment, encompassing commercial, industrial, and retail properties, holds the remaining 25% market share.
- Key Drivers: Economic growth, business expansion, and evolving retail and industrial needs.
- Dominance Analysis: While smaller than residential, the U.S. commercial real estate market is extensive, driven by a vibrant business ecosystem. However, shifts towards e-commerce have impacted retail spaces, while logistics and industrial sectors continue to show strong performance.
Canada represents the second-largest market, with an estimated market value of over $60 Billion in 2025.
- Key Drivers: Stable economic growth, increasing urbanization, and a growing population.
- Dominance Analysis: Canada's real estate market is primarily driven by its major urban centers, such as Toronto, Vancouver, and Montreal, which exhibit high property values and demand. Government policies aimed at housing affordability and immigration also play a significant role.
Mexico is an emerging market with substantial growth potential, projected to reach over $30 Billion by 2025.
- Key Drivers: Foreign investment, tourism-driven property markets, and a growing middle class.
- Dominance Analysis: Mexico's real estate attractiveness is bolstered by its appealing tourism destinations and increasingly favorable foreign investment policies. The growth of its middle class is also contributing to increased demand for both residential and commercial properties.
Across all geographies, the Sales Service segment significantly outweighs the Rental Service segment, accounting for roughly 80% of the market value. This is due to the higher transaction values associated with property sales compared to rental agreements. However, the rental market, especially in major urban centers, remains a substantial and growing sector, driven by affordability concerns and transient populations.
North America Real Estate Brokerage Market Product Developments
Product developments in the North America real estate brokerage market are heavily influenced by technological innovation. We are witnessing the emergence of advanced AI-powered platforms for property valuation and market analysis, offering hyper-localized insights to agents and clients. Virtual staging and immersive 3D tours are becoming standard, enhancing the online viewing experience and broadening market reach for properties. Furthermore, integrated CRM systems and digital transaction management tools are streamlining the brokerage process, improving efficiency and client satisfaction. The competitive advantage lies in brokerages that can effectively leverage these technologies to offer superior service, data-driven advice, and a seamless client journey, thus differentiating themselves in an increasingly competitive market.
Key Drivers of North America Real Estate Brokerage Market Growth
Several key factors are propelling the growth of the North America real estate brokerage market. Technologically, the ongoing digital transformation, including AI-driven analytics and virtual tour technologies, is enhancing efficiency and client engagement. Economically, steady employment rates, increasing disposable incomes, and favorable mortgage rates in certain regions contribute to robust housing demand. Regulatory frameworks, particularly those encouraging foreign investment and streamlining property transactions, also play a crucial role. The persistent demand for both residential and non-residential properties, coupled with the inherent value placed on professional brokerage services for navigating complex transactions, provides a strong foundation for sustained market expansion.
Challenges in the North America Real Estate Brokerage Market Market
Despite its growth, the North America real estate brokerage market faces several challenges. Regulatory hurdles, including varying licensing requirements and evolving compliance standards across different states and provinces, can create complexities for multi-jurisdictional operations. Supply chain issues, though less direct than in manufacturing, can impact development timelines and construction costs, indirectly affecting the broader real estate market and transaction volumes. Intense competitive pressures from both established giants and nimble disruptors, including online platforms and discount brokerages, necessitate continuous innovation and cost-efficiency. Furthermore, economic downturns or significant shifts in interest rates can dampen buyer sentiment and transaction activity, impacting brokerage revenues.
Emerging Opportunities in North America Real Estate Brokerage Market
Emerging opportunities within the North America real estate brokerage market are vast and multifaceted. Technological breakthroughs in PropTech, such as blockchain for secure and transparent transactions and AI for personalized client experiences, offer significant potential for differentiation and efficiency gains. Strategic partnerships between traditional brokerages and technology firms are becoming increasingly common, creating synergistic growth avenues. Market expansion strategies, including venturing into underserviced suburban or rural markets and capitalizing on the growing demand for short-term and long-term rental management services, present further avenues for revenue diversification. The increasing interest in sustainable and green real estate also opens new niche markets for specialized brokerages.
Leading Players in the North America Real Estate Brokerage Market Sector
- Keller Williams Realty
- RE/MAX
- Coldwell Banker Real Estate
- Berkshire Hathaway HomeServices
- Century 21 Real Estate
- Sotheby's International Realty
- ERA Real Estate
- Corcoran Group
- Compass
- Douglas Elliman Real Estate
- Real Brokerage Inc.
- Exp Realty
- Weichert, Realtors
- HomeServices of America
(List Not Exhaustive)
Key Milestones in North America Real Estate Brokerage Market Industry
- June 2024: Real Brokerage Inc. reported a significant expansion, surpassing 19,000 agents. This milestone highlights the company's status as North America's fastest-growing publicly traded real estate brokerage, driven by effective recruitment strategies and a compelling agent value proposition.
- April 2024: Compass finalized its acquisition of Latter & Blum, a prominent brokerage firm based in New Orleans. This strategic move significantly bolstered Compass' market share in New Orleans, estimated at around 15%, and solidified its presence in the Gulf Coast region, demonstrating a continued trend of consolidation and market share expansion through M&A.
- 2023: Widespread adoption of AI-powered lead generation tools and predictive analytics by major brokerages to enhance client targeting and conversion rates.
- 2022: Increased investment in virtual reality (VR) and augmented reality (AR) technologies for immersive property tours, responding to evolving consumer preferences for digital engagement.
- 2021: A surge in M&A activity focused on acquiring PropTech startups that offer innovative solutions for property management and transaction facilitation.
Strategic Outlook for North America Real Estate Brokerage Market Market
The strategic outlook for the North America real estate brokerage market is characterized by sustained growth and transformative innovation. Key accelerators include the continued integration of advanced technologies like AI and VR to enhance service delivery and operational efficiency. Brokerages that can effectively leverage data analytics to provide personalized client experiences and optimize marketing strategies will gain a competitive advantage. Strategic partnerships, particularly with FinTech and PropTech companies, will unlock new revenue streams and service offerings. Furthermore, expansion into underserved geographic regions and diversification into specialized market segments, such as luxury, eco-friendly, or investment properties, will be crucial for long-term success and market leadership in the evolving real estate landscape.
North America Real Estate Brokerage Market Segmentation
-
1. Type
- 1.1. Residential
- 1.2. Non-Residential
-
2. Service
- 2.1. Sales
- 2.2. Rental
-
3. Geography
- 3.1. United States
- 3.2. Canada
- 3.3. Mexico
North America Real Estate Brokerage Market Segmentation By Geography
- 1. United States
- 2. Canada
- 3. Mexico
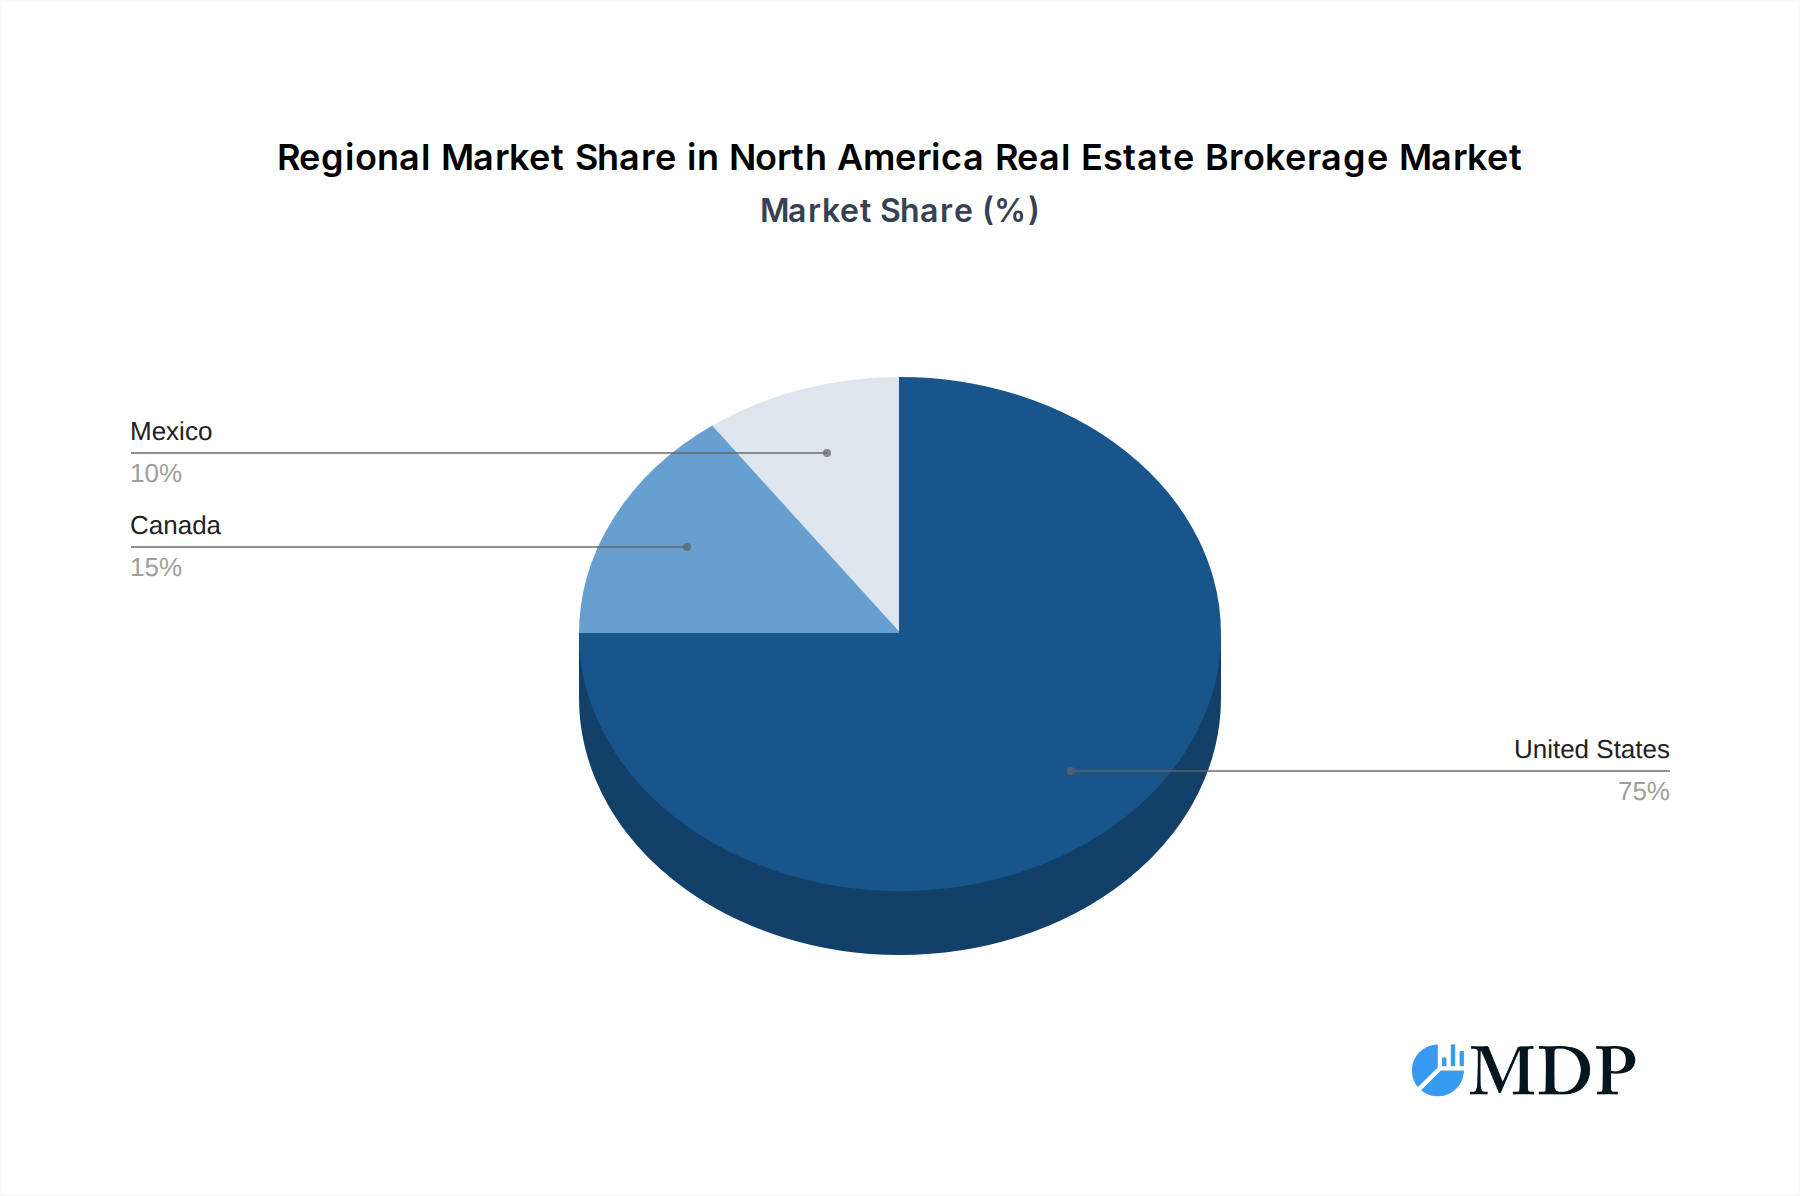
North America Real Estate Brokerage Market Regional Market Share
Geographic Coverage of North America Real Estate Brokerage Market
North America Real Estate Brokerage Market REPORT HIGHLIGHTS
| Aspects | Details |
|---|---|
| Study Period | 2020-2034 |
| Base Year | 2025 |
| Estimated Year | 2026 |
| Forecast Period | 2026-2034 |
| Historical Period | 2020-2025 |
| Growth Rate | CAGR of 2.30% from 2020-2034 |
| Segmentation |
|
Table of Contents
- 1. Introduction
- 1.1. Research Scope
- 1.2. Market Segmentation
- 1.3. Research Objective
- 1.4. Definitions and Assumptions
- 2. Executive Summary
- 2.1. Market Snapshot
- 3. Market Dynamics
- 3.1. Market Drivers
- 3.2. Market Restrains
- 3.3. Market Trends
- 3.4. Market Opportunities
- 4. Market Factor Analysis
- 4.1. Porters Five Forces
- 4.1.1. Bargaining Power of Suppliers
- 4.1.2. Bargaining Power of Buyers
- 4.1.3. Threat of New Entrants
- 4.1.4. Threat of Substitutes
- 4.1.5. Competitive Rivalry
- 4.2. PESTEL analysis
- 4.3. BCG Analysis
- 4.3.1. Stars (High Growth, High Market Share)
- 4.3.2. Cash Cows (Low Growth, High Market Share)
- 4.3.3. Question Mark (High Growth, Low Market Share)
- 4.3.4. Dogs (Low Growth, Low Market Share)
- 4.4. Ansoff Matrix Analysis
- 4.5. Supply Chain Analysis
- 4.6. Regulatory Landscape
- 4.7. Current Market Potential and Opportunity Assessment (TAM–SAM–SOM Framework)
- 4.8. MDP Analyst Note
- 4.1. Porters Five Forces
- 5. Market Analysis, Insights and Forecast 2021-2033
- 5.1. Market Analysis, Insights and Forecast - by Type
- 5.1.1. Residential
- 5.1.2. Non-Residential
- 5.2. Market Analysis, Insights and Forecast - by Service
- 5.2.1. Sales
- 5.2.2. Rental
- 5.3. Market Analysis, Insights and Forecast - by Geography
- 5.3.1. United States
- 5.3.2. Canada
- 5.3.3. Mexico
- 5.4. Market Analysis, Insights and Forecast - by Region
- 5.4.1. United States
- 5.4.2. Canada
- 5.4.3. Mexico
- 5.1. Market Analysis, Insights and Forecast - by Type
- 6. Global North America Real Estate Brokerage Market Analysis, Insights and Forecast, 2021-2033
- 6.1. Market Analysis, Insights and Forecast - by Type
- 6.1.1. Residential
- 6.1.2. Non-Residential
- 6.2. Market Analysis, Insights and Forecast - by Service
- 6.2.1. Sales
- 6.2.2. Rental
- 6.3. Market Analysis, Insights and Forecast - by Geography
- 6.3.1. United States
- 6.3.2. Canada
- 6.3.3. Mexico
- 6.1. Market Analysis, Insights and Forecast - by Type
- 7. United States North America Real Estate Brokerage Market Analysis, Insights and Forecast, 2020-2032
- 7.1. Market Analysis, Insights and Forecast - by Type
- 7.1.1. Residential
- 7.1.2. Non-Residential
- 7.2. Market Analysis, Insights and Forecast - by Service
- 7.2.1. Sales
- 7.2.2. Rental
- 7.3. Market Analysis, Insights and Forecast - by Geography
- 7.3.1. United States
- 7.3.2. Canada
- 7.3.3. Mexico
- 7.1. Market Analysis, Insights and Forecast - by Type
- 8. Canada North America Real Estate Brokerage Market Analysis, Insights and Forecast, 2020-2032
- 8.1. Market Analysis, Insights and Forecast - by Type
- 8.1.1. Residential
- 8.1.2. Non-Residential
- 8.2. Market Analysis, Insights and Forecast - by Service
- 8.2.1. Sales
- 8.2.2. Rental
- 8.3. Market Analysis, Insights and Forecast - by Geography
- 8.3.1. United States
- 8.3.2. Canada
- 8.3.3. Mexico
- 8.1. Market Analysis, Insights and Forecast - by Type
- 9. Mexico North America Real Estate Brokerage Market Analysis, Insights and Forecast, 2020-2032
- 9.1. Market Analysis, Insights and Forecast - by Type
- 9.1.1. Residential
- 9.1.2. Non-Residential
- 9.2. Market Analysis, Insights and Forecast - by Service
- 9.2.1. Sales
- 9.2.2. Rental
- 9.3. Market Analysis, Insights and Forecast - by Geography
- 9.3.1. United States
- 9.3.2. Canada
- 9.3.3. Mexico
- 9.1. Market Analysis, Insights and Forecast - by Type
- 10. Competitive Analysis
- 10.1. Company Profiles
- 10.1.1 Keller Williams Realty
- 10.1.1.1. Company Overview
- 10.1.1.2. Products
- 10.1.1.3. Company Financials
- 10.1.1.4. SWOT Analysis
- 10.1.2 RE/MAX
- 10.1.2.1. Company Overview
- 10.1.2.2. Products
- 10.1.2.3. Company Financials
- 10.1.2.4. SWOT Analysis
- 10.1.3 Coldwell Banker Real Estate
- 10.1.3.1. Company Overview
- 10.1.3.2. Products
- 10.1.3.3. Company Financials
- 10.1.3.4. SWOT Analysis
- 10.1.4 Berkshire Hathaway HomeServices
- 10.1.4.1. Company Overview
- 10.1.4.2. Products
- 10.1.4.3. Company Financials
- 10.1.4.4. SWOT Analysis
- 10.1.5 Century 21 Real Estate
- 10.1.5.1. Company Overview
- 10.1.5.2. Products
- 10.1.5.3. Company Financials
- 10.1.5.4. SWOT Analysis
- 10.1.6 Sotheby's International Realty
- 10.1.6.1. Company Overview
- 10.1.6.2. Products
- 10.1.6.3. Company Financials
- 10.1.6.4. SWOT Analysis
- 10.1.7 ERA Real Estate
- 10.1.7.1. Company Overview
- 10.1.7.2. Products
- 10.1.7.3. Company Financials
- 10.1.7.4. SWOT Analysis
- 10.1.8 Corcoran Group
- 10.1.8.1. Company Overview
- 10.1.8.2. Products
- 10.1.8.3. Company Financials
- 10.1.8.4. SWOT Analysis
- 10.1.9 Compass
- 10.1.9.1. Company Overview
- 10.1.9.2. Products
- 10.1.9.3. Company Financials
- 10.1.9.4. SWOT Analysis
- 10.1.10 Douglas Elliman Real Estate**List Not Exhaustive 6 3 Other Companie
- 10.1.10.1. Company Overview
- 10.1.10.2. Products
- 10.1.10.3. Company Financials
- 10.1.10.4. SWOT Analysis
- 10.1.1 Keller Williams Realty
- 10.2. Market Entropy
- 10.2.1 Company's Key Areas Served
- 10.2.2 Recent Developments
- 10.3. Company Market Share Analysis 2025
- 10.3.1 Top 5 Companies Market Share Analysis
- 10.3.2 Top 3 Companies Market Share Analysis
- 10.4. List of Potential Customers
- 11. Research Methodology
List of Figures
- Figure 1: Global North America Real Estate Brokerage Market Revenue Breakdown (Million, %) by Region 2025 & 2033
- Figure 2: Global North America Real Estate Brokerage Market Volume Breakdown (Billion, %) by Region 2025 & 2033
- Figure 3: United States North America Real Estate Brokerage Market Revenue (Million), by Type 2025 & 2033
- Figure 4: United States North America Real Estate Brokerage Market Volume (Billion), by Type 2025 & 2033
- Figure 5: United States North America Real Estate Brokerage Market Revenue Share (%), by Type 2025 & 2033
- Figure 6: United States North America Real Estate Brokerage Market Volume Share (%), by Type 2025 & 2033
- Figure 7: United States North America Real Estate Brokerage Market Revenue (Million), by Service 2025 & 2033
- Figure 8: United States North America Real Estate Brokerage Market Volume (Billion), by Service 2025 & 2033
- Figure 9: United States North America Real Estate Brokerage Market Revenue Share (%), by Service 2025 & 2033
- Figure 10: United States North America Real Estate Brokerage Market Volume Share (%), by Service 2025 & 2033
- Figure 11: United States North America Real Estate Brokerage Market Revenue (Million), by Geography 2025 & 2033
- Figure 12: United States North America Real Estate Brokerage Market Volume (Billion), by Geography 2025 & 2033
- Figure 13: United States North America Real Estate Brokerage Market Revenue Share (%), by Geography 2025 & 2033
- Figure 14: United States North America Real Estate Brokerage Market Volume Share (%), by Geography 2025 & 2033
- Figure 15: United States North America Real Estate Brokerage Market Revenue (Million), by Country 2025 & 2033
- Figure 16: United States North America Real Estate Brokerage Market Volume (Billion), by Country 2025 & 2033
- Figure 17: United States North America Real Estate Brokerage Market Revenue Share (%), by Country 2025 & 2033
- Figure 18: United States North America Real Estate Brokerage Market Volume Share (%), by Country 2025 & 2033
- Figure 19: Canada North America Real Estate Brokerage Market Revenue (Million), by Type 2025 & 2033
- Figure 20: Canada North America Real Estate Brokerage Market Volume (Billion), by Type 2025 & 2033
- Figure 21: Canada North America Real Estate Brokerage Market Revenue Share (%), by Type 2025 & 2033
- Figure 22: Canada North America Real Estate Brokerage Market Volume Share (%), by Type 2025 & 2033
- Figure 23: Canada North America Real Estate Brokerage Market Revenue (Million), by Service 2025 & 2033
- Figure 24: Canada North America Real Estate Brokerage Market Volume (Billion), by Service 2025 & 2033
- Figure 25: Canada North America Real Estate Brokerage Market Revenue Share (%), by Service 2025 & 2033
- Figure 26: Canada North America Real Estate Brokerage Market Volume Share (%), by Service 2025 & 2033
- Figure 27: Canada North America Real Estate Brokerage Market Revenue (Million), by Geography 2025 & 2033
- Figure 28: Canada North America Real Estate Brokerage Market Volume (Billion), by Geography 2025 & 2033
- Figure 29: Canada North America Real Estate Brokerage Market Revenue Share (%), by Geography 2025 & 2033
- Figure 30: Canada North America Real Estate Brokerage Market Volume Share (%), by Geography 2025 & 2033
- Figure 31: Canada North America Real Estate Brokerage Market Revenue (Million), by Country 2025 & 2033
- Figure 32: Canada North America Real Estate Brokerage Market Volume (Billion), by Country 2025 & 2033
- Figure 33: Canada North America Real Estate Brokerage Market Revenue Share (%), by Country 2025 & 2033
- Figure 34: Canada North America Real Estate Brokerage Market Volume Share (%), by Country 2025 & 2033
- Figure 35: Mexico North America Real Estate Brokerage Market Revenue (Million), by Type 2025 & 2033
- Figure 36: Mexico North America Real Estate Brokerage Market Volume (Billion), by Type 2025 & 2033
- Figure 37: Mexico North America Real Estate Brokerage Market Revenue Share (%), by Type 2025 & 2033
- Figure 38: Mexico North America Real Estate Brokerage Market Volume Share (%), by Type 2025 & 2033
- Figure 39: Mexico North America Real Estate Brokerage Market Revenue (Million), by Service 2025 & 2033
- Figure 40: Mexico North America Real Estate Brokerage Market Volume (Billion), by Service 2025 & 2033
- Figure 41: Mexico North America Real Estate Brokerage Market Revenue Share (%), by Service 2025 & 2033
- Figure 42: Mexico North America Real Estate Brokerage Market Volume Share (%), by Service 2025 & 2033
- Figure 43: Mexico North America Real Estate Brokerage Market Revenue (Million), by Geography 2025 & 2033
- Figure 44: Mexico North America Real Estate Brokerage Market Volume (Billion), by Geography 2025 & 2033
- Figure 45: Mexico North America Real Estate Brokerage Market Revenue Share (%), by Geography 2025 & 2033
- Figure 46: Mexico North America Real Estate Brokerage Market Volume Share (%), by Geography 2025 & 2033
- Figure 47: Mexico North America Real Estate Brokerage Market Revenue (Million), by Country 2025 & 2033
- Figure 48: Mexico North America Real Estate Brokerage Market Volume (Billion), by Country 2025 & 2033
- Figure 49: Mexico North America Real Estate Brokerage Market Revenue Share (%), by Country 2025 & 2033
- Figure 50: Mexico North America Real Estate Brokerage Market Volume Share (%), by Country 2025 & 2033
List of Tables
- Table 1: Global North America Real Estate Brokerage Market Revenue Million Forecast, by Type 2020 & 2033
- Table 2: Global North America Real Estate Brokerage Market Volume Billion Forecast, by Type 2020 & 2033
- Table 3: Global North America Real Estate Brokerage Market Revenue Million Forecast, by Service 2020 & 2033
- Table 4: Global North America Real Estate Brokerage Market Volume Billion Forecast, by Service 2020 & 2033
- Table 5: Global North America Real Estate Brokerage Market Revenue Million Forecast, by Geography 2020 & 2033
- Table 6: Global North America Real Estate Brokerage Market Volume Billion Forecast, by Geography 2020 & 2033
- Table 7: Global North America Real Estate Brokerage Market Revenue Million Forecast, by Region 2020 & 2033
- Table 8: Global North America Real Estate Brokerage Market Volume Billion Forecast, by Region 2020 & 2033
- Table 9: Global North America Real Estate Brokerage Market Revenue Million Forecast, by Type 2020 & 2033
- Table 10: Global North America Real Estate Brokerage Market Volume Billion Forecast, by Type 2020 & 2033
- Table 11: Global North America Real Estate Brokerage Market Revenue Million Forecast, by Service 2020 & 2033
- Table 12: Global North America Real Estate Brokerage Market Volume Billion Forecast, by Service 2020 & 2033
- Table 13: Global North America Real Estate Brokerage Market Revenue Million Forecast, by Geography 2020 & 2033
- Table 14: Global North America Real Estate Brokerage Market Volume Billion Forecast, by Geography 2020 & 2033
- Table 15: Global North America Real Estate Brokerage Market Revenue Million Forecast, by Country 2020 & 2033
- Table 16: Global North America Real Estate Brokerage Market Volume Billion Forecast, by Country 2020 & 2033
- Table 17: Global North America Real Estate Brokerage Market Revenue Million Forecast, by Type 2020 & 2033
- Table 18: Global North America Real Estate Brokerage Market Volume Billion Forecast, by Type 2020 & 2033
- Table 19: Global North America Real Estate Brokerage Market Revenue Million Forecast, by Service 2020 & 2033
- Table 20: Global North America Real Estate Brokerage Market Volume Billion Forecast, by Service 2020 & 2033
- Table 21: Global North America Real Estate Brokerage Market Revenue Million Forecast, by Geography 2020 & 2033
- Table 22: Global North America Real Estate Brokerage Market Volume Billion Forecast, by Geography 2020 & 2033
- Table 23: Global North America Real Estate Brokerage Market Revenue Million Forecast, by Country 2020 & 2033
- Table 24: Global North America Real Estate Brokerage Market Volume Billion Forecast, by Country 2020 & 2033
- Table 25: Global North America Real Estate Brokerage Market Revenue Million Forecast, by Type 2020 & 2033
- Table 26: Global North America Real Estate Brokerage Market Volume Billion Forecast, by Type 2020 & 2033
- Table 27: Global North America Real Estate Brokerage Market Revenue Million Forecast, by Service 2020 & 2033
- Table 28: Global North America Real Estate Brokerage Market Volume Billion Forecast, by Service 2020 & 2033
- Table 29: Global North America Real Estate Brokerage Market Revenue Million Forecast, by Geography 2020 & 2033
- Table 30: Global North America Real Estate Brokerage Market Volume Billion Forecast, by Geography 2020 & 2033
- Table 31: Global North America Real Estate Brokerage Market Revenue Million Forecast, by Country 2020 & 2033
- Table 32: Global North America Real Estate Brokerage Market Volume Billion Forecast, by Country 2020 & 2033
Frequently Asked Questions
1. What is the projected Compound Annual Growth Rate (CAGR) of the North America Real Estate Brokerage Market?
The projected CAGR is approximately 2.30%.
2. Which companies are prominent players in the North America Real Estate Brokerage Market?
Key companies in the market include Keller Williams Realty, RE/MAX, Coldwell Banker Real Estate, Berkshire Hathaway HomeServices, Century 21 Real Estate, Sotheby's International Realty, ERA Real Estate, Corcoran Group, Compass, Douglas Elliman Real Estate**List Not Exhaustive 6 3 Other Companie.
3. What are the main segments of the North America Real Estate Brokerage Market?
The market segments include Type, Service, Geography.
4. Can you provide details about the market size?
The market size is estimated to be USD 227.08 Million as of 2022.
5. What are some drivers contributing to market growth?
4.; Increasing Urbanization Driving the Market4.; Regulatory Environment Driving the Market.
6. What are the notable trends driving market growth?
Industrial Rental Growth Faces Challenges Amidst Changing Dynamics.
7. Are there any restraints impacting market growth?
4.; Increasing Urbanization Driving the Market4.; Regulatory Environment Driving the Market.
8. Can you provide examples of recent developments in the market?
June 2024: Real Brokerage Inc., North America's fastest-growing publicly traded real estate brokerage, reported a significant expansion, surpassing 19,000 agents after a robust month of recruitment.
9. What pricing options are available for accessing the report?
Pricing options include single-user, multi-user, and enterprise licenses priced at USD 4750, USD 5250, and USD 8750 respectively.
10. Is the market size provided in terms of value or volume?
The market size is provided in terms of value, measured in Million and volume, measured in Billion.
11. Are there any specific market keywords associated with the report?
Yes, the market keyword associated with the report is "North America Real Estate Brokerage Market," which aids in identifying and referencing the specific market segment covered.
12. How do I determine which pricing option suits my needs best?
The pricing options vary based on user requirements and access needs. Individual users may opt for single-user licenses, while businesses requiring broader access may choose multi-user or enterprise licenses for cost-effective access to the report.
13. Are there any additional resources or data provided in the North America Real Estate Brokerage Market report?
While the report offers comprehensive insights, it's advisable to review the specific contents or supplementary materials provided to ascertain if additional resources or data are available.
14. How can I stay updated on further developments or reports in the North America Real Estate Brokerage Market?
To stay informed about further developments, trends, and reports in the North America Real Estate Brokerage Market, consider subscribing to industry newsletters, following relevant companies and organizations, or regularly checking reputable industry news sources and publications.
Methodology
Step 1 - Identification of Relevant Samples Size from Population Database


Step 2 - Approaches for Defining Global Market Size (Value, Volume* & Price*)

Note*: In applicable scenarios
Step 3 - Data Sources
Primary Research
- Web Analytics
- Survey Reports
- Research Institute
- Latest Research Reports
- Opinion Leaders
Secondary Research
- Annual Reports
- White Paper
- Latest Press Release
- Industry Association
- Paid Database
- Investor Presentations

Step 4 - Data Triangulation
Involves using different sources of information in order to increase the validity of a study
These sources are likely to be stakeholders in a program - participants, other researchers, program staff, other community members, and so on.
Then we put all data in single framework & apply various statistical tools to find out the dynamic on the market.
During the analysis stage, feedback from the stakeholder groups would be compared to determine areas of agreement as well as areas of divergence