

Key Insights
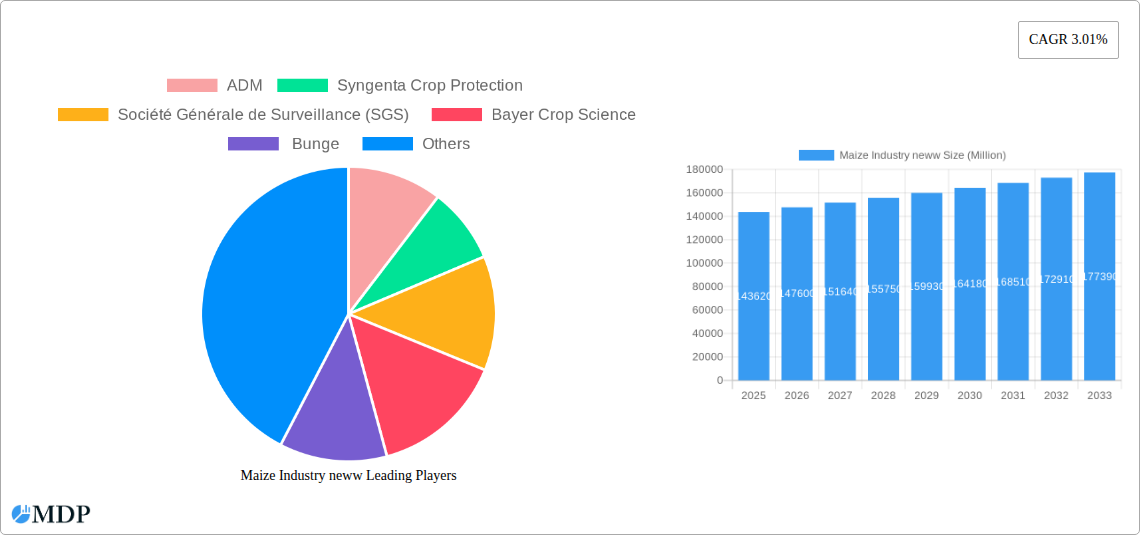
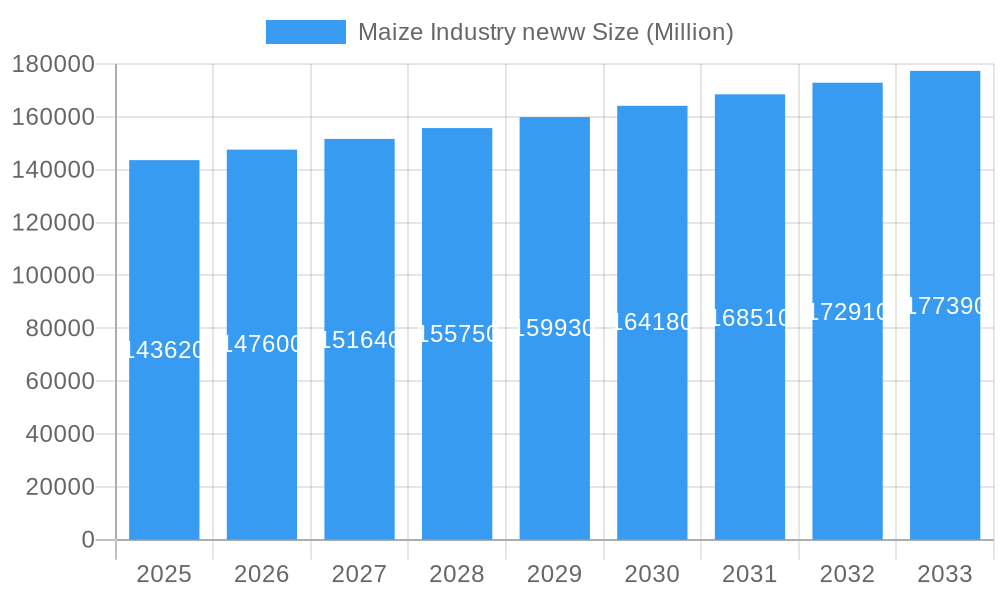
The global maize industry, valued at $143.62 billion in 2025, is projected to experience steady growth, driven by increasing demand from the food and beverage, feed, and biofuels sectors. A Compound Annual Growth Rate (CAGR) of 3.01% from 2025 to 2033 indicates a substantial market expansion. Key growth drivers include rising global populations requiring increased food supplies, the growing popularity of biofuels as a sustainable energy source, and the consistent demand for animal feed. Market segmentation reveals hybrid seeds as a dominant product type, with strong regional performance expected in North America, driven by high agricultural output and established infrastructure. Asia-Pacific, particularly China and India, also present significant growth opportunities due to their large populations and expanding agricultural sectors. However, challenges such as climate change impacting crop yields, fluctuating commodity prices, and stringent regulations on genetically modified organisms (GMOs) in certain regions represent potential restraints. Competitive dynamics are shaped by major players like ADM, Syngenta, Bayer, Bunge, Cargill, and Corteva, all vying for market share through innovation, strategic partnerships, and global expansion. The industry is also witnessing a shift towards sustainable agricultural practices, with increased focus on resource-efficient farming techniques and reduced environmental impact.
Maize Industry neww Market Size (In Billion)
The forecast period (2025-2033) anticipates continued expansion, with growth potentially accelerating in emerging markets due to rising disposable incomes and evolving dietary habits. The industry's performance will likely be influenced by global economic conditions, government policies supporting agricultural development, and advancements in seed technology and farming methods. Companies are likely to focus on developing high-yielding, climate-resilient maize varieties to mitigate the effects of climate change and ensure stable production. Furthermore, vertical integration within the supply chain and investment in research and development are likely to play crucial roles in shaping future market dynamics. Data suggests that diversification of end-use applications, particularly in the biofuels sector, could offer further growth opportunities.
Maize Industry neww Company Market Share
Maize Industry Market Report: 2019-2033 Forecast
Dive deep into the comprehensive Maize Industry Market Report (2019-2033), providing an in-depth analysis of market dynamics, trends, leading players, and future opportunities. This report covers key segments including Hybrid Seeds, Yellow Maize, White Maize, Sweet Corn, and Popcorn, across diverse end-uses such as Food & Beverage, Feed, and Biofuels. Valued at xx Million in 2025, the market is projected to reach xx Million by 2033, exhibiting a robust CAGR of xx%. This report is essential for stakeholders seeking actionable insights and strategic guidance in this dynamic industry.
Maize Industry Market Dynamics & Concentration
The global maize market, valued at xx Million in 2025, is characterized by moderate concentration, with key players like ADM, Cargill, and Bunge holding significant market share. Innovation in hybrid seed technology and genetically modified (GM) maize drives market growth, alongside evolving regulatory frameworks impacting GMO adoption across different regions. Product substitutes, such as other grains and alternative biofuel sources, present competitive pressure, while end-user trends shift towards value-added products and sustainable sourcing. The historical period (2019-2024) witnessed xx M&A deals, signaling industry consolidation.
- Market Share: ADM (xx%), Cargill (xx%), Bunge (xx%), Others (xx%)
- M&A Activity (2019-2024): xx deals, primarily focused on expanding geographical reach and product portfolios.
- Regulatory Landscape: Varying regulations concerning GMOs across countries significantly influence market dynamics.
Maize Industry Industry Trends & Analysis
The maize industry is experiencing dynamic shifts driven by several factors. Technological advancements in precision agriculture, including drone technology and data analytics, are improving yields and resource efficiency. Consumer preferences are increasingly focused on non-GMO options and sustainable farming practices, influencing production methods. Intense competition among major players necessitates continuous innovation and strategic partnerships to maintain market share. The market is projected to grow at a CAGR of xx% from 2025 to 2033, fueled by increasing demand from the food & beverage, feed, and biofuels sectors. Market penetration of hybrid seeds is estimated at xx% in 2025, expected to rise to xx% by 2033.
Leading Markets & Segments in Maize Industry
The North American and South American regions are currently dominant, driven by favorable climatic conditions and substantial agricultural infrastructure. Within product types, Yellow Maize remains the largest segment, owing to its widespread use in feed and food applications. The Feed sector accounts for the largest share of end-user demand globally, followed by Food & Beverage and Biofuels.
- Key Drivers for Dominant Regions:
- North America: Established agricultural infrastructure, advanced technology adoption, and favorable government policies.
- South America: Large arable land suitable for maize cultivation and growing export markets.
- Dominant Segments:
- Product Type: Yellow Maize (largest market share)
- End-User: Feed (highest demand)
Maize Industry Product Developments
Recent product innovations focus on developing high-yielding, disease-resistant hybrid seeds tailored to specific climatic conditions and end-user needs. Improved processing technologies are creating value-added products, such as high-fructose corn syrup and corn-based bioplastics. These advancements are enhancing the competitive advantages of key players and broadening the applications of maize across diverse industries.
Key Drivers of Maize Industry Growth
Several factors are driving maize market expansion. Technological advancements in seed genetics and precision agriculture are boosting yields and efficiency. Growing global population and rising demand for food and feed are key drivers. Favorable government policies and incentives in certain regions are supporting maize production. The increasing use of maize in biofuel production is further contributing to market growth.
Challenges in the Maize Industry Market
The maize industry faces various challenges. Climate change impacts, such as droughts and floods, pose significant risks to yields and production stability. Fluctuations in commodity prices and supply chain disruptions can impact profitability. Intense competition and the need for continuous innovation add to the challenges faced by industry players.
Emerging Opportunities in Maize Industry
The development of drought-resistant and pest-resistant maize varieties offers significant opportunities for enhancing yields and mitigating climate change risks. Strategic partnerships between seed companies and agricultural technology providers can accelerate innovation and market penetration. Expanding into new markets and developing value-added products will open further avenues for growth.
Leading Players in the Maize Industry Sector
Key Milestones in Maize Industry
- November 2021: Fufeng Group plans a USD 700 Million corn wet-milling plant in China.
- May 2022: Indian government announces initiatives to boost maize production.
- October 2022: Inauguration of an ultramodern maize processing factory in Ghana.
Strategic Outlook for Maize Industry Market
The maize industry presents significant long-term growth potential, driven by factors such as increasing global population, rising demand for food and feed, and the growing adoption of maize in biofuel production. Strategic partnerships, technological innovation, and sustainable farming practices will be critical for success in this dynamic market. Companies focusing on developing high-yielding, climate-resilient varieties and value-added products are expected to thrive.
Maize Industry neww Segmentation
- 1. Production Analysis
- 2. Consumption Analysis
- 3. Import Market Analysis (Value & Volume)
- 4. Export Market Analysis (Value & Volume)
- 5. Price Trend Analysis
Maize Industry neww Segmentation By Geography
-
1. North America
- 1.1. United States
- 1.2. Canada
- 1.3. Mexico
-
2. Europe
- 2.1. Spain
- 2.2. Italy
- 2.3. France
- 2.4. Germany
- 2.5. Russia
-
3. Asia Pacific
- 3.1. India
- 3.2. China
- 3.3. Vietnam
-
4. South America
- 4.1. Brazil
- 4.2. Argentina
-
5. Africa
- 5.1. South Africa
- 5.2. Nigeria
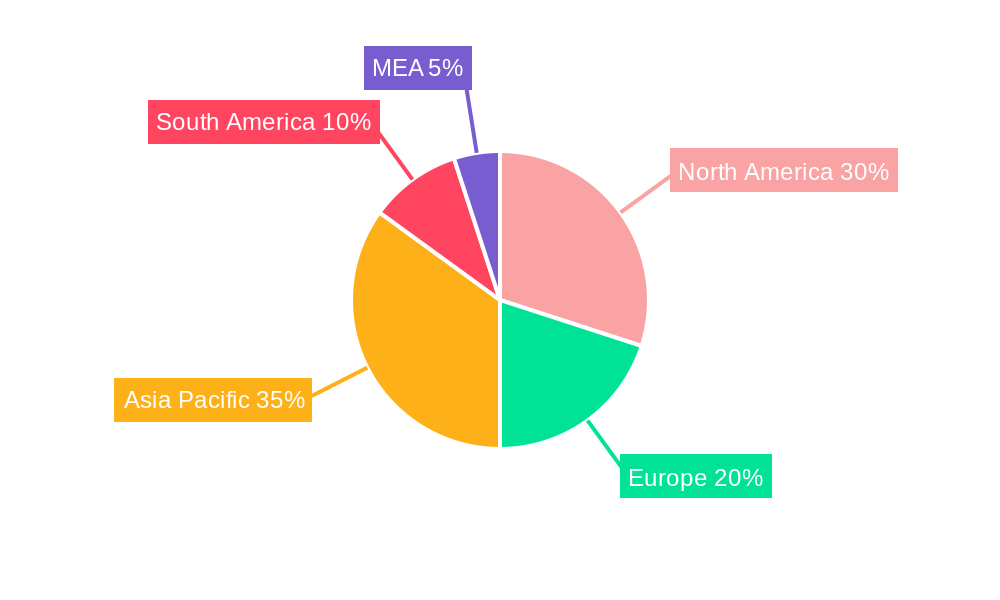
Maize Industry neww Regional Market Share
Geographic Coverage of Maize Industry neww
Maize Industry neww REPORT HIGHLIGHTS
| Aspects | Details |
|---|---|
| Study Period | 2020-2034 |
| Base Year | 2025 |
| Estimated Year | 2026 |
| Forecast Period | 2026-2034 |
| Historical Period | 2020-2025 |
| Growth Rate | CAGR of 3.01% from 2020-2034 |
| Segmentation |
|
Table of Contents
- 1. Introduction
- 1.1. Research Scope
- 1.2. Market Segmentation
- 1.3. Research Methodology
- 1.4. Definitions and Assumptions
- 2. Executive Summary
- 2.1. Introduction
- 3. Market Dynamics
- 3.1. Introduction
- 3.2. Market Drivers
- 3.3. Market Restrains
- 3.4. Market Trends
- 3.4.1. Increase in Demand for Animal-based Protein Sources
- 4. Market Factor Analysis
- 4.1. Porters Five Forces
- 4.2. Supply/Value Chain
- 4.3. PESTEL analysis
- 4.4. Market Entropy
- 4.5. Patent/Trademark Analysis
- 5. Global Maize Industry neww Analysis, Insights and Forecast, 2020-2032
- 5.1. Market Analysis, Insights and Forecast - by Production Analysis
- 5.2. Market Analysis, Insights and Forecast - by Consumption Analysis
- 5.3. Market Analysis, Insights and Forecast - by Import Market Analysis (Value & Volume)
- 5.4. Market Analysis, Insights and Forecast - by Export Market Analysis (Value & Volume)
- 5.5. Market Analysis, Insights and Forecast - by Price Trend Analysis
- 5.6. Market Analysis, Insights and Forecast - by Region
- 5.6.1. North America
- 5.6.2. Europe
- 5.6.3. Asia Pacific
- 5.6.4. South America
- 5.6.5. Africa
- 5.1. Market Analysis, Insights and Forecast - by Production Analysis
- 6. North America Maize Industry neww Analysis, Insights and Forecast, 2020-2032
- 6.1. Market Analysis, Insights and Forecast - by Production Analysis
- 6.2. Market Analysis, Insights and Forecast - by Consumption Analysis
- 6.3. Market Analysis, Insights and Forecast - by Import Market Analysis (Value & Volume)
- 6.4. Market Analysis, Insights and Forecast - by Export Market Analysis (Value & Volume)
- 6.5. Market Analysis, Insights and Forecast - by Price Trend Analysis
- 6.1. Market Analysis, Insights and Forecast - by Production Analysis
- 7. Europe Maize Industry neww Analysis, Insights and Forecast, 2020-2032
- 7.1. Market Analysis, Insights and Forecast - by Production Analysis
- 7.2. Market Analysis, Insights and Forecast - by Consumption Analysis
- 7.3. Market Analysis, Insights and Forecast - by Import Market Analysis (Value & Volume)
- 7.4. Market Analysis, Insights and Forecast - by Export Market Analysis (Value & Volume)
- 7.5. Market Analysis, Insights and Forecast - by Price Trend Analysis
- 7.1. Market Analysis, Insights and Forecast - by Production Analysis
- 8. Asia Pacific Maize Industry neww Analysis, Insights and Forecast, 2020-2032
- 8.1. Market Analysis, Insights and Forecast - by Production Analysis
- 8.2. Market Analysis, Insights and Forecast - by Consumption Analysis
- 8.3. Market Analysis, Insights and Forecast - by Import Market Analysis (Value & Volume)
- 8.4. Market Analysis, Insights and Forecast - by Export Market Analysis (Value & Volume)
- 8.5. Market Analysis, Insights and Forecast - by Price Trend Analysis
- 8.1. Market Analysis, Insights and Forecast - by Production Analysis
- 9. South America Maize Industry neww Analysis, Insights and Forecast, 2020-2032
- 9.1. Market Analysis, Insights and Forecast - by Production Analysis
- 9.2. Market Analysis, Insights and Forecast - by Consumption Analysis
- 9.3. Market Analysis, Insights and Forecast - by Import Market Analysis (Value & Volume)
- 9.4. Market Analysis, Insights and Forecast - by Export Market Analysis (Value & Volume)
- 9.5. Market Analysis, Insights and Forecast - by Price Trend Analysis
- 9.1. Market Analysis, Insights and Forecast - by Production Analysis
- 10. Africa Maize Industry neww Analysis, Insights and Forecast, 2020-2032
- 10.1. Market Analysis, Insights and Forecast - by Production Analysis
- 10.2. Market Analysis, Insights and Forecast - by Consumption Analysis
- 10.3. Market Analysis, Insights and Forecast - by Import Market Analysis (Value & Volume)
- 10.4. Market Analysis, Insights and Forecast - by Export Market Analysis (Value & Volume)
- 10.5. Market Analysis, Insights and Forecast - by Price Trend Analysis
- 10.1. Market Analysis, Insights and Forecast - by Production Analysis
- 11. Competitive Analysis
- 11.1. Global Market Share Analysis 2025
- 11.2. Company Profiles
- 11.2.1 ADM
- 11.2.1.1. Overview
- 11.2.1.2. Products
- 11.2.1.3. SWOT Analysis
- 11.2.1.4. Recent Developments
- 11.2.1.5. Financials (Based on Availability)
- 11.2.2 Syngenta Crop Protection
- 11.2.2.1. Overview
- 11.2.2.2. Products
- 11.2.2.3. SWOT Analysis
- 11.2.2.4. Recent Developments
- 11.2.2.5. Financials (Based on Availability)
- 11.2.3 Société Générale de Surveillance (SGS)
- 11.2.3.1. Overview
- 11.2.3.2. Products
- 11.2.3.3. SWOT Analysis
- 11.2.3.4. Recent Developments
- 11.2.3.5. Financials (Based on Availability)
- 11.2.4 Bayer Crop Science
- 11.2.4.1. Overview
- 11.2.4.2. Products
- 11.2.4.3. SWOT Analysis
- 11.2.4.4. Recent Developments
- 11.2.4.5. Financials (Based on Availability)
- 11.2.5 Bunge
- 11.2.5.1. Overview
- 11.2.5.2. Products
- 11.2.5.3. SWOT Analysis
- 11.2.5.4. Recent Developments
- 11.2.5.5. Financials (Based on Availability)
- 11.2.6 Bunge Limited
- 11.2.6.1. Overview
- 11.2.6.2. Products
- 11.2.6.3. SWOT Analysis
- 11.2.6.4. Recent Developments
- 11.2.6.5. Financials (Based on Availability)
- 11.2.7 Cargill Incorporated
- 11.2.7.1. Overview
- 11.2.7.2. Products
- 11.2.7.3. SWOT Analysis
- 11.2.7.4. Recent Developments
- 11.2.7.5. Financials (Based on Availability)
- 11.2.8 Corteva Agriscience
- 11.2.8.1. Overview
- 11.2.8.2. Products
- 11.2.8.3. SWOT Analysis
- 11.2.8.4. Recent Developments
- 11.2.8.5. Financials (Based on Availability)
- 11.2.9 ADM
- 11.2.9.1. Overview
- 11.2.9.2. Products
- 11.2.9.3. SWOT Analysis
- 11.2.9.4. Recent Developments
- 11.2.9.5. Financials (Based on Availability)
- 11.2.10 Olam Group
- 11.2.10.1. Overview
- 11.2.10.2. Products
- 11.2.10.3. SWOT Analysis
- 11.2.10.4. Recent Developments
- 11.2.10.5. Financials (Based on Availability)
- 11.2.1 ADM
List of Figures
- Figure 1: Global Maize Industry neww Revenue Breakdown (Million, %) by Region 2025 & 2033
- Figure 2: Global Maize Industry neww Volume Breakdown (Kiloton, %) by Region 2025 & 2033
- Figure 3: North America Maize Industry neww Revenue (Million), by Production Analysis 2025 & 2033
- Figure 4: North America Maize Industry neww Volume (Kiloton), by Production Analysis 2025 & 2033
- Figure 5: North America Maize Industry neww Revenue Share (%), by Production Analysis 2025 & 2033
- Figure 6: North America Maize Industry neww Volume Share (%), by Production Analysis 2025 & 2033
- Figure 7: North America Maize Industry neww Revenue (Million), by Consumption Analysis 2025 & 2033
- Figure 8: North America Maize Industry neww Volume (Kiloton), by Consumption Analysis 2025 & 2033
- Figure 9: North America Maize Industry neww Revenue Share (%), by Consumption Analysis 2025 & 2033
- Figure 10: North America Maize Industry neww Volume Share (%), by Consumption Analysis 2025 & 2033
- Figure 11: North America Maize Industry neww Revenue (Million), by Import Market Analysis (Value & Volume) 2025 & 2033
- Figure 12: North America Maize Industry neww Volume (Kiloton), by Import Market Analysis (Value & Volume) 2025 & 2033
- Figure 13: North America Maize Industry neww Revenue Share (%), by Import Market Analysis (Value & Volume) 2025 & 2033
- Figure 14: North America Maize Industry neww Volume Share (%), by Import Market Analysis (Value & Volume) 2025 & 2033
- Figure 15: North America Maize Industry neww Revenue (Million), by Export Market Analysis (Value & Volume) 2025 & 2033
- Figure 16: North America Maize Industry neww Volume (Kiloton), by Export Market Analysis (Value & Volume) 2025 & 2033
- Figure 17: North America Maize Industry neww Revenue Share (%), by Export Market Analysis (Value & Volume) 2025 & 2033
- Figure 18: North America Maize Industry neww Volume Share (%), by Export Market Analysis (Value & Volume) 2025 & 2033
- Figure 19: North America Maize Industry neww Revenue (Million), by Price Trend Analysis 2025 & 2033
- Figure 20: North America Maize Industry neww Volume (Kiloton), by Price Trend Analysis 2025 & 2033
- Figure 21: North America Maize Industry neww Revenue Share (%), by Price Trend Analysis 2025 & 2033
- Figure 22: North America Maize Industry neww Volume Share (%), by Price Trend Analysis 2025 & 2033
- Figure 23: North America Maize Industry neww Revenue (Million), by Country 2025 & 2033
- Figure 24: North America Maize Industry neww Volume (Kiloton), by Country 2025 & 2033
- Figure 25: North America Maize Industry neww Revenue Share (%), by Country 2025 & 2033
- Figure 26: North America Maize Industry neww Volume Share (%), by Country 2025 & 2033
- Figure 27: Europe Maize Industry neww Revenue (Million), by Production Analysis 2025 & 2033
- Figure 28: Europe Maize Industry neww Volume (Kiloton), by Production Analysis 2025 & 2033
- Figure 29: Europe Maize Industry neww Revenue Share (%), by Production Analysis 2025 & 2033
- Figure 30: Europe Maize Industry neww Volume Share (%), by Production Analysis 2025 & 2033
- Figure 31: Europe Maize Industry neww Revenue (Million), by Consumption Analysis 2025 & 2033
- Figure 32: Europe Maize Industry neww Volume (Kiloton), by Consumption Analysis 2025 & 2033
- Figure 33: Europe Maize Industry neww Revenue Share (%), by Consumption Analysis 2025 & 2033
- Figure 34: Europe Maize Industry neww Volume Share (%), by Consumption Analysis 2025 & 2033
- Figure 35: Europe Maize Industry neww Revenue (Million), by Import Market Analysis (Value & Volume) 2025 & 2033
- Figure 36: Europe Maize Industry neww Volume (Kiloton), by Import Market Analysis (Value & Volume) 2025 & 2033
- Figure 37: Europe Maize Industry neww Revenue Share (%), by Import Market Analysis (Value & Volume) 2025 & 2033
- Figure 38: Europe Maize Industry neww Volume Share (%), by Import Market Analysis (Value & Volume) 2025 & 2033
- Figure 39: Europe Maize Industry neww Revenue (Million), by Export Market Analysis (Value & Volume) 2025 & 2033
- Figure 40: Europe Maize Industry neww Volume (Kiloton), by Export Market Analysis (Value & Volume) 2025 & 2033
- Figure 41: Europe Maize Industry neww Revenue Share (%), by Export Market Analysis (Value & Volume) 2025 & 2033
- Figure 42: Europe Maize Industry neww Volume Share (%), by Export Market Analysis (Value & Volume) 2025 & 2033
- Figure 43: Europe Maize Industry neww Revenue (Million), by Price Trend Analysis 2025 & 2033
- Figure 44: Europe Maize Industry neww Volume (Kiloton), by Price Trend Analysis 2025 & 2033
- Figure 45: Europe Maize Industry neww Revenue Share (%), by Price Trend Analysis 2025 & 2033
- Figure 46: Europe Maize Industry neww Volume Share (%), by Price Trend Analysis 2025 & 2033
- Figure 47: Europe Maize Industry neww Revenue (Million), by Country 2025 & 2033
- Figure 48: Europe Maize Industry neww Volume (Kiloton), by Country 2025 & 2033
- Figure 49: Europe Maize Industry neww Revenue Share (%), by Country 2025 & 2033
- Figure 50: Europe Maize Industry neww Volume Share (%), by Country 2025 & 2033
- Figure 51: Asia Pacific Maize Industry neww Revenue (Million), by Production Analysis 2025 & 2033
- Figure 52: Asia Pacific Maize Industry neww Volume (Kiloton), by Production Analysis 2025 & 2033
- Figure 53: Asia Pacific Maize Industry neww Revenue Share (%), by Production Analysis 2025 & 2033
- Figure 54: Asia Pacific Maize Industry neww Volume Share (%), by Production Analysis 2025 & 2033
- Figure 55: Asia Pacific Maize Industry neww Revenue (Million), by Consumption Analysis 2025 & 2033
- Figure 56: Asia Pacific Maize Industry neww Volume (Kiloton), by Consumption Analysis 2025 & 2033
- Figure 57: Asia Pacific Maize Industry neww Revenue Share (%), by Consumption Analysis 2025 & 2033
- Figure 58: Asia Pacific Maize Industry neww Volume Share (%), by Consumption Analysis 2025 & 2033
- Figure 59: Asia Pacific Maize Industry neww Revenue (Million), by Import Market Analysis (Value & Volume) 2025 & 2033
- Figure 60: Asia Pacific Maize Industry neww Volume (Kiloton), by Import Market Analysis (Value & Volume) 2025 & 2033
- Figure 61: Asia Pacific Maize Industry neww Revenue Share (%), by Import Market Analysis (Value & Volume) 2025 & 2033
- Figure 62: Asia Pacific Maize Industry neww Volume Share (%), by Import Market Analysis (Value & Volume) 2025 & 2033
- Figure 63: Asia Pacific Maize Industry neww Revenue (Million), by Export Market Analysis (Value & Volume) 2025 & 2033
- Figure 64: Asia Pacific Maize Industry neww Volume (Kiloton), by Export Market Analysis (Value & Volume) 2025 & 2033
- Figure 65: Asia Pacific Maize Industry neww Revenue Share (%), by Export Market Analysis (Value & Volume) 2025 & 2033
- Figure 66: Asia Pacific Maize Industry neww Volume Share (%), by Export Market Analysis (Value & Volume) 2025 & 2033
- Figure 67: Asia Pacific Maize Industry neww Revenue (Million), by Price Trend Analysis 2025 & 2033
- Figure 68: Asia Pacific Maize Industry neww Volume (Kiloton), by Price Trend Analysis 2025 & 2033
- Figure 69: Asia Pacific Maize Industry neww Revenue Share (%), by Price Trend Analysis 2025 & 2033
- Figure 70: Asia Pacific Maize Industry neww Volume Share (%), by Price Trend Analysis 2025 & 2033
- Figure 71: Asia Pacific Maize Industry neww Revenue (Million), by Country 2025 & 2033
- Figure 72: Asia Pacific Maize Industry neww Volume (Kiloton), by Country 2025 & 2033
- Figure 73: Asia Pacific Maize Industry neww Revenue Share (%), by Country 2025 & 2033
- Figure 74: Asia Pacific Maize Industry neww Volume Share (%), by Country 2025 & 2033
- Figure 75: South America Maize Industry neww Revenue (Million), by Production Analysis 2025 & 2033
- Figure 76: South America Maize Industry neww Volume (Kiloton), by Production Analysis 2025 & 2033
- Figure 77: South America Maize Industry neww Revenue Share (%), by Production Analysis 2025 & 2033
- Figure 78: South America Maize Industry neww Volume Share (%), by Production Analysis 2025 & 2033
- Figure 79: South America Maize Industry neww Revenue (Million), by Consumption Analysis 2025 & 2033
- Figure 80: South America Maize Industry neww Volume (Kiloton), by Consumption Analysis 2025 & 2033
- Figure 81: South America Maize Industry neww Revenue Share (%), by Consumption Analysis 2025 & 2033
- Figure 82: South America Maize Industry neww Volume Share (%), by Consumption Analysis 2025 & 2033
- Figure 83: South America Maize Industry neww Revenue (Million), by Import Market Analysis (Value & Volume) 2025 & 2033
- Figure 84: South America Maize Industry neww Volume (Kiloton), by Import Market Analysis (Value & Volume) 2025 & 2033
- Figure 85: South America Maize Industry neww Revenue Share (%), by Import Market Analysis (Value & Volume) 2025 & 2033
- Figure 86: South America Maize Industry neww Volume Share (%), by Import Market Analysis (Value & Volume) 2025 & 2033
- Figure 87: South America Maize Industry neww Revenue (Million), by Export Market Analysis (Value & Volume) 2025 & 2033
- Figure 88: South America Maize Industry neww Volume (Kiloton), by Export Market Analysis (Value & Volume) 2025 & 2033
- Figure 89: South America Maize Industry neww Revenue Share (%), by Export Market Analysis (Value & Volume) 2025 & 2033
- Figure 90: South America Maize Industry neww Volume Share (%), by Export Market Analysis (Value & Volume) 2025 & 2033
- Figure 91: South America Maize Industry neww Revenue (Million), by Price Trend Analysis 2025 & 2033
- Figure 92: South America Maize Industry neww Volume (Kiloton), by Price Trend Analysis 2025 & 2033
- Figure 93: South America Maize Industry neww Revenue Share (%), by Price Trend Analysis 2025 & 2033
- Figure 94: South America Maize Industry neww Volume Share (%), by Price Trend Analysis 2025 & 2033
- Figure 95: South America Maize Industry neww Revenue (Million), by Country 2025 & 2033
- Figure 96: South America Maize Industry neww Volume (Kiloton), by Country 2025 & 2033
- Figure 97: South America Maize Industry neww Revenue Share (%), by Country 2025 & 2033
- Figure 98: South America Maize Industry neww Volume Share (%), by Country 2025 & 2033
- Figure 99: Africa Maize Industry neww Revenue (Million), by Production Analysis 2025 & 2033
- Figure 100: Africa Maize Industry neww Volume (Kiloton), by Production Analysis 2025 & 2033
- Figure 101: Africa Maize Industry neww Revenue Share (%), by Production Analysis 2025 & 2033
- Figure 102: Africa Maize Industry neww Volume Share (%), by Production Analysis 2025 & 2033
- Figure 103: Africa Maize Industry neww Revenue (Million), by Consumption Analysis 2025 & 2033
- Figure 104: Africa Maize Industry neww Volume (Kiloton), by Consumption Analysis 2025 & 2033
- Figure 105: Africa Maize Industry neww Revenue Share (%), by Consumption Analysis 2025 & 2033
- Figure 106: Africa Maize Industry neww Volume Share (%), by Consumption Analysis 2025 & 2033
- Figure 107: Africa Maize Industry neww Revenue (Million), by Import Market Analysis (Value & Volume) 2025 & 2033
- Figure 108: Africa Maize Industry neww Volume (Kiloton), by Import Market Analysis (Value & Volume) 2025 & 2033
- Figure 109: Africa Maize Industry neww Revenue Share (%), by Import Market Analysis (Value & Volume) 2025 & 2033
- Figure 110: Africa Maize Industry neww Volume Share (%), by Import Market Analysis (Value & Volume) 2025 & 2033
- Figure 111: Africa Maize Industry neww Revenue (Million), by Export Market Analysis (Value & Volume) 2025 & 2033
- Figure 112: Africa Maize Industry neww Volume (Kiloton), by Export Market Analysis (Value & Volume) 2025 & 2033
- Figure 113: Africa Maize Industry neww Revenue Share (%), by Export Market Analysis (Value & Volume) 2025 & 2033
- Figure 114: Africa Maize Industry neww Volume Share (%), by Export Market Analysis (Value & Volume) 2025 & 2033
- Figure 115: Africa Maize Industry neww Revenue (Million), by Price Trend Analysis 2025 & 2033
- Figure 116: Africa Maize Industry neww Volume (Kiloton), by Price Trend Analysis 2025 & 2033
- Figure 117: Africa Maize Industry neww Revenue Share (%), by Price Trend Analysis 2025 & 2033
- Figure 118: Africa Maize Industry neww Volume Share (%), by Price Trend Analysis 2025 & 2033
- Figure 119: Africa Maize Industry neww Revenue (Million), by Country 2025 & 2033
- Figure 120: Africa Maize Industry neww Volume (Kiloton), by Country 2025 & 2033
- Figure 121: Africa Maize Industry neww Revenue Share (%), by Country 2025 & 2033
- Figure 122: Africa Maize Industry neww Volume Share (%), by Country 2025 & 2033
List of Tables
- Table 1: Global Maize Industry neww Revenue Million Forecast, by Production Analysis 2020 & 2033
- Table 2: Global Maize Industry neww Volume Kiloton Forecast, by Production Analysis 2020 & 2033
- Table 3: Global Maize Industry neww Revenue Million Forecast, by Consumption Analysis 2020 & 2033
- Table 4: Global Maize Industry neww Volume Kiloton Forecast, by Consumption Analysis 2020 & 2033
- Table 5: Global Maize Industry neww Revenue Million Forecast, by Import Market Analysis (Value & Volume) 2020 & 2033
- Table 6: Global Maize Industry neww Volume Kiloton Forecast, by Import Market Analysis (Value & Volume) 2020 & 2033
- Table 7: Global Maize Industry neww Revenue Million Forecast, by Export Market Analysis (Value & Volume) 2020 & 2033
- Table 8: Global Maize Industry neww Volume Kiloton Forecast, by Export Market Analysis (Value & Volume) 2020 & 2033
- Table 9: Global Maize Industry neww Revenue Million Forecast, by Price Trend Analysis 2020 & 2033
- Table 10: Global Maize Industry neww Volume Kiloton Forecast, by Price Trend Analysis 2020 & 2033
- Table 11: Global Maize Industry neww Revenue Million Forecast, by Region 2020 & 2033
- Table 12: Global Maize Industry neww Volume Kiloton Forecast, by Region 2020 & 2033
- Table 13: Global Maize Industry neww Revenue Million Forecast, by Production Analysis 2020 & 2033
- Table 14: Global Maize Industry neww Volume Kiloton Forecast, by Production Analysis 2020 & 2033
- Table 15: Global Maize Industry neww Revenue Million Forecast, by Consumption Analysis 2020 & 2033
- Table 16: Global Maize Industry neww Volume Kiloton Forecast, by Consumption Analysis 2020 & 2033
- Table 17: Global Maize Industry neww Revenue Million Forecast, by Import Market Analysis (Value & Volume) 2020 & 2033
- Table 18: Global Maize Industry neww Volume Kiloton Forecast, by Import Market Analysis (Value & Volume) 2020 & 2033
- Table 19: Global Maize Industry neww Revenue Million Forecast, by Export Market Analysis (Value & Volume) 2020 & 2033
- Table 20: Global Maize Industry neww Volume Kiloton Forecast, by Export Market Analysis (Value & Volume) 2020 & 2033
- Table 21: Global Maize Industry neww Revenue Million Forecast, by Price Trend Analysis 2020 & 2033
- Table 22: Global Maize Industry neww Volume Kiloton Forecast, by Price Trend Analysis 2020 & 2033
- Table 23: Global Maize Industry neww Revenue Million Forecast, by Country 2020 & 2033
- Table 24: Global Maize Industry neww Volume Kiloton Forecast, by Country 2020 & 2033
- Table 25: United States Maize Industry neww Revenue (Million) Forecast, by Application 2020 & 2033
- Table 26: United States Maize Industry neww Volume (Kiloton) Forecast, by Application 2020 & 2033
- Table 27: Canada Maize Industry neww Revenue (Million) Forecast, by Application 2020 & 2033
- Table 28: Canada Maize Industry neww Volume (Kiloton) Forecast, by Application 2020 & 2033
- Table 29: Mexico Maize Industry neww Revenue (Million) Forecast, by Application 2020 & 2033
- Table 30: Mexico Maize Industry neww Volume (Kiloton) Forecast, by Application 2020 & 2033
- Table 31: Global Maize Industry neww Revenue Million Forecast, by Production Analysis 2020 & 2033
- Table 32: Global Maize Industry neww Volume Kiloton Forecast, by Production Analysis 2020 & 2033
- Table 33: Global Maize Industry neww Revenue Million Forecast, by Consumption Analysis 2020 & 2033
- Table 34: Global Maize Industry neww Volume Kiloton Forecast, by Consumption Analysis 2020 & 2033
- Table 35: Global Maize Industry neww Revenue Million Forecast, by Import Market Analysis (Value & Volume) 2020 & 2033
- Table 36: Global Maize Industry neww Volume Kiloton Forecast, by Import Market Analysis (Value & Volume) 2020 & 2033
- Table 37: Global Maize Industry neww Revenue Million Forecast, by Export Market Analysis (Value & Volume) 2020 & 2033
- Table 38: Global Maize Industry neww Volume Kiloton Forecast, by Export Market Analysis (Value & Volume) 2020 & 2033
- Table 39: Global Maize Industry neww Revenue Million Forecast, by Price Trend Analysis 2020 & 2033
- Table 40: Global Maize Industry neww Volume Kiloton Forecast, by Price Trend Analysis 2020 & 2033
- Table 41: Global Maize Industry neww Revenue Million Forecast, by Country 2020 & 2033
- Table 42: Global Maize Industry neww Volume Kiloton Forecast, by Country 2020 & 2033
- Table 43: Spain Maize Industry neww Revenue (Million) Forecast, by Application 2020 & 2033
- Table 44: Spain Maize Industry neww Volume (Kiloton) Forecast, by Application 2020 & 2033
- Table 45: Italy Maize Industry neww Revenue (Million) Forecast, by Application 2020 & 2033
- Table 46: Italy Maize Industry neww Volume (Kiloton) Forecast, by Application 2020 & 2033
- Table 47: France Maize Industry neww Revenue (Million) Forecast, by Application 2020 & 2033
- Table 48: France Maize Industry neww Volume (Kiloton) Forecast, by Application 2020 & 2033
- Table 49: Germany Maize Industry neww Revenue (Million) Forecast, by Application 2020 & 2033
- Table 50: Germany Maize Industry neww Volume (Kiloton) Forecast, by Application 2020 & 2033
- Table 51: Russia Maize Industry neww Revenue (Million) Forecast, by Application 2020 & 2033
- Table 52: Russia Maize Industry neww Volume (Kiloton) Forecast, by Application 2020 & 2033
- Table 53: Global Maize Industry neww Revenue Million Forecast, by Production Analysis 2020 & 2033
- Table 54: Global Maize Industry neww Volume Kiloton Forecast, by Production Analysis 2020 & 2033
- Table 55: Global Maize Industry neww Revenue Million Forecast, by Consumption Analysis 2020 & 2033
- Table 56: Global Maize Industry neww Volume Kiloton Forecast, by Consumption Analysis 2020 & 2033
- Table 57: Global Maize Industry neww Revenue Million Forecast, by Import Market Analysis (Value & Volume) 2020 & 2033
- Table 58: Global Maize Industry neww Volume Kiloton Forecast, by Import Market Analysis (Value & Volume) 2020 & 2033
- Table 59: Global Maize Industry neww Revenue Million Forecast, by Export Market Analysis (Value & Volume) 2020 & 2033
- Table 60: Global Maize Industry neww Volume Kiloton Forecast, by Export Market Analysis (Value & Volume) 2020 & 2033
- Table 61: Global Maize Industry neww Revenue Million Forecast, by Price Trend Analysis 2020 & 2033
- Table 62: Global Maize Industry neww Volume Kiloton Forecast, by Price Trend Analysis 2020 & 2033
- Table 63: Global Maize Industry neww Revenue Million Forecast, by Country 2020 & 2033
- Table 64: Global Maize Industry neww Volume Kiloton Forecast, by Country 2020 & 2033
- Table 65: India Maize Industry neww Revenue (Million) Forecast, by Application 2020 & 2033
- Table 66: India Maize Industry neww Volume (Kiloton) Forecast, by Application 2020 & 2033
- Table 67: China Maize Industry neww Revenue (Million) Forecast, by Application 2020 & 2033
- Table 68: China Maize Industry neww Volume (Kiloton) Forecast, by Application 2020 & 2033
- Table 69: Vietnam Maize Industry neww Revenue (Million) Forecast, by Application 2020 & 2033
- Table 70: Vietnam Maize Industry neww Volume (Kiloton) Forecast, by Application 2020 & 2033
- Table 71: Global Maize Industry neww Revenue Million Forecast, by Production Analysis 2020 & 2033
- Table 72: Global Maize Industry neww Volume Kiloton Forecast, by Production Analysis 2020 & 2033
- Table 73: Global Maize Industry neww Revenue Million Forecast, by Consumption Analysis 2020 & 2033
- Table 74: Global Maize Industry neww Volume Kiloton Forecast, by Consumption Analysis 2020 & 2033
- Table 75: Global Maize Industry neww Revenue Million Forecast, by Import Market Analysis (Value & Volume) 2020 & 2033
- Table 76: Global Maize Industry neww Volume Kiloton Forecast, by Import Market Analysis (Value & Volume) 2020 & 2033
- Table 77: Global Maize Industry neww Revenue Million Forecast, by Export Market Analysis (Value & Volume) 2020 & 2033
- Table 78: Global Maize Industry neww Volume Kiloton Forecast, by Export Market Analysis (Value & Volume) 2020 & 2033
- Table 79: Global Maize Industry neww Revenue Million Forecast, by Price Trend Analysis 2020 & 2033
- Table 80: Global Maize Industry neww Volume Kiloton Forecast, by Price Trend Analysis 2020 & 2033
- Table 81: Global Maize Industry neww Revenue Million Forecast, by Country 2020 & 2033
- Table 82: Global Maize Industry neww Volume Kiloton Forecast, by Country 2020 & 2033
- Table 83: Brazil Maize Industry neww Revenue (Million) Forecast, by Application 2020 & 2033
- Table 84: Brazil Maize Industry neww Volume (Kiloton) Forecast, by Application 2020 & 2033
- Table 85: Argentina Maize Industry neww Revenue (Million) Forecast, by Application 2020 & 2033
- Table 86: Argentina Maize Industry neww Volume (Kiloton) Forecast, by Application 2020 & 2033
- Table 87: Global Maize Industry neww Revenue Million Forecast, by Production Analysis 2020 & 2033
- Table 88: Global Maize Industry neww Volume Kiloton Forecast, by Production Analysis 2020 & 2033
- Table 89: Global Maize Industry neww Revenue Million Forecast, by Consumption Analysis 2020 & 2033
- Table 90: Global Maize Industry neww Volume Kiloton Forecast, by Consumption Analysis 2020 & 2033
- Table 91: Global Maize Industry neww Revenue Million Forecast, by Import Market Analysis (Value & Volume) 2020 & 2033
- Table 92: Global Maize Industry neww Volume Kiloton Forecast, by Import Market Analysis (Value & Volume) 2020 & 2033
- Table 93: Global Maize Industry neww Revenue Million Forecast, by Export Market Analysis (Value & Volume) 2020 & 2033
- Table 94: Global Maize Industry neww Volume Kiloton Forecast, by Export Market Analysis (Value & Volume) 2020 & 2033
- Table 95: Global Maize Industry neww Revenue Million Forecast, by Price Trend Analysis 2020 & 2033
- Table 96: Global Maize Industry neww Volume Kiloton Forecast, by Price Trend Analysis 2020 & 2033
- Table 97: Global Maize Industry neww Revenue Million Forecast, by Country 2020 & 2033
- Table 98: Global Maize Industry neww Volume Kiloton Forecast, by Country 2020 & 2033
- Table 99: South Africa Maize Industry neww Revenue (Million) Forecast, by Application 2020 & 2033
- Table 100: South Africa Maize Industry neww Volume (Kiloton) Forecast, by Application 2020 & 2033
- Table 101: Nigeria Maize Industry neww Revenue (Million) Forecast, by Application 2020 & 2033
- Table 102: Nigeria Maize Industry neww Volume (Kiloton) Forecast, by Application 2020 & 2033
Frequently Asked Questions
1. What is the projected Compound Annual Growth Rate (CAGR) of the Maize Industry neww?
The projected CAGR is approximately 3.01%.
2. Which companies are prominent players in the Maize Industry neww?
Key companies in the market include ADM, Syngenta Crop Protection , Société Générale de Surveillance (SGS) , Bayer Crop Science , Bunge , Bunge Limited , Cargill, Incorporated , Corteva Agriscience , ADM , Olam Group .
3. What are the main segments of the Maize Industry neww?
The market segments include Production Analysis, Consumption Analysis, Import Market Analysis (Value & Volume), Export Market Analysis (Value & Volume), Price Trend Analysis.
4. Can you provide details about the market size?
The market size is estimated to be USD 143.62 Million as of 2022.
5. What are some drivers contributing to market growth?
N/A
6. What are the notable trends driving market growth?
Increase in Demand for Animal-based Protein Sources.
7. Are there any restraints impacting market growth?
N/A
8. Can you provide examples of recent developments in the market?
October 2022: Ghana's President, Nana Addo Dankwa Akufo-Addo, inaugurated an ultramodern maize processing factory at Nsuta-Kwagye in the Sekyere-Central District of the Ashanti Region, as part of the "One District, One Factory" initiative. The facility is equipped with cutting-edge processing equipment, such as a maize drying plant, a grit milling machine, and many more.
9. What pricing options are available for accessing the report?
Pricing options include single-user, multi-user, and enterprise licenses priced at USD 4750, USD 5250, and USD 8750 respectively.
10. Is the market size provided in terms of value or volume?
The market size is provided in terms of value, measured in Million and volume, measured in Kiloton.
11. Are there any specific market keywords associated with the report?
Yes, the market keyword associated with the report is "Maize Industry neww," which aids in identifying and referencing the specific market segment covered.
12. How do I determine which pricing option suits my needs best?
The pricing options vary based on user requirements and access needs. Individual users may opt for single-user licenses, while businesses requiring broader access may choose multi-user or enterprise licenses for cost-effective access to the report.
13. Are there any additional resources or data provided in the Maize Industry neww report?
While the report offers comprehensive insights, it's advisable to review the specific contents or supplementary materials provided to ascertain if additional resources or data are available.
14. How can I stay updated on further developments or reports in the Maize Industry neww?
To stay informed about further developments, trends, and reports in the Maize Industry neww, consider subscribing to industry newsletters, following relevant companies and organizations, or regularly checking reputable industry news sources and publications.
Methodology
Step 1 - Identification of Relevant Samples Size from Population Database


Step 2 - Approaches for Defining Global Market Size (Value, Volume* & Price*)

Note*: In applicable scenarios
Step 3 - Data Sources
Primary Research
- Web Analytics
- Survey Reports
- Research Institute
- Latest Research Reports
- Opinion Leaders
Secondary Research
- Annual Reports
- White Paper
- Latest Press Release
- Industry Association
- Paid Database
- Investor Presentations

Step 4 - Data Triangulation
Involves using different sources of information in order to increase the validity of a study
These sources are likely to be stakeholders in a program - participants, other researchers, program staff, other community members, and so on.
Then we put all data in single framework & apply various statistical tools to find out the dynamic on the market.
During the analysis stage, feedback from the stakeholder groups would be compared to determine areas of agreement as well as areas of divergence