

Key Insights
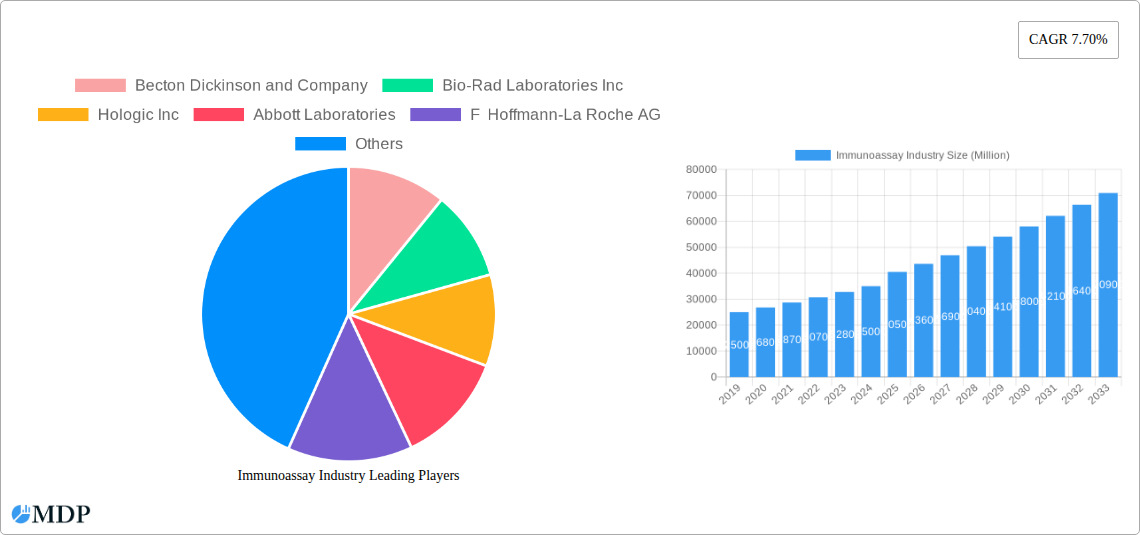
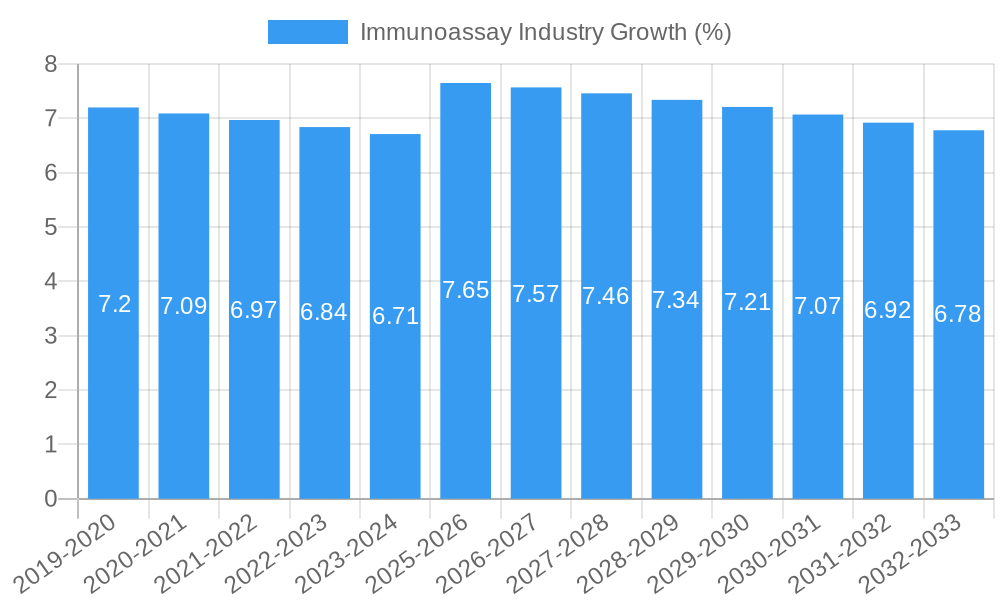
The global Immunoassay Market is poised for significant expansion, projected to reach a market size of approximately $40,500 million by 2025, with a robust Compound Annual Growth Rate (CAGR) of 7.70% anticipated through 2033. This dynamic growth is fueled by a confluence of factors, primarily driven by the increasing prevalence of chronic diseases worldwide, the continuous demand for accurate and rapid diagnostic solutions, and substantial investments in research and development by leading pharmaceutical and biotechnology firms. The growing emphasis on early disease detection and personalized medicine further bolsters the market. Technological advancements, particularly in developing more sensitive and specific immunoassay techniques like CLIA and FIA, are enhancing diagnostic capabilities and expanding their applications across various medical fields, from infectious disease screening to oncology and endocrinology. The rising adoption of automated immunoassay systems in clinical laboratories is also contributing to market expansion by improving efficiency and throughput.
The immunoassay landscape is characterized by a diverse range of applications, with Disease Diagnosis standing out as a dominant segment, driven by the need for effective management of conditions such as diabetes, cardiovascular diseases, and various infections. Therapeutic Drug Monitoring (TDM) is another crucial application, ensuring optimal drug efficacy and minimizing toxicity, which is particularly vital in fields like transplantation and critical care. The market is segmented by immunoassay type, with Enzyme Immunoassays (EIA) and Chemiluminescence Immunoassays (CLIA) holding substantial shares due to their accuracy, sensitivity, and cost-effectiveness. The increasing integration of immunoassay platforms with advanced data analytics and artificial intelligence is expected to unlock new opportunities for drug discovery and development. Key players such as Abbott Laboratories, F. Hoffmann-La Roche AG, and Thermo Fisher Scientific are actively innovating and expanding their product portfolios to cater to the evolving needs of hospitals, clinical laboratories, and pharmaceutical companies, solidifying their positions in this competitive market.
Dive deep into the dynamic Immunoassay Industry with our in-depth market analysis, spanning from 2019 to 2033. This report provides critical insights into market dynamics, emerging trends, leading players, and future opportunities, offering actionable intelligence for industry stakeholders. With a base year of 2025 and a forecast period from 2025 to 2033, this comprehensive study covers the historical period of 2019–2024, ensuring a complete understanding of market evolution.
Immunoassay Industry Market Dynamics & Concentration
The global Immunoassay Industry is characterized by a moderate to high level of market concentration, driven by significant investments in research and development and the consolidation of key players. Innovation drivers are primarily fueled by the demand for faster, more accurate, and point-of-care diagnostic solutions, especially for infectious diseases and chronic conditions. Regulatory frameworks, overseen by bodies like the FDA and EMA, play a crucial role in approving new immunoassay technologies and diagnostic kits, influencing market entry and product lifecycle. Product substitutes, though present in some clinical chemistry applications, offer limited direct competition to the specificity and sensitivity of immunoassay techniques. End-user trends indicate a growing preference for automated systems in clinical laboratories and a rising adoption in pharmaceutical and biotechnology companies for drug discovery and development. Mergers and acquisitions (M&A) are a significant aspect of market dynamics, with an estimated xx M&A deal counts observed during the historical period, aimed at expanding product portfolios and geographic reach. Market share analysis reveals that companies like Abbott Laboratories and F Hoffmann-La Roche AG hold substantial portions, driven by their comprehensive immunoassay platforms and extensive test menus.
Immunoassay Industry Industry Trends & Analysis
The Immunoassay Industry is experiencing robust growth, projected to achieve a Compound Annual Growth Rate (CAGR) of xx% during the forecast period. This expansion is largely propelled by the increasing prevalence of chronic diseases such as cancer, cardiovascular diseases, and infectious diseases, which necessitate accurate and timely diagnostic testing. Technological advancements are at the forefront, with the continuous development of novel immunoassay techniques like Chemiluminescence Immunoassay (CLIA) and Fluoroimmnoassay (FIA) offering enhanced sensitivity, specificity, and faster turnaround times compared to traditional methods like Radioimmunoassay (RIA) and Enzyme Immunoassays (EIA). The growing adoption of point-of-care testing (POCT) is another significant trend, enabling rapid diagnostics outside of traditional laboratory settings, particularly in remote areas and emergency situations. Consumer preferences are shifting towards personalized medicine, requiring highly specific biomarkers detected through immunoassays for targeted therapies. Competitive dynamics are intense, with leading companies investing heavily in R&D to develop next-generation immunoassay platforms and expanding their test portfolios to cater to a wider range of applications. Market penetration for advanced immunoassay systems is steadily increasing across developed and emerging economies, driven by a growing awareness of early disease detection and management. The integration of artificial intelligence and machine learning with immunoassay data is also emerging as a key trend, promising to improve diagnostic accuracy and predictive capabilities. The increasing outsourcing of diagnostic testing by pharmaceutical companies further fuels the demand for immunoassay services.
Leading Markets & Segments in Immunoassay Industry
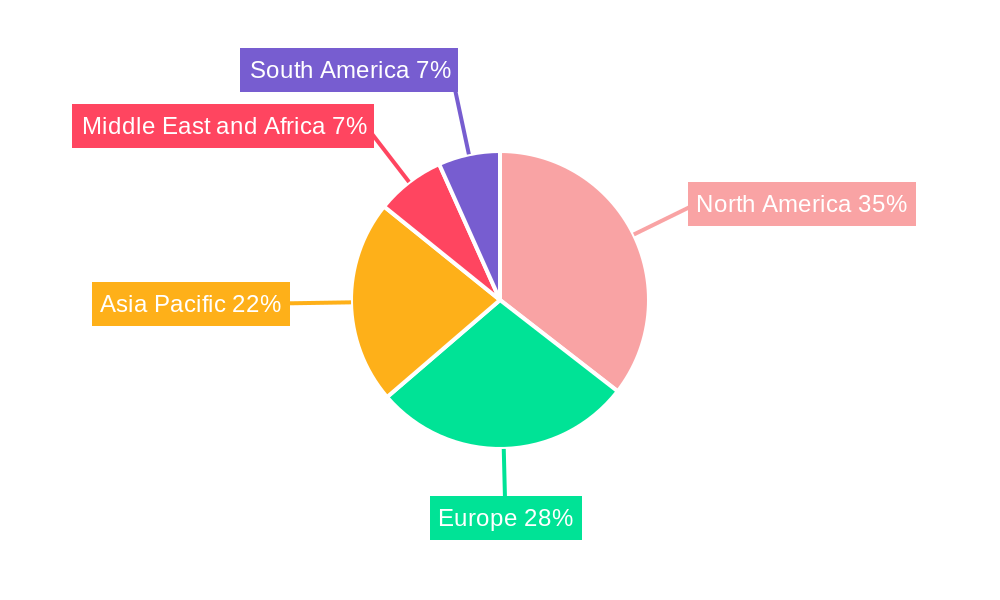
The North America region stands as the dominant market for Immunoassay Industry, with the United States leading in terms of market share and consumption. This dominance is attributed to several factors:
- Advanced Healthcare Infrastructure: The presence of well-established hospitals, cutting-edge research institutions, and a high density of clinical laboratories facilitate the widespread adoption of advanced immunoassay technologies.
- High Healthcare Expenditure: Significant investments in healthcare, both public and private, enable greater access to sophisticated diagnostic tools and treatments.
- Favorable Regulatory Environment: A streamlined regulatory process for new diagnostic tests and devices, coupled with strong intellectual property protection, encourages innovation and market entry.
- Prevalence of Chronic Diseases: A high incidence of chronic diseases, including cancer and autoimmune disorders, drives the demand for routine and specialized immunoassay testing.
Within the Type segment, Chemiluminescence Immunoassay (CLIA) is the leading technology due to its superior sensitivity, speed, and cost-effectiveness, making it a preferred choice for a wide array of diagnostic tests. The Application segment is dominated by Disease Diagnosis, encompassing the detection of infectious diseases, cancer biomarkers, cardiac markers, and hormonal imbalances. This is directly linked to the growing global burden of diseases and the emphasis on early intervention. In the End User segment, Hospitals represent the largest market share, owing to their comprehensive diagnostic facilities and high patient volumes.
Key Drivers in Type (CLIA):
- High sensitivity and specificity for biomarker detection.
- Faster assay development and shorter turnaround times.
- Automation compatibility for high-throughput laboratories.
- Cost-effectiveness compared to some other advanced immunoassay formats.
Key Drivers in Application (Disease Diagnosis):
- Increasing global prevalence of chronic and infectious diseases.
- Growing demand for early and accurate disease detection.
- Advancements in identifying novel disease biomarkers.
- Rising awareness among patients and healthcare providers regarding the importance of diagnostic testing.
Key Drivers in End User (Hospitals):
- High patient volume and diverse diagnostic needs.
- On-site laboratory infrastructure for immediate results.
- Integration of immunoassay testing into patient management pathways.
- Investment in advanced diagnostic equipment for improved patient care.
Immunoassay Industry Product Developments
Product developments in the Immunoassay Industry are characterized by a relentless pursuit of enhanced sensitivity, speed, and multiplexing capabilities. Companies are focusing on innovative immunoassay platforms that enable the simultaneous detection of multiple analytes from a single sample, reducing costs and improving efficiency. Key trends include the miniaturization of immunoassay devices for point-of-care applications, the development of novel labeling technologies for greater signal amplification, and the integration of automation and data analytics for more efficient workflow management. These advancements are crucial for addressing the growing demand for early disease detection, personalized medicine, and infectious disease surveillance, offering significant competitive advantages to early adopters.
Key Drivers of Immunoassay Industry Growth
The Immunoassay Industry's growth is significantly driven by several key factors. The rising global incidence of chronic diseases such as cancer, diabetes, and cardiovascular ailments necessitates advanced diagnostic tools, with immunoassays playing a pivotal role in early detection and management. Technological advancements, including the development of highly sensitive and specific immunoassay techniques like CLIA and FIA, coupled with the miniaturization of devices for point-of-care testing, are expanding the application scope and accessibility of these diagnostics. Furthermore, increasing healthcare expenditure in emerging economies and government initiatives promoting disease screening programs are contributing to market expansion. The growing demand for personalized medicine also fuels the need for precise biomarker detection offered by immunoassays.
Challenges in the Immunoassay Industry Market
Despite its robust growth, the Immunoassay Industry faces several challenges. High development costs associated with novel immunoassay platforms and reagents can be a significant barrier, particularly for smaller companies. Stringent regulatory approval processes in various regions can lead to lengthy market entry timelines. Furthermore, the intense competition among established players and the emergence of alternative diagnostic technologies present ongoing challenges. Issues related to the standardization of immunoassay results across different platforms and laboratories, as well as the limited availability of skilled personnel for operating sophisticated immunoassay systems, also pose hurdles to market expansion.
Emerging Opportunities in Immunoassay Industry
Emerging opportunities in the Immunoassay Industry are abundant, driven by technological breakthroughs and evolving healthcare needs. The increasing focus on personalized medicine and companion diagnostics presents a significant avenue for growth, requiring highly specific immunoassay tests to guide targeted therapies. The expansion of point-of-care testing (POCT) into novel applications, such as infectious disease outbreak monitoring and chronic disease management in remote settings, offers substantial market potential. Strategic partnerships between immunoassay manufacturers and pharmaceutical companies for drug discovery and clinical trials, as well as collaborations aimed at developing integrated diagnostic solutions, will further accelerate market expansion. The growing demand for advanced diagnostics in underserved markets also presents a considerable opportunity for global players.
Leading Players in the Immunoassay Industry Sector
- Abbott Laboratories
- F Hoffmann-La Roche AG
- Becton Dickinson and Company
- Bio-Rad Laboratories Inc
- Hologic Inc
- Agilent Technologies Inc
- Danaher Corporation (Beckman Coulter Inc)
- Qiagen NV
- Sysmex Corporation
- Thermo Fisher Scientific
- Luminex Corporation
- PerkinElmer Inc
Key Milestones in Immunoassay Industry Industry
- November 2022: Getein launched the MAGICL 6000 CLIA analyzer at MEDICA 2022. This compact and innovative CLIA analyzer is an optimal choice for mid to high-workflow laboratories requiring a one-step CLIA solution.
- November 2022: LumiraDx launched a rapid microfluidic immunoassay HbA1c test in Europe, parts of the Middle East, Asia, Latin America, and Africa, enhancing accessibility for diabetes management.
Strategic Outlook for Immunoassay Industry Market
The strategic outlook for the Immunoassay Industry remains exceptionally positive, driven by sustained demand for accurate and efficient diagnostic solutions. Future growth will be accelerated by continued investment in R&D for next-generation immunoassay technologies, focusing on multiplexing, ultra-high sensitivity, and AI integration. The expansion of point-of-care testing, particularly for infectious diseases and chronic condition management, represents a significant growth accelerator. Furthermore, strategic collaborations and mergers will continue to shape the market landscape, enabling companies to expand their product portfolios and geographic reach. The increasing adoption of personalized medicine and the growing focus on preventive healthcare globally will further fuel the demand for advanced immunoassay diagnostics, ensuring a dynamic and expanding market.
Immunoassay Industry Segmentation
-
1. Type
- 1.1. Radioimmunoassay (RIA)
- 1.2. Enzyme Immunoassays (EIA)
- 1.3. Fluoroimmnoassay (FIA)
- 1.4. Chemiluminescence Immunoassay (CLIA)
- 1.5. Others
-
2. Application
- 2.1. Disease Diagnosis
- 2.2. Therapeutic Drug Monitoring
- 2.3. Drug Discovery
- 2.4. Clinical Chemistry
- 2.5. Hematology
- 2.6. Others
-
3. End User
- 3.1. Hospitals
- 3.2. Pharma & Biotech Companies
- 3.3. Clinical Laboratories
- 3.4. Others
Immunoassay Industry Segmentation By Geography
-
1. North America
- 1.1. United States
- 1.2. Canada
- 1.3. Mexico
-
2. Europe
- 2.1. Germany
- 2.2. United Kingdom
- 2.3. France
- 2.4. Italy
- 2.5. Spain
- 2.6. Rest of Europe
-
3. Asia Pacific
- 3.1. China
- 3.2. Japan
- 3.3. India
- 3.4. Australia
- 3.5. South Korea
- 3.6. Rest of Asia Pacific
-
4. Middle East and Africa
- 4.1. GCC
- 4.2. South Africa
- 4.3. Rest of Middle East and Africa
-
5. South America
- 5.1. Brazil
- 5.2. Argentina
- 5.3. Rest of South America
Immunoassay Industry REPORT HIGHLIGHTS
| Aspects | Details |
|---|---|
| Study Period | 2019-2033 |
| Base Year | 2024 |
| Estimated Year | 2025 |
| Forecast Period | 2025-2033 |
| Historical Period | 2019-2024 |
| Growth Rate | CAGR of 7.70% from 2019-2033 |
| Segmentation |
|
Table of Contents
- 1. Introduction
- 1.1. Research Scope
- 1.2. Market Segmentation
- 1.3. Research Methodology
- 1.4. Definitions and Assumptions
- 2. Executive Summary
- 2.1. Introduction
- 3. Market Dynamics
- 3.1. Introduction
- 3.2. Market Drivers
- 3.2.1. High Sensitivity and Specificity of Immunoassays; Technological Advancements in Immunoassay Instruments; Increasing Prevalence of Chronic and Infectious Diseases
- 3.3. Market Restrains
- 3.3.1. Stringent Regulatory Scenario for Approval of Immunoassays; Complexity of Procedures
- 3.4. Market Trends
- 3.4.1. Enzyme Immunoassays (EIA) Segment is Expected to Hold Significant Market Share in Immunoassay Market
- 4. Market Factor Analysis
- 4.1. Porters Five Forces
- 4.2. Supply/Value Chain
- 4.3. PESTEL analysis
- 4.4. Market Entropy
- 4.5. Patent/Trademark Analysis
- 5. Global Immunoassay Industry Analysis, Insights and Forecast, 2019-2031
- 5.1. Market Analysis, Insights and Forecast - by Type
- 5.1.1. Radioimmunoassay (RIA)
- 5.1.2. Enzyme Immunoassays (EIA)
- 5.1.3. Fluoroimmnoassay (FIA)
- 5.1.4. Chemiluminescence Immunoassay (CLIA)
- 5.1.5. Others
- 5.2. Market Analysis, Insights and Forecast - by Application
- 5.2.1. Disease Diagnosis
- 5.2.2. Therapeutic Drug Monitoring
- 5.2.3. Drug Discovery
- 5.2.4. Clinical Chemistry
- 5.2.5. Hematology
- 5.2.6. Others
- 5.3. Market Analysis, Insights and Forecast - by End User
- 5.3.1. Hospitals
- 5.3.2. Pharma & Biotech Companies
- 5.3.3. Clinical Laboratories
- 5.3.4. Others
- 5.4. Market Analysis, Insights and Forecast - by Region
- 5.4.1. North America
- 5.4.2. Europe
- 5.4.3. Asia Pacific
- 5.4.4. Middle East and Africa
- 5.4.5. South America
- 5.1. Market Analysis, Insights and Forecast - by Type
- 6. North America Immunoassay Industry Analysis, Insights and Forecast, 2019-2031
- 6.1. Market Analysis, Insights and Forecast - by Type
- 6.1.1. Radioimmunoassay (RIA)
- 6.1.2. Enzyme Immunoassays (EIA)
- 6.1.3. Fluoroimmnoassay (FIA)
- 6.1.4. Chemiluminescence Immunoassay (CLIA)
- 6.1.5. Others
- 6.2. Market Analysis, Insights and Forecast - by Application
- 6.2.1. Disease Diagnosis
- 6.2.2. Therapeutic Drug Monitoring
- 6.2.3. Drug Discovery
- 6.2.4. Clinical Chemistry
- 6.2.5. Hematology
- 6.2.6. Others
- 6.3. Market Analysis, Insights and Forecast - by End User
- 6.3.1. Hospitals
- 6.3.2. Pharma & Biotech Companies
- 6.3.3. Clinical Laboratories
- 6.3.4. Others
- 6.1. Market Analysis, Insights and Forecast - by Type
- 7. Europe Immunoassay Industry Analysis, Insights and Forecast, 2019-2031
- 7.1. Market Analysis, Insights and Forecast - by Type
- 7.1.1. Radioimmunoassay (RIA)
- 7.1.2. Enzyme Immunoassays (EIA)
- 7.1.3. Fluoroimmnoassay (FIA)
- 7.1.4. Chemiluminescence Immunoassay (CLIA)
- 7.1.5. Others
- 7.2. Market Analysis, Insights and Forecast - by Application
- 7.2.1. Disease Diagnosis
- 7.2.2. Therapeutic Drug Monitoring
- 7.2.3. Drug Discovery
- 7.2.4. Clinical Chemistry
- 7.2.5. Hematology
- 7.2.6. Others
- 7.3. Market Analysis, Insights and Forecast - by End User
- 7.3.1. Hospitals
- 7.3.2. Pharma & Biotech Companies
- 7.3.3. Clinical Laboratories
- 7.3.4. Others
- 7.1. Market Analysis, Insights and Forecast - by Type
- 8. Asia Pacific Immunoassay Industry Analysis, Insights and Forecast, 2019-2031
- 8.1. Market Analysis, Insights and Forecast - by Type
- 8.1.1. Radioimmunoassay (RIA)
- 8.1.2. Enzyme Immunoassays (EIA)
- 8.1.3. Fluoroimmnoassay (FIA)
- 8.1.4. Chemiluminescence Immunoassay (CLIA)
- 8.1.5. Others
- 8.2. Market Analysis, Insights and Forecast - by Application
- 8.2.1. Disease Diagnosis
- 8.2.2. Therapeutic Drug Monitoring
- 8.2.3. Drug Discovery
- 8.2.4. Clinical Chemistry
- 8.2.5. Hematology
- 8.2.6. Others
- 8.3. Market Analysis, Insights and Forecast - by End User
- 8.3.1. Hospitals
- 8.3.2. Pharma & Biotech Companies
- 8.3.3. Clinical Laboratories
- 8.3.4. Others
- 8.1. Market Analysis, Insights and Forecast - by Type
- 9. Middle East and Africa Immunoassay Industry Analysis, Insights and Forecast, 2019-2031
- 9.1. Market Analysis, Insights and Forecast - by Type
- 9.1.1. Radioimmunoassay (RIA)
- 9.1.2. Enzyme Immunoassays (EIA)
- 9.1.3. Fluoroimmnoassay (FIA)
- 9.1.4. Chemiluminescence Immunoassay (CLIA)
- 9.1.5. Others
- 9.2. Market Analysis, Insights and Forecast - by Application
- 9.2.1. Disease Diagnosis
- 9.2.2. Therapeutic Drug Monitoring
- 9.2.3. Drug Discovery
- 9.2.4. Clinical Chemistry
- 9.2.5. Hematology
- 9.2.6. Others
- 9.3. Market Analysis, Insights and Forecast - by End User
- 9.3.1. Hospitals
- 9.3.2. Pharma & Biotech Companies
- 9.3.3. Clinical Laboratories
- 9.3.4. Others
- 9.1. Market Analysis, Insights and Forecast - by Type
- 10. South America Immunoassay Industry Analysis, Insights and Forecast, 2019-2031
- 10.1. Market Analysis, Insights and Forecast - by Type
- 10.1.1. Radioimmunoassay (RIA)
- 10.1.2. Enzyme Immunoassays (EIA)
- 10.1.3. Fluoroimmnoassay (FIA)
- 10.1.4. Chemiluminescence Immunoassay (CLIA)
- 10.1.5. Others
- 10.2. Market Analysis, Insights and Forecast - by Application
- 10.2.1. Disease Diagnosis
- 10.2.2. Therapeutic Drug Monitoring
- 10.2.3. Drug Discovery
- 10.2.4. Clinical Chemistry
- 10.2.5. Hematology
- 10.2.6. Others
- 10.3. Market Analysis, Insights and Forecast - by End User
- 10.3.1. Hospitals
- 10.3.2. Pharma & Biotech Companies
- 10.3.3. Clinical Laboratories
- 10.3.4. Others
- 10.1. Market Analysis, Insights and Forecast - by Type
- 11. North America Immunoassay Industry Analysis, Insights and Forecast, 2019-2031
- 11.1. Market Analysis, Insights and Forecast - By Country/Sub-region
- 11.1.1 United States
- 11.1.2 Canada
- 11.1.3 Mexico
- 12. Europe Immunoassay Industry Analysis, Insights and Forecast, 2019-2031
- 12.1. Market Analysis, Insights and Forecast - By Country/Sub-region
- 12.1.1 Germany
- 12.1.2 United Kingdom
- 12.1.3 France
- 12.1.4 Italy
- 12.1.5 Spain
- 12.1.6 Rest of Europe
- 13. Asia Pacific Immunoassay Industry Analysis, Insights and Forecast, 2019-2031
- 13.1. Market Analysis, Insights and Forecast - By Country/Sub-region
- 13.1.1 China
- 13.1.2 Japan
- 13.1.3 India
- 13.1.4 Australia
- 13.1.5 South Korea
- 13.1.6 Rest of Asia Pacific
- 14. Middle East and Africa Immunoassay Industry Analysis, Insights and Forecast, 2019-2031
- 14.1. Market Analysis, Insights and Forecast - By Country/Sub-region
- 14.1.1 GCC
- 14.1.2 South Africa
- 14.1.3 Rest of Middle East and Africa
- 15. South America Immunoassay Industry Analysis, Insights and Forecast, 2019-2031
- 15.1. Market Analysis, Insights and Forecast - By Country/Sub-region
- 15.1.1 Brazil
- 15.1.2 Argentina
- 15.1.3 Rest of South America
- 16. Competitive Analysis
- 16.1. Global Market Share Analysis 2024
- 16.2. Company Profiles
- 16.2.1 Becton Dickinson and Company
- 16.2.1.1. Overview
- 16.2.1.2. Products
- 16.2.1.3. SWOT Analysis
- 16.2.1.4. Recent Developments
- 16.2.1.5. Financials (Based on Availability)
- 16.2.2 Bio-Rad Laboratories Inc
- 16.2.2.1. Overview
- 16.2.2.2. Products
- 16.2.2.3. SWOT Analysis
- 16.2.2.4. Recent Developments
- 16.2.2.5. Financials (Based on Availability)
- 16.2.3 Hologic Inc
- 16.2.3.1. Overview
- 16.2.3.2. Products
- 16.2.3.3. SWOT Analysis
- 16.2.3.4. Recent Developments
- 16.2.3.5. Financials (Based on Availability)
- 16.2.4 Abbott Laboratories
- 16.2.4.1. Overview
- 16.2.4.2. Products
- 16.2.4.3. SWOT Analysis
- 16.2.4.4. Recent Developments
- 16.2.4.5. Financials (Based on Availability)
- 16.2.5 F Hoffmann-La Roche AG
- 16.2.5.1. Overview
- 16.2.5.2. Products
- 16.2.5.3. SWOT Analysis
- 16.2.5.4. Recent Developments
- 16.2.5.5. Financials (Based on Availability)
- 16.2.6 Agilent Technologies Inc
- 16.2.6.1. Overview
- 16.2.6.2. Products
- 16.2.6.3. SWOT Analysis
- 16.2.6.4. Recent Developments
- 16.2.6.5. Financials (Based on Availability)
- 16.2.7 Danaher Corporation (Beckman Coulter Inc)
- 16.2.7.1. Overview
- 16.2.7.2. Products
- 16.2.7.3. SWOT Analysis
- 16.2.7.4. Recent Developments
- 16.2.7.5. Financials (Based on Availability)
- 16.2.8 Qiagen NV
- 16.2.8.1. Overview
- 16.2.8.2. Products
- 16.2.8.3. SWOT Analysis
- 16.2.8.4. Recent Developments
- 16.2.8.5. Financials (Based on Availability)
- 16.2.9 Sysmex Corporation
- 16.2.9.1. Overview
- 16.2.9.2. Products
- 16.2.9.3. SWOT Analysis
- 16.2.9.4. Recent Developments
- 16.2.9.5. Financials (Based on Availability)
- 16.2.10 Thermo Fisher Scientific
- 16.2.10.1. Overview
- 16.2.10.2. Products
- 16.2.10.3. SWOT Analysis
- 16.2.10.4. Recent Developments
- 16.2.10.5. Financials (Based on Availability)
- 16.2.11 Luminex Corporation
- 16.2.11.1. Overview
- 16.2.11.2. Products
- 16.2.11.3. SWOT Analysis
- 16.2.11.4. Recent Developments
- 16.2.11.5. Financials (Based on Availability)
- 16.2.12 PerkinElmer Inc
- 16.2.12.1. Overview
- 16.2.12.2. Products
- 16.2.12.3. SWOT Analysis
- 16.2.12.4. Recent Developments
- 16.2.12.5. Financials (Based on Availability)
- 16.2.1 Becton Dickinson and Company
List of Figures
- Figure 1: Global Immunoassay Industry Revenue Breakdown (Million, %) by Region 2024 & 2032
- Figure 2: Global Immunoassay Industry Volume Breakdown (K Unit, %) by Region 2024 & 2032
- Figure 3: North America Immunoassay Industry Revenue (Million), by Country 2024 & 2032
- Figure 4: North America Immunoassay Industry Volume (K Unit), by Country 2024 & 2032
- Figure 5: North America Immunoassay Industry Revenue Share (%), by Country 2024 & 2032
- Figure 6: North America Immunoassay Industry Volume Share (%), by Country 2024 & 2032
- Figure 7: Europe Immunoassay Industry Revenue (Million), by Country 2024 & 2032
- Figure 8: Europe Immunoassay Industry Volume (K Unit), by Country 2024 & 2032
- Figure 9: Europe Immunoassay Industry Revenue Share (%), by Country 2024 & 2032
- Figure 10: Europe Immunoassay Industry Volume Share (%), by Country 2024 & 2032
- Figure 11: Asia Pacific Immunoassay Industry Revenue (Million), by Country 2024 & 2032
- Figure 12: Asia Pacific Immunoassay Industry Volume (K Unit), by Country 2024 & 2032
- Figure 13: Asia Pacific Immunoassay Industry Revenue Share (%), by Country 2024 & 2032
- Figure 14: Asia Pacific Immunoassay Industry Volume Share (%), by Country 2024 & 2032
- Figure 15: Middle East and Africa Immunoassay Industry Revenue (Million), by Country 2024 & 2032
- Figure 16: Middle East and Africa Immunoassay Industry Volume (K Unit), by Country 2024 & 2032
- Figure 17: Middle East and Africa Immunoassay Industry Revenue Share (%), by Country 2024 & 2032
- Figure 18: Middle East and Africa Immunoassay Industry Volume Share (%), by Country 2024 & 2032
- Figure 19: South America Immunoassay Industry Revenue (Million), by Country 2024 & 2032
- Figure 20: South America Immunoassay Industry Volume (K Unit), by Country 2024 & 2032
- Figure 21: South America Immunoassay Industry Revenue Share (%), by Country 2024 & 2032
- Figure 22: South America Immunoassay Industry Volume Share (%), by Country 2024 & 2032
- Figure 23: North America Immunoassay Industry Revenue (Million), by Type 2024 & 2032
- Figure 24: North America Immunoassay Industry Volume (K Unit), by Type 2024 & 2032
- Figure 25: North America Immunoassay Industry Revenue Share (%), by Type 2024 & 2032
- Figure 26: North America Immunoassay Industry Volume Share (%), by Type 2024 & 2032
- Figure 27: North America Immunoassay Industry Revenue (Million), by Application 2024 & 2032
- Figure 28: North America Immunoassay Industry Volume (K Unit), by Application 2024 & 2032
- Figure 29: North America Immunoassay Industry Revenue Share (%), by Application 2024 & 2032
- Figure 30: North America Immunoassay Industry Volume Share (%), by Application 2024 & 2032
- Figure 31: North America Immunoassay Industry Revenue (Million), by End User 2024 & 2032
- Figure 32: North America Immunoassay Industry Volume (K Unit), by End User 2024 & 2032
- Figure 33: North America Immunoassay Industry Revenue Share (%), by End User 2024 & 2032
- Figure 34: North America Immunoassay Industry Volume Share (%), by End User 2024 & 2032
- Figure 35: North America Immunoassay Industry Revenue (Million), by Country 2024 & 2032
- Figure 36: North America Immunoassay Industry Volume (K Unit), by Country 2024 & 2032
- Figure 37: North America Immunoassay Industry Revenue Share (%), by Country 2024 & 2032
- Figure 38: North America Immunoassay Industry Volume Share (%), by Country 2024 & 2032
- Figure 39: Europe Immunoassay Industry Revenue (Million), by Type 2024 & 2032
- Figure 40: Europe Immunoassay Industry Volume (K Unit), by Type 2024 & 2032
- Figure 41: Europe Immunoassay Industry Revenue Share (%), by Type 2024 & 2032
- Figure 42: Europe Immunoassay Industry Volume Share (%), by Type 2024 & 2032
- Figure 43: Europe Immunoassay Industry Revenue (Million), by Application 2024 & 2032
- Figure 44: Europe Immunoassay Industry Volume (K Unit), by Application 2024 & 2032
- Figure 45: Europe Immunoassay Industry Revenue Share (%), by Application 2024 & 2032
- Figure 46: Europe Immunoassay Industry Volume Share (%), by Application 2024 & 2032
- Figure 47: Europe Immunoassay Industry Revenue (Million), by End User 2024 & 2032
- Figure 48: Europe Immunoassay Industry Volume (K Unit), by End User 2024 & 2032
- Figure 49: Europe Immunoassay Industry Revenue Share (%), by End User 2024 & 2032
- Figure 50: Europe Immunoassay Industry Volume Share (%), by End User 2024 & 2032
- Figure 51: Europe Immunoassay Industry Revenue (Million), by Country 2024 & 2032
- Figure 52: Europe Immunoassay Industry Volume (K Unit), by Country 2024 & 2032
- Figure 53: Europe Immunoassay Industry Revenue Share (%), by Country 2024 & 2032
- Figure 54: Europe Immunoassay Industry Volume Share (%), by Country 2024 & 2032
- Figure 55: Asia Pacific Immunoassay Industry Revenue (Million), by Type 2024 & 2032
- Figure 56: Asia Pacific Immunoassay Industry Volume (K Unit), by Type 2024 & 2032
- Figure 57: Asia Pacific Immunoassay Industry Revenue Share (%), by Type 2024 & 2032
- Figure 58: Asia Pacific Immunoassay Industry Volume Share (%), by Type 2024 & 2032
- Figure 59: Asia Pacific Immunoassay Industry Revenue (Million), by Application 2024 & 2032
- Figure 60: Asia Pacific Immunoassay Industry Volume (K Unit), by Application 2024 & 2032
- Figure 61: Asia Pacific Immunoassay Industry Revenue Share (%), by Application 2024 & 2032
- Figure 62: Asia Pacific Immunoassay Industry Volume Share (%), by Application 2024 & 2032
- Figure 63: Asia Pacific Immunoassay Industry Revenue (Million), by End User 2024 & 2032
- Figure 64: Asia Pacific Immunoassay Industry Volume (K Unit), by End User 2024 & 2032
- Figure 65: Asia Pacific Immunoassay Industry Revenue Share (%), by End User 2024 & 2032
- Figure 66: Asia Pacific Immunoassay Industry Volume Share (%), by End User 2024 & 2032
- Figure 67: Asia Pacific Immunoassay Industry Revenue (Million), by Country 2024 & 2032
- Figure 68: Asia Pacific Immunoassay Industry Volume (K Unit), by Country 2024 & 2032
- Figure 69: Asia Pacific Immunoassay Industry Revenue Share (%), by Country 2024 & 2032
- Figure 70: Asia Pacific Immunoassay Industry Volume Share (%), by Country 2024 & 2032
- Figure 71: Middle East and Africa Immunoassay Industry Revenue (Million), by Type 2024 & 2032
- Figure 72: Middle East and Africa Immunoassay Industry Volume (K Unit), by Type 2024 & 2032
- Figure 73: Middle East and Africa Immunoassay Industry Revenue Share (%), by Type 2024 & 2032
- Figure 74: Middle East and Africa Immunoassay Industry Volume Share (%), by Type 2024 & 2032
- Figure 75: Middle East and Africa Immunoassay Industry Revenue (Million), by Application 2024 & 2032
- Figure 76: Middle East and Africa Immunoassay Industry Volume (K Unit), by Application 2024 & 2032
- Figure 77: Middle East and Africa Immunoassay Industry Revenue Share (%), by Application 2024 & 2032
- Figure 78: Middle East and Africa Immunoassay Industry Volume Share (%), by Application 2024 & 2032
- Figure 79: Middle East and Africa Immunoassay Industry Revenue (Million), by End User 2024 & 2032
- Figure 80: Middle East and Africa Immunoassay Industry Volume (K Unit), by End User 2024 & 2032
- Figure 81: Middle East and Africa Immunoassay Industry Revenue Share (%), by End User 2024 & 2032
- Figure 82: Middle East and Africa Immunoassay Industry Volume Share (%), by End User 2024 & 2032
- Figure 83: Middle East and Africa Immunoassay Industry Revenue (Million), by Country 2024 & 2032
- Figure 84: Middle East and Africa Immunoassay Industry Volume (K Unit), by Country 2024 & 2032
- Figure 85: Middle East and Africa Immunoassay Industry Revenue Share (%), by Country 2024 & 2032
- Figure 86: Middle East and Africa Immunoassay Industry Volume Share (%), by Country 2024 & 2032
- Figure 87: South America Immunoassay Industry Revenue (Million), by Type 2024 & 2032
- Figure 88: South America Immunoassay Industry Volume (K Unit), by Type 2024 & 2032
- Figure 89: South America Immunoassay Industry Revenue Share (%), by Type 2024 & 2032
- Figure 90: South America Immunoassay Industry Volume Share (%), by Type 2024 & 2032
- Figure 91: South America Immunoassay Industry Revenue (Million), by Application 2024 & 2032
- Figure 92: South America Immunoassay Industry Volume (K Unit), by Application 2024 & 2032
- Figure 93: South America Immunoassay Industry Revenue Share (%), by Application 2024 & 2032
- Figure 94: South America Immunoassay Industry Volume Share (%), by Application 2024 & 2032
- Figure 95: South America Immunoassay Industry Revenue (Million), by End User 2024 & 2032
- Figure 96: South America Immunoassay Industry Volume (K Unit), by End User 2024 & 2032
- Figure 97: South America Immunoassay Industry Revenue Share (%), by End User 2024 & 2032
- Figure 98: South America Immunoassay Industry Volume Share (%), by End User 2024 & 2032
- Figure 99: South America Immunoassay Industry Revenue (Million), by Country 2024 & 2032
- Figure 100: South America Immunoassay Industry Volume (K Unit), by Country 2024 & 2032
- Figure 101: South America Immunoassay Industry Revenue Share (%), by Country 2024 & 2032
- Figure 102: South America Immunoassay Industry Volume Share (%), by Country 2024 & 2032
List of Tables
- Table 1: Global Immunoassay Industry Revenue Million Forecast, by Region 2019 & 2032
- Table 2: Global Immunoassay Industry Volume K Unit Forecast, by Region 2019 & 2032
- Table 3: Global Immunoassay Industry Revenue Million Forecast, by Type 2019 & 2032
- Table 4: Global Immunoassay Industry Volume K Unit Forecast, by Type 2019 & 2032
- Table 5: Global Immunoassay Industry Revenue Million Forecast, by Application 2019 & 2032
- Table 6: Global Immunoassay Industry Volume K Unit Forecast, by Application 2019 & 2032
- Table 7: Global Immunoassay Industry Revenue Million Forecast, by End User 2019 & 2032
- Table 8: Global Immunoassay Industry Volume K Unit Forecast, by End User 2019 & 2032
- Table 9: Global Immunoassay Industry Revenue Million Forecast, by Region 2019 & 2032
- Table 10: Global Immunoassay Industry Volume K Unit Forecast, by Region 2019 & 2032
- Table 11: Global Immunoassay Industry Revenue Million Forecast, by Country 2019 & 2032
- Table 12: Global Immunoassay Industry Volume K Unit Forecast, by Country 2019 & 2032
- Table 13: United States Immunoassay Industry Revenue (Million) Forecast, by Application 2019 & 2032
- Table 14: United States Immunoassay Industry Volume (K Unit) Forecast, by Application 2019 & 2032
- Table 15: Canada Immunoassay Industry Revenue (Million) Forecast, by Application 2019 & 2032
- Table 16: Canada Immunoassay Industry Volume (K Unit) Forecast, by Application 2019 & 2032
- Table 17: Mexico Immunoassay Industry Revenue (Million) Forecast, by Application 2019 & 2032
- Table 18: Mexico Immunoassay Industry Volume (K Unit) Forecast, by Application 2019 & 2032
- Table 19: Global Immunoassay Industry Revenue Million Forecast, by Country 2019 & 2032
- Table 20: Global Immunoassay Industry Volume K Unit Forecast, by Country 2019 & 2032
- Table 21: Germany Immunoassay Industry Revenue (Million) Forecast, by Application 2019 & 2032
- Table 22: Germany Immunoassay Industry Volume (K Unit) Forecast, by Application 2019 & 2032
- Table 23: United Kingdom Immunoassay Industry Revenue (Million) Forecast, by Application 2019 & 2032
- Table 24: United Kingdom Immunoassay Industry Volume (K Unit) Forecast, by Application 2019 & 2032
- Table 25: France Immunoassay Industry Revenue (Million) Forecast, by Application 2019 & 2032
- Table 26: France Immunoassay Industry Volume (K Unit) Forecast, by Application 2019 & 2032
- Table 27: Italy Immunoassay Industry Revenue (Million) Forecast, by Application 2019 & 2032
- Table 28: Italy Immunoassay Industry Volume (K Unit) Forecast, by Application 2019 & 2032
- Table 29: Spain Immunoassay Industry Revenue (Million) Forecast, by Application 2019 & 2032
- Table 30: Spain Immunoassay Industry Volume (K Unit) Forecast, by Application 2019 & 2032
- Table 31: Rest of Europe Immunoassay Industry Revenue (Million) Forecast, by Application 2019 & 2032
- Table 32: Rest of Europe Immunoassay Industry Volume (K Unit) Forecast, by Application 2019 & 2032
- Table 33: Global Immunoassay Industry Revenue Million Forecast, by Country 2019 & 2032
- Table 34: Global Immunoassay Industry Volume K Unit Forecast, by Country 2019 & 2032
- Table 35: China Immunoassay Industry Revenue (Million) Forecast, by Application 2019 & 2032
- Table 36: China Immunoassay Industry Volume (K Unit) Forecast, by Application 2019 & 2032
- Table 37: Japan Immunoassay Industry Revenue (Million) Forecast, by Application 2019 & 2032
- Table 38: Japan Immunoassay Industry Volume (K Unit) Forecast, by Application 2019 & 2032
- Table 39: India Immunoassay Industry Revenue (Million) Forecast, by Application 2019 & 2032
- Table 40: India Immunoassay Industry Volume (K Unit) Forecast, by Application 2019 & 2032
- Table 41: Australia Immunoassay Industry Revenue (Million) Forecast, by Application 2019 & 2032
- Table 42: Australia Immunoassay Industry Volume (K Unit) Forecast, by Application 2019 & 2032
- Table 43: South Korea Immunoassay Industry Revenue (Million) Forecast, by Application 2019 & 2032
- Table 44: South Korea Immunoassay Industry Volume (K Unit) Forecast, by Application 2019 & 2032
- Table 45: Rest of Asia Pacific Immunoassay Industry Revenue (Million) Forecast, by Application 2019 & 2032
- Table 46: Rest of Asia Pacific Immunoassay Industry Volume (K Unit) Forecast, by Application 2019 & 2032
- Table 47: Global Immunoassay Industry Revenue Million Forecast, by Country 2019 & 2032
- Table 48: Global Immunoassay Industry Volume K Unit Forecast, by Country 2019 & 2032
- Table 49: GCC Immunoassay Industry Revenue (Million) Forecast, by Application 2019 & 2032
- Table 50: GCC Immunoassay Industry Volume (K Unit) Forecast, by Application 2019 & 2032
- Table 51: South Africa Immunoassay Industry Revenue (Million) Forecast, by Application 2019 & 2032
- Table 52: South Africa Immunoassay Industry Volume (K Unit) Forecast, by Application 2019 & 2032
- Table 53: Rest of Middle East and Africa Immunoassay Industry Revenue (Million) Forecast, by Application 2019 & 2032
- Table 54: Rest of Middle East and Africa Immunoassay Industry Volume (K Unit) Forecast, by Application 2019 & 2032
- Table 55: Global Immunoassay Industry Revenue Million Forecast, by Country 2019 & 2032
- Table 56: Global Immunoassay Industry Volume K Unit Forecast, by Country 2019 & 2032
- Table 57: Brazil Immunoassay Industry Revenue (Million) Forecast, by Application 2019 & 2032
- Table 58: Brazil Immunoassay Industry Volume (K Unit) Forecast, by Application 2019 & 2032
- Table 59: Argentina Immunoassay Industry Revenue (Million) Forecast, by Application 2019 & 2032
- Table 60: Argentina Immunoassay Industry Volume (K Unit) Forecast, by Application 2019 & 2032
- Table 61: Rest of South America Immunoassay Industry Revenue (Million) Forecast, by Application 2019 & 2032
- Table 62: Rest of South America Immunoassay Industry Volume (K Unit) Forecast, by Application 2019 & 2032
- Table 63: Global Immunoassay Industry Revenue Million Forecast, by Type 2019 & 2032
- Table 64: Global Immunoassay Industry Volume K Unit Forecast, by Type 2019 & 2032
- Table 65: Global Immunoassay Industry Revenue Million Forecast, by Application 2019 & 2032
- Table 66: Global Immunoassay Industry Volume K Unit Forecast, by Application 2019 & 2032
- Table 67: Global Immunoassay Industry Revenue Million Forecast, by End User 2019 & 2032
- Table 68: Global Immunoassay Industry Volume K Unit Forecast, by End User 2019 & 2032
- Table 69: Global Immunoassay Industry Revenue Million Forecast, by Country 2019 & 2032
- Table 70: Global Immunoassay Industry Volume K Unit Forecast, by Country 2019 & 2032
- Table 71: United States Immunoassay Industry Revenue (Million) Forecast, by Application 2019 & 2032
- Table 72: United States Immunoassay Industry Volume (K Unit) Forecast, by Application 2019 & 2032
- Table 73: Canada Immunoassay Industry Revenue (Million) Forecast, by Application 2019 & 2032
- Table 74: Canada Immunoassay Industry Volume (K Unit) Forecast, by Application 2019 & 2032
- Table 75: Mexico Immunoassay Industry Revenue (Million) Forecast, by Application 2019 & 2032
- Table 76: Mexico Immunoassay Industry Volume (K Unit) Forecast, by Application 2019 & 2032
- Table 77: Global Immunoassay Industry Revenue Million Forecast, by Type 2019 & 2032
- Table 78: Global Immunoassay Industry Volume K Unit Forecast, by Type 2019 & 2032
- Table 79: Global Immunoassay Industry Revenue Million Forecast, by Application 2019 & 2032
- Table 80: Global Immunoassay Industry Volume K Unit Forecast, by Application 2019 & 2032
- Table 81: Global Immunoassay Industry Revenue Million Forecast, by End User 2019 & 2032
- Table 82: Global Immunoassay Industry Volume K Unit Forecast, by End User 2019 & 2032
- Table 83: Global Immunoassay Industry Revenue Million Forecast, by Country 2019 & 2032
- Table 84: Global Immunoassay Industry Volume K Unit Forecast, by Country 2019 & 2032
- Table 85: Germany Immunoassay Industry Revenue (Million) Forecast, by Application 2019 & 2032
- Table 86: Germany Immunoassay Industry Volume (K Unit) Forecast, by Application 2019 & 2032
- Table 87: United Kingdom Immunoassay Industry Revenue (Million) Forecast, by Application 2019 & 2032
- Table 88: United Kingdom Immunoassay Industry Volume (K Unit) Forecast, by Application 2019 & 2032
- Table 89: France Immunoassay Industry Revenue (Million) Forecast, by Application 2019 & 2032
- Table 90: France Immunoassay Industry Volume (K Unit) Forecast, by Application 2019 & 2032
- Table 91: Italy Immunoassay Industry Revenue (Million) Forecast, by Application 2019 & 2032
- Table 92: Italy Immunoassay Industry Volume (K Unit) Forecast, by Application 2019 & 2032
- Table 93: Spain Immunoassay Industry Revenue (Million) Forecast, by Application 2019 & 2032
- Table 94: Spain Immunoassay Industry Volume (K Unit) Forecast, by Application 2019 & 2032
- Table 95: Rest of Europe Immunoassay Industry Revenue (Million) Forecast, by Application 2019 & 2032
- Table 96: Rest of Europe Immunoassay Industry Volume (K Unit) Forecast, by Application 2019 & 2032
- Table 97: Global Immunoassay Industry Revenue Million Forecast, by Type 2019 & 2032
- Table 98: Global Immunoassay Industry Volume K Unit Forecast, by Type 2019 & 2032
- Table 99: Global Immunoassay Industry Revenue Million Forecast, by Application 2019 & 2032
- Table 100: Global Immunoassay Industry Volume K Unit Forecast, by Application 2019 & 2032
- Table 101: Global Immunoassay Industry Revenue Million Forecast, by End User 2019 & 2032
- Table 102: Global Immunoassay Industry Volume K Unit Forecast, by End User 2019 & 2032
- Table 103: Global Immunoassay Industry Revenue Million Forecast, by Country 2019 & 2032
- Table 104: Global Immunoassay Industry Volume K Unit Forecast, by Country 2019 & 2032
- Table 105: China Immunoassay Industry Revenue (Million) Forecast, by Application 2019 & 2032
- Table 106: China Immunoassay Industry Volume (K Unit) Forecast, by Application 2019 & 2032
- Table 107: Japan Immunoassay Industry Revenue (Million) Forecast, by Application 2019 & 2032
- Table 108: Japan Immunoassay Industry Volume (K Unit) Forecast, by Application 2019 & 2032
- Table 109: India Immunoassay Industry Revenue (Million) Forecast, by Application 2019 & 2032
- Table 110: India Immunoassay Industry Volume (K Unit) Forecast, by Application 2019 & 2032
- Table 111: Australia Immunoassay Industry Revenue (Million) Forecast, by Application 2019 & 2032
- Table 112: Australia Immunoassay Industry Volume (K Unit) Forecast, by Application 2019 & 2032
- Table 113: South Korea Immunoassay Industry Revenue (Million) Forecast, by Application 2019 & 2032
- Table 114: South Korea Immunoassay Industry Volume (K Unit) Forecast, by Application 2019 & 2032
- Table 115: Rest of Asia Pacific Immunoassay Industry Revenue (Million) Forecast, by Application 2019 & 2032
- Table 116: Rest of Asia Pacific Immunoassay Industry Volume (K Unit) Forecast, by Application 2019 & 2032
- Table 117: Global Immunoassay Industry Revenue Million Forecast, by Type 2019 & 2032
- Table 118: Global Immunoassay Industry Volume K Unit Forecast, by Type 2019 & 2032
- Table 119: Global Immunoassay Industry Revenue Million Forecast, by Application 2019 & 2032
- Table 120: Global Immunoassay Industry Volume K Unit Forecast, by Application 2019 & 2032
- Table 121: Global Immunoassay Industry Revenue Million Forecast, by End User 2019 & 2032
- Table 122: Global Immunoassay Industry Volume K Unit Forecast, by End User 2019 & 2032
- Table 123: Global Immunoassay Industry Revenue Million Forecast, by Country 2019 & 2032
- Table 124: Global Immunoassay Industry Volume K Unit Forecast, by Country 2019 & 2032
- Table 125: GCC Immunoassay Industry Revenue (Million) Forecast, by Application 2019 & 2032
- Table 126: GCC Immunoassay Industry Volume (K Unit) Forecast, by Application 2019 & 2032
- Table 127: South Africa Immunoassay Industry Revenue (Million) Forecast, by Application 2019 & 2032
- Table 128: South Africa Immunoassay Industry Volume (K Unit) Forecast, by Application 2019 & 2032
- Table 129: Rest of Middle East and Africa Immunoassay Industry Revenue (Million) Forecast, by Application 2019 & 2032
- Table 130: Rest of Middle East and Africa Immunoassay Industry Volume (K Unit) Forecast, by Application 2019 & 2032
- Table 131: Global Immunoassay Industry Revenue Million Forecast, by Type 2019 & 2032
- Table 132: Global Immunoassay Industry Volume K Unit Forecast, by Type 2019 & 2032
- Table 133: Global Immunoassay Industry Revenue Million Forecast, by Application 2019 & 2032
- Table 134: Global Immunoassay Industry Volume K Unit Forecast, by Application 2019 & 2032
- Table 135: Global Immunoassay Industry Revenue Million Forecast, by End User 2019 & 2032
- Table 136: Global Immunoassay Industry Volume K Unit Forecast, by End User 2019 & 2032
- Table 137: Global Immunoassay Industry Revenue Million Forecast, by Country 2019 & 2032
- Table 138: Global Immunoassay Industry Volume K Unit Forecast, by Country 2019 & 2032
- Table 139: Brazil Immunoassay Industry Revenue (Million) Forecast, by Application 2019 & 2032
- Table 140: Brazil Immunoassay Industry Volume (K Unit) Forecast, by Application 2019 & 2032
- Table 141: Argentina Immunoassay Industry Revenue (Million) Forecast, by Application 2019 & 2032
- Table 142: Argentina Immunoassay Industry Volume (K Unit) Forecast, by Application 2019 & 2032
- Table 143: Rest of South America Immunoassay Industry Revenue (Million) Forecast, by Application 2019 & 2032
- Table 144: Rest of South America Immunoassay Industry Volume (K Unit) Forecast, by Application 2019 & 2032
Frequently Asked Questions
1. What is the projected Compound Annual Growth Rate (CAGR) of the Immunoassay Industry?
The projected CAGR is approximately 7.70%.
2. Which companies are prominent players in the Immunoassay Industry?
Key companies in the market include Becton Dickinson and Company, Bio-Rad Laboratories Inc, Hologic Inc, Abbott Laboratories, F Hoffmann-La Roche AG, Agilent Technologies Inc, Danaher Corporation (Beckman Coulter Inc), Qiagen NV, Sysmex Corporation, Thermo Fisher Scientific, Luminex Corporation, PerkinElmer Inc .
3. What are the main segments of the Immunoassay Industry?
The market segments include Type, Application, End User.
4. Can you provide details about the market size?
The market size is estimated to be USD XX Million as of 2022.
5. What are some drivers contributing to market growth?
High Sensitivity and Specificity of Immunoassays; Technological Advancements in Immunoassay Instruments; Increasing Prevalence of Chronic and Infectious Diseases.
6. What are the notable trends driving market growth?
Enzyme Immunoassays (EIA) Segment is Expected to Hold Significant Market Share in Immunoassay Market.
7. Are there any restraints impacting market growth?
Stringent Regulatory Scenario for Approval of Immunoassays; Complexity of Procedures.
8. Can you provide examples of recent developments in the market?
In November 2022, Getein launched MAGICL 6000 CLIA analyzer at MEDICA 2022. MAGICL 6000 is a compact and innovative CLIA analyzer, with optimal choice for mid to high-workflow laboratories that require a one-step CLIA solution.
9. What pricing options are available for accessing the report?
Pricing options include single-user, multi-user, and enterprise licenses priced at USD 4750, USD 5250, and USD 8750 respectively.
10. Is the market size provided in terms of value or volume?
The market size is provided in terms of value, measured in Million and volume, measured in K Unit.
11. Are there any specific market keywords associated with the report?
Yes, the market keyword associated with the report is "Immunoassay Industry," which aids in identifying and referencing the specific market segment covered.
12. How do I determine which pricing option suits my needs best?
The pricing options vary based on user requirements and access needs. Individual users may opt for single-user licenses, while businesses requiring broader access may choose multi-user or enterprise licenses for cost-effective access to the report.
13. Are there any additional resources or data provided in the Immunoassay Industry report?
While the report offers comprehensive insights, it's advisable to review the specific contents or supplementary materials provided to ascertain if additional resources or data are available.
14. How can I stay updated on further developments or reports in the Immunoassay Industry?
To stay informed about further developments, trends, and reports in the Immunoassay Industry, consider subscribing to industry newsletters, following relevant companies and organizations, or regularly checking reputable industry news sources and publications.
Methodology
Step 1 - Identification of Relevant Samples Size from Population Database


Step 2 - Approaches for Defining Global Market Size (Value, Volume* & Price*)

Note*: In applicable scenarios
Step 3 - Data Sources
Primary Research
- Web Analytics
- Survey Reports
- Research Institute
- Latest Research Reports
- Opinion Leaders
Secondary Research
- Annual Reports
- White Paper
- Latest Press Release
- Industry Association
- Paid Database
- Investor Presentations

Step 4 - Data Triangulation
Involves using different sources of information in order to increase the validity of a study
These sources are likely to be stakeholders in a program - participants, other researchers, program staff, other community members, and so on.
Then we put all data in single framework & apply various statistical tools to find out the dynamic on the market.
During the analysis stage, feedback from the stakeholder groups would be compared to determine areas of agreement as well as areas of divergence
