

Key Insights
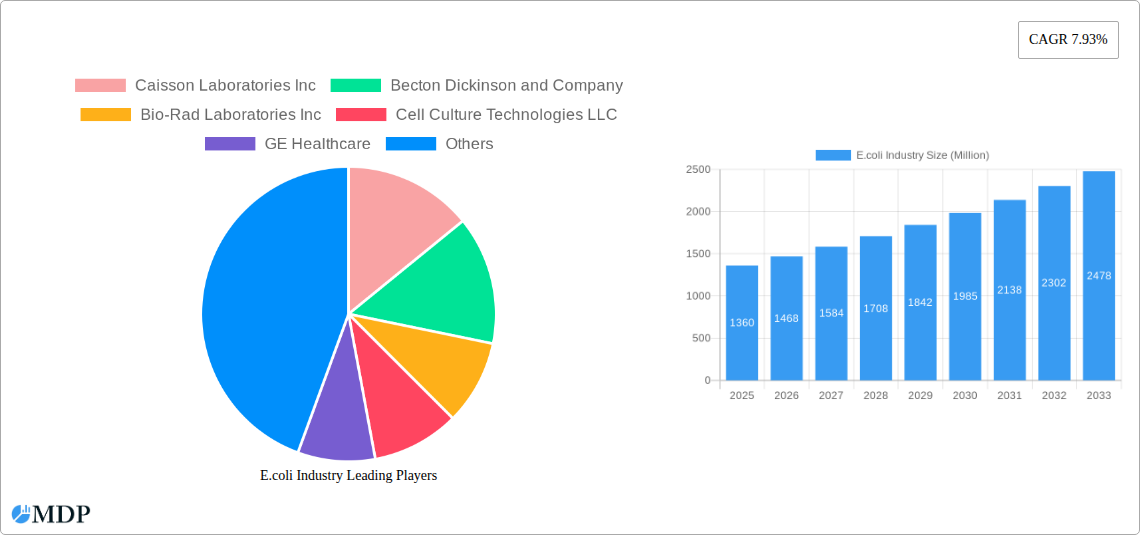
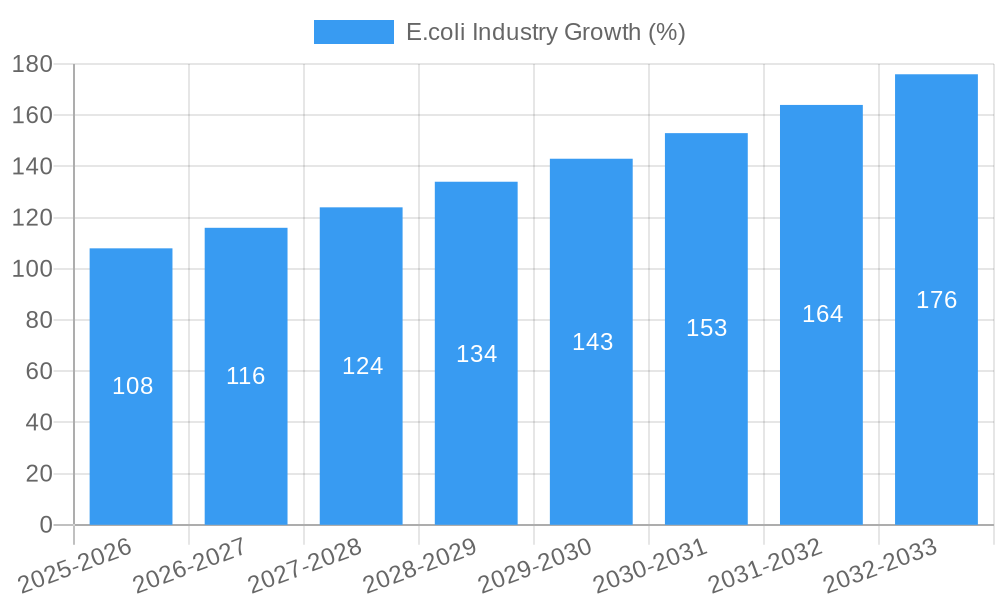
The E.coli testing market, valued at $1.36 billion in 2025, is projected to experience robust growth, driven by increasing incidences of E.coli infections globally and stringent regulatory frameworks mandating comprehensive testing in various sectors. The market's Compound Annual Growth Rate (CAGR) of 7.93% from 2019 to 2024 suggests a continuously expanding demand for reliable and efficient E.coli detection methods. Key drivers include the rising prevalence of foodborne illnesses, expanding application of E.coli testing in environmental monitoring, and the development of advanced testing technologies like Enzyme Immunoassays (EIA) and clinical testing methods offering faster and more accurate results. The market's segmentation reflects this diversity, with clinical testing and environmental testing representing major application areas. Significant investments in research and development are fueling the development of more sensitive and rapid diagnostic tools, further boosting market growth.
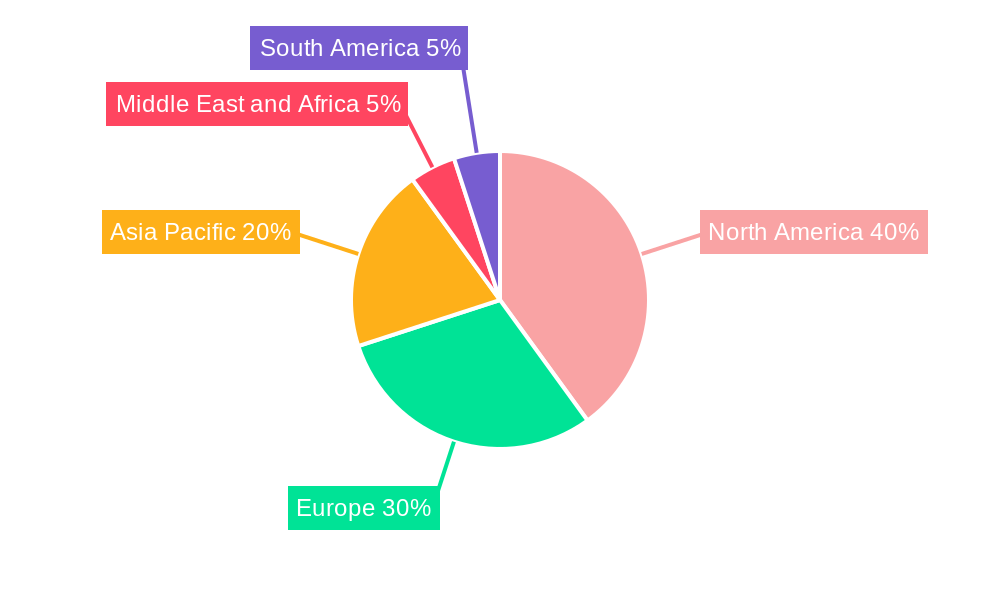
The prominent players in this dynamic market, including Caisson Laboratories Inc, Becton Dickinson, Bio-Rad Laboratories, and others, are continuously innovating to offer comprehensive testing solutions catering to diverse needs. Geographic analysis reveals North America holds a substantial market share, attributed to robust healthcare infrastructure and stringent regulatory standards. However, the Asia-Pacific region is expected to exhibit significant growth, driven by rising population density, increasing awareness of food safety, and expanding industrial activities. The Middle East and Africa, while currently holding a smaller share, offer promising growth potential as healthcare infrastructure develops and food safety regulations become more stringent. The forecast period of 2025-2033 promises substantial growth, influenced by factors like increasing government funding for public health initiatives, technological advancements, and growing awareness among consumers about food safety and hygiene.
This comprehensive report provides a detailed analysis of the E. coli industry, covering market dynamics, leading players, technological advancements, and future growth prospects. With a study period spanning 2019-2033, a base year of 2025, and an estimated year of 2025, this report offers invaluable insights for industry stakeholders, investors, and researchers. The forecast period extends from 2025-2033, with the historical period covering 2019-2024. The global E. coli industry is projected to reach xx Million by 2033, exhibiting a CAGR of xx% during the forecast period.
E. coli Industry Market Dynamics & Concentration
The E. coli industry is characterized by a moderately concentrated market with several key players holding significant market share. The market size in 2025 is estimated at xx Million. Innovation in testing methodologies and diagnostic tools is a primary driver of growth, alongside stringent regulatory frameworks ensuring food and water safety. Product substitutes are limited, although advancements in alternative detection methods are emerging. End-user trends favor rapid, accurate, and cost-effective testing solutions. M&A activity has been moderate, with xx major deals recorded between 2019 and 2024, primarily focused on expanding product portfolios and geographical reach.
- Market Concentration: The top 5 players account for approximately xx% of the global market share in 2025.
- Innovation Drivers: Development of rapid diagnostic tests, automated systems, and point-of-care diagnostics.
- Regulatory Frameworks: Stringent regulations regarding food safety, water quality, and environmental monitoring drive industry growth.
- Product Substitutes: Limited direct substitutes exist, but alternative technologies are constantly being developed.
- End-User Trends: Growing demand for faster turnaround times and improved accuracy in testing.
- M&A Activity: xx major mergers and acquisitions were observed during the historical period (2019-2024).
E. coli Industry Trends & Analysis
The E. coli industry is experiencing robust growth, driven by increasing concerns about foodborne illnesses and water contamination. The market is witnessing significant technological disruptions, with the adoption of advanced molecular diagnostic techniques like PCR and next-generation sequencing gaining traction. Consumer preferences are shifting towards faster and more accurate testing methods, creating demand for point-of-care diagnostic tools. Competitive dynamics are intense, with companies focusing on product differentiation, innovation, and strategic partnerships. The market is expected to experience a CAGR of xx% from 2025 to 2033, with significant market penetration in developing economies due to improved healthcare infrastructure and rising awareness. The market penetration rate is expected to increase from xx% in 2025 to xx% by 2033.
Leading Markets & Segments in E. coli Industry
The North American region currently dominates the E. coli industry, driven by strong regulatory frameworks, advanced healthcare infrastructure, and high per capita income. Within the testing segments, clinical testing holds a larger market share than environmental testing, primarily due to the prevalence of healthcare-associated infections.
Key Drivers for North American Dominance:
- Robust healthcare infrastructure and well-established diagnostic laboratories.
- Stringent regulatory compliance and high awareness of food safety and hygiene.
- High disposable income and strong investment in healthcare technologies.
Clinical Testing Segment:
- High prevalence of healthcare-associated infections necessitates widespread E. coli testing.
- Growing demand for rapid and accurate diagnostic solutions.
Environmental Testing Segment:
- Increasing concern over water contamination and food safety drives growth in this segment.
- Stringent environmental regulations and governmental initiatives supporting environmental monitoring.
E. coli Industry Product Developments
Recent advancements in E. coli detection technologies include the development of rapid diagnostic tests, portable devices for point-of-care testing, and advanced molecular assays. These innovations offer improved speed, accuracy, and cost-effectiveness, enabling faster response times and more efficient disease management. The market is also witnessing the integration of artificial intelligence and machine learning for data analysis and enhanced diagnostic capabilities. These technological improvements are improving market fit and overall efficiency of diagnostics.
Key Drivers of E. coli Industry Growth
Several factors contribute to the growth of the E. coli industry, including advancements in molecular diagnostics, increasing awareness of foodborne illnesses, stricter regulatory frameworks on food and water safety, and expanding healthcare infrastructure, particularly in developing economies. Government initiatives promoting disease surveillance and public health also play a significant role.
Challenges in the E. coli Industry Market
The E. coli industry faces several challenges, including the high cost of advanced testing technologies, stringent regulatory approvals, complex supply chain management, and intense competition from numerous players. These factors can affect profitability and market access.
Emerging Opportunities in E. coli Industry
Emerging opportunities include the development of novel diagnostic tools leveraging nanotechnology and artificial intelligence, the expansion of point-of-care testing, strategic collaborations between diagnostic companies and healthcare providers, and the penetration of new markets with improved access to advanced diagnostics.
Leading Players in the E. coli Industry Sector
- Caisson Laboratories Inc
- Becton Dickinson and Company
- Bio-Rad Laboratories Inc
- Cell Culture Technologies LLC
- GE Healthcare
- Lonza Group Ltd
- HiMedia Laboratories Pvt Ltd
- Merck & Co Inc
- Corning Incorporated
- Fujifilm Holdings Corporation
Key Milestones in E. coli Industry Industry
- June 2022: Researchers from the Indian Institute of Technology (IIT) Kanpur developed a highly sensitive E. coli water testing kit capable of detecting single E. coli cells. This development significantly improved water safety testing capabilities.
- June 2022: Researchers at Michigan State University conducted an experiment on Escherichia coli, revealing insights into the role of random mutations in bacterial evolution. While not directly impacting market products, this research expands the scientific understanding of E. coli.
Strategic Outlook for E. coli Industry Market
The E. coli industry is poised for significant growth, driven by technological innovation, expanding healthcare infrastructure, and increasing awareness of foodborne illnesses. Strategic partnerships, acquisitions, and investment in R&D will be crucial for companies to capitalize on this market potential. Focus on developing cost-effective and rapid diagnostic solutions will be key to ensuring widespread access to accurate testing.
E.coli Industry Segmentation
-
1. Test
-
1.1. Clinical Testing
- 1.1.1. Polymerase Chain Reaction
- 1.1.2. Enzyme Immunoassays
-
1.2. Environmental Testing
- 1.2.1. Membrane Filtration
- 1.2.2. Multiple Tube Fermentation
- 1.2.3. Enzyme Substrate Method
-
1.1. Clinical Testing
E.coli Industry Segmentation By Geography
-
1. North America
- 1.1. United States
- 1.2. Canada
- 1.3. Mexico
-
2. Europe
- 2.1. Germany
- 2.2. United Kingdom
- 2.3. France
- 2.4. Italy
- 2.5. Spain
- 2.6. Rest of Europe
-
3. Asia Pacific
- 3.1. China
- 3.2. Japan
- 3.3. India
- 3.4. Australia
- 3.5. South Korea
- 3.6. Rest of Asia Pacific
-
4. Middle East and Africa
- 4.1. GCC
- 4.2. South Africa
- 4.3. Rest of Middle East and Africa
-
5. South America
- 5.1. Brazil
- 5.2. Argentina
- 5.3. Rest of South America
E.coli Industry REPORT HIGHLIGHTS
| Aspects | Details |
|---|---|
| Study Period | 2019-2033 |
| Base Year | 2024 |
| Estimated Year | 2025 |
| Forecast Period | 2025-2033 |
| Historical Period | 2019-2024 |
| Growth Rate | CAGR of 7.93% from 2019-2033 |
| Segmentation |
|
Table of Contents
- 1. Introduction
- 1.1. Research Scope
- 1.2. Market Segmentation
- 1.3. Research Methodology
- 1.4. Definitions and Assumptions
- 2. Executive Summary
- 2.1. Introduction
- 3. Market Dynamics
- 3.1. Introduction
- 3.2. Market Drivers
- 3.2.1. Increasing Prevalence of Diarrhoea; New Technological Advancements
- 3.3. Market Restrains
- 3.3.1. High Cost of E. coli Treatment
- 3.4. Market Trends
- 3.4.1. Polymerase Chain Reaction Segment is Expected to be Major Segment in the Escherichia coli Testing Market
- 4. Market Factor Analysis
- 4.1. Porters Five Forces
- 4.2. Supply/Value Chain
- 4.3. PESTEL analysis
- 4.4. Market Entropy
- 4.5. Patent/Trademark Analysis
- 5. Global E.coli Industry Analysis, Insights and Forecast, 2019-2031
- 5.1. Market Analysis, Insights and Forecast - by Test
- 5.1.1. Clinical Testing
- 5.1.1.1. Polymerase Chain Reaction
- 5.1.1.2. Enzyme Immunoassays
- 5.1.2. Environmental Testing
- 5.1.2.1. Membrane Filtration
- 5.1.2.2. Multiple Tube Fermentation
- 5.1.2.3. Enzyme Substrate Method
- 5.1.1. Clinical Testing
- 5.2. Market Analysis, Insights and Forecast - by Region
- 5.2.1. North America
- 5.2.2. Europe
- 5.2.3. Asia Pacific
- 5.2.4. Middle East and Africa
- 5.2.5. South America
- 5.1. Market Analysis, Insights and Forecast - by Test
- 6. North America E.coli Industry Analysis, Insights and Forecast, 2019-2031
- 6.1. Market Analysis, Insights and Forecast - by Test
- 6.1.1. Clinical Testing
- 6.1.1.1. Polymerase Chain Reaction
- 6.1.1.2. Enzyme Immunoassays
- 6.1.2. Environmental Testing
- 6.1.2.1. Membrane Filtration
- 6.1.2.2. Multiple Tube Fermentation
- 6.1.2.3. Enzyme Substrate Method
- 6.1.1. Clinical Testing
- 6.1. Market Analysis, Insights and Forecast - by Test
- 7. Europe E.coli Industry Analysis, Insights and Forecast, 2019-2031
- 7.1. Market Analysis, Insights and Forecast - by Test
- 7.1.1. Clinical Testing
- 7.1.1.1. Polymerase Chain Reaction
- 7.1.1.2. Enzyme Immunoassays
- 7.1.2. Environmental Testing
- 7.1.2.1. Membrane Filtration
- 7.1.2.2. Multiple Tube Fermentation
- 7.1.2.3. Enzyme Substrate Method
- 7.1.1. Clinical Testing
- 7.1. Market Analysis, Insights and Forecast - by Test
- 8. Asia Pacific E.coli Industry Analysis, Insights and Forecast, 2019-2031
- 8.1. Market Analysis, Insights and Forecast - by Test
- 8.1.1. Clinical Testing
- 8.1.1.1. Polymerase Chain Reaction
- 8.1.1.2. Enzyme Immunoassays
- 8.1.2. Environmental Testing
- 8.1.2.1. Membrane Filtration
- 8.1.2.2. Multiple Tube Fermentation
- 8.1.2.3. Enzyme Substrate Method
- 8.1.1. Clinical Testing
- 8.1. Market Analysis, Insights and Forecast - by Test
- 9. Middle East and Africa E.coli Industry Analysis, Insights and Forecast, 2019-2031
- 9.1. Market Analysis, Insights and Forecast - by Test
- 9.1.1. Clinical Testing
- 9.1.1.1. Polymerase Chain Reaction
- 9.1.1.2. Enzyme Immunoassays
- 9.1.2. Environmental Testing
- 9.1.2.1. Membrane Filtration
- 9.1.2.2. Multiple Tube Fermentation
- 9.1.2.3. Enzyme Substrate Method
- 9.1.1. Clinical Testing
- 9.1. Market Analysis, Insights and Forecast - by Test
- 10. South America E.coli Industry Analysis, Insights and Forecast, 2019-2031
- 10.1. Market Analysis, Insights and Forecast - by Test
- 10.1.1. Clinical Testing
- 10.1.1.1. Polymerase Chain Reaction
- 10.1.1.2. Enzyme Immunoassays
- 10.1.2. Environmental Testing
- 10.1.2.1. Membrane Filtration
- 10.1.2.2. Multiple Tube Fermentation
- 10.1.2.3. Enzyme Substrate Method
- 10.1.1. Clinical Testing
- 10.1. Market Analysis, Insights and Forecast - by Test
- 11. North America E.coli Industry Analysis, Insights and Forecast, 2019-2031
- 11.1. Market Analysis, Insights and Forecast - By Country/Sub-region
- 11.1.1 United States
- 11.1.2 Canada
- 11.1.3 Mexico
- 12. Europe E.coli Industry Analysis, Insights and Forecast, 2019-2031
- 12.1. Market Analysis, Insights and Forecast - By Country/Sub-region
- 12.1.1 Germany
- 12.1.2 United Kingdom
- 12.1.3 France
- 12.1.4 Italy
- 12.1.5 Spain
- 12.1.6 Rest of Europe
- 13. Asia Pacific E.coli Industry Analysis, Insights and Forecast, 2019-2031
- 13.1. Market Analysis, Insights and Forecast - By Country/Sub-region
- 13.1.1 China
- 13.1.2 Japan
- 13.1.3 India
- 13.1.4 Australia
- 13.1.5 South Korea
- 13.1.6 Rest of Asia Pacific
- 14. Middle East and Africa E.coli Industry Analysis, Insights and Forecast, 2019-2031
- 14.1. Market Analysis, Insights and Forecast - By Country/Sub-region
- 14.1.1 GCC
- 14.1.2 South Africa
- 14.1.3 Rest of Middle East and Africa
- 15. South America E.coli Industry Analysis, Insights and Forecast, 2019-2031
- 15.1. Market Analysis, Insights and Forecast - By Country/Sub-region
- 15.1.1 Brazil
- 15.1.2 Argentina
- 15.1.3 Rest of South America
- 16. Competitive Analysis
- 16.1. Global Market Share Analysis 2024
- 16.2. Company Profiles
- 16.2.1 Caisson Laboratories Inc
- 16.2.1.1. Overview
- 16.2.1.2. Products
- 16.2.1.3. SWOT Analysis
- 16.2.1.4. Recent Developments
- 16.2.1.5. Financials (Based on Availability)
- 16.2.2 Becton Dickinson and Company
- 16.2.2.1. Overview
- 16.2.2.2. Products
- 16.2.2.3. SWOT Analysis
- 16.2.2.4. Recent Developments
- 16.2.2.5. Financials (Based on Availability)
- 16.2.3 Bio-Rad Laboratories Inc
- 16.2.3.1. Overview
- 16.2.3.2. Products
- 16.2.3.3. SWOT Analysis
- 16.2.3.4. Recent Developments
- 16.2.3.5. Financials (Based on Availability)
- 16.2.4 Cell Culture Technologies LLC
- 16.2.4.1. Overview
- 16.2.4.2. Products
- 16.2.4.3. SWOT Analysis
- 16.2.4.4. Recent Developments
- 16.2.4.5. Financials (Based on Availability)
- 16.2.5 GE Healthcare
- 16.2.5.1. Overview
- 16.2.5.2. Products
- 16.2.5.3. SWOT Analysis
- 16.2.5.4. Recent Developments
- 16.2.5.5. Financials (Based on Availability)
- 16.2.6 Lonza Group Ltd
- 16.2.6.1. Overview
- 16.2.6.2. Products
- 16.2.6.3. SWOT Analysis
- 16.2.6.4. Recent Developments
- 16.2.6.5. Financials (Based on Availability)
- 16.2.7 HiMedia Laboratories Pvt Ltd
- 16.2.7.1. Overview
- 16.2.7.2. Products
- 16.2.7.3. SWOT Analysis
- 16.2.7.4. Recent Developments
- 16.2.7.5. Financials (Based on Availability)
- 16.2.8 Merck & Co Inc*List Not Exhaustive
- 16.2.8.1. Overview
- 16.2.8.2. Products
- 16.2.8.3. SWOT Analysis
- 16.2.8.4. Recent Developments
- 16.2.8.5. Financials (Based on Availability)
- 16.2.9 Corning Incorporated
- 16.2.9.1. Overview
- 16.2.9.2. Products
- 16.2.9.3. SWOT Analysis
- 16.2.9.4. Recent Developments
- 16.2.9.5. Financials (Based on Availability)
- 16.2.10 Fujifilm Holdings Corporation
- 16.2.10.1. Overview
- 16.2.10.2. Products
- 16.2.10.3. SWOT Analysis
- 16.2.10.4. Recent Developments
- 16.2.10.5. Financials (Based on Availability)
- 16.2.1 Caisson Laboratories Inc
List of Figures
- Figure 1: Global E.coli Industry Revenue Breakdown (Million, %) by Region 2024 & 2032
- Figure 2: North America E.coli Industry Revenue (Million), by Country 2024 & 2032
- Figure 3: North America E.coli Industry Revenue Share (%), by Country 2024 & 2032
- Figure 4: Europe E.coli Industry Revenue (Million), by Country 2024 & 2032
- Figure 5: Europe E.coli Industry Revenue Share (%), by Country 2024 & 2032
- Figure 6: Asia Pacific E.coli Industry Revenue (Million), by Country 2024 & 2032
- Figure 7: Asia Pacific E.coli Industry Revenue Share (%), by Country 2024 & 2032
- Figure 8: Middle East and Africa E.coli Industry Revenue (Million), by Country 2024 & 2032
- Figure 9: Middle East and Africa E.coli Industry Revenue Share (%), by Country 2024 & 2032
- Figure 10: South America E.coli Industry Revenue (Million), by Country 2024 & 2032
- Figure 11: South America E.coli Industry Revenue Share (%), by Country 2024 & 2032
- Figure 12: North America E.coli Industry Revenue (Million), by Test 2024 & 2032
- Figure 13: North America E.coli Industry Revenue Share (%), by Test 2024 & 2032
- Figure 14: North America E.coli Industry Revenue (Million), by Country 2024 & 2032
- Figure 15: North America E.coli Industry Revenue Share (%), by Country 2024 & 2032
- Figure 16: Europe E.coli Industry Revenue (Million), by Test 2024 & 2032
- Figure 17: Europe E.coli Industry Revenue Share (%), by Test 2024 & 2032
- Figure 18: Europe E.coli Industry Revenue (Million), by Country 2024 & 2032
- Figure 19: Europe E.coli Industry Revenue Share (%), by Country 2024 & 2032
- Figure 20: Asia Pacific E.coli Industry Revenue (Million), by Test 2024 & 2032
- Figure 21: Asia Pacific E.coli Industry Revenue Share (%), by Test 2024 & 2032
- Figure 22: Asia Pacific E.coli Industry Revenue (Million), by Country 2024 & 2032
- Figure 23: Asia Pacific E.coli Industry Revenue Share (%), by Country 2024 & 2032
- Figure 24: Middle East and Africa E.coli Industry Revenue (Million), by Test 2024 & 2032
- Figure 25: Middle East and Africa E.coli Industry Revenue Share (%), by Test 2024 & 2032
- Figure 26: Middle East and Africa E.coli Industry Revenue (Million), by Country 2024 & 2032
- Figure 27: Middle East and Africa E.coli Industry Revenue Share (%), by Country 2024 & 2032
- Figure 28: South America E.coli Industry Revenue (Million), by Test 2024 & 2032
- Figure 29: South America E.coli Industry Revenue Share (%), by Test 2024 & 2032
- Figure 30: South America E.coli Industry Revenue (Million), by Country 2024 & 2032
- Figure 31: South America E.coli Industry Revenue Share (%), by Country 2024 & 2032
List of Tables
- Table 1: Global E.coli Industry Revenue Million Forecast, by Region 2019 & 2032
- Table 2: Global E.coli Industry Revenue Million Forecast, by Test 2019 & 2032
- Table 3: Global E.coli Industry Revenue Million Forecast, by Region 2019 & 2032
- Table 4: Global E.coli Industry Revenue Million Forecast, by Country 2019 & 2032
- Table 5: United States E.coli Industry Revenue (Million) Forecast, by Application 2019 & 2032
- Table 6: Canada E.coli Industry Revenue (Million) Forecast, by Application 2019 & 2032
- Table 7: Mexico E.coli Industry Revenue (Million) Forecast, by Application 2019 & 2032
- Table 8: Global E.coli Industry Revenue Million Forecast, by Country 2019 & 2032
- Table 9: Germany E.coli Industry Revenue (Million) Forecast, by Application 2019 & 2032
- Table 10: United Kingdom E.coli Industry Revenue (Million) Forecast, by Application 2019 & 2032
- Table 11: France E.coli Industry Revenue (Million) Forecast, by Application 2019 & 2032
- Table 12: Italy E.coli Industry Revenue (Million) Forecast, by Application 2019 & 2032
- Table 13: Spain E.coli Industry Revenue (Million) Forecast, by Application 2019 & 2032
- Table 14: Rest of Europe E.coli Industry Revenue (Million) Forecast, by Application 2019 & 2032
- Table 15: Global E.coli Industry Revenue Million Forecast, by Country 2019 & 2032
- Table 16: China E.coli Industry Revenue (Million) Forecast, by Application 2019 & 2032
- Table 17: Japan E.coli Industry Revenue (Million) Forecast, by Application 2019 & 2032
- Table 18: India E.coli Industry Revenue (Million) Forecast, by Application 2019 & 2032
- Table 19: Australia E.coli Industry Revenue (Million) Forecast, by Application 2019 & 2032
- Table 20: South Korea E.coli Industry Revenue (Million) Forecast, by Application 2019 & 2032
- Table 21: Rest of Asia Pacific E.coli Industry Revenue (Million) Forecast, by Application 2019 & 2032
- Table 22: Global E.coli Industry Revenue Million Forecast, by Country 2019 & 2032
- Table 23: GCC E.coli Industry Revenue (Million) Forecast, by Application 2019 & 2032
- Table 24: South Africa E.coli Industry Revenue (Million) Forecast, by Application 2019 & 2032
- Table 25: Rest of Middle East and Africa E.coli Industry Revenue (Million) Forecast, by Application 2019 & 2032
- Table 26: Global E.coli Industry Revenue Million Forecast, by Country 2019 & 2032
- Table 27: Brazil E.coli Industry Revenue (Million) Forecast, by Application 2019 & 2032
- Table 28: Argentina E.coli Industry Revenue (Million) Forecast, by Application 2019 & 2032
- Table 29: Rest of South America E.coli Industry Revenue (Million) Forecast, by Application 2019 & 2032
- Table 30: Global E.coli Industry Revenue Million Forecast, by Test 2019 & 2032
- Table 31: Global E.coli Industry Revenue Million Forecast, by Country 2019 & 2032
- Table 32: United States E.coli Industry Revenue (Million) Forecast, by Application 2019 & 2032
- Table 33: Canada E.coli Industry Revenue (Million) Forecast, by Application 2019 & 2032
- Table 34: Mexico E.coli Industry Revenue (Million) Forecast, by Application 2019 & 2032
- Table 35: Global E.coli Industry Revenue Million Forecast, by Test 2019 & 2032
- Table 36: Global E.coli Industry Revenue Million Forecast, by Country 2019 & 2032
- Table 37: Germany E.coli Industry Revenue (Million) Forecast, by Application 2019 & 2032
- Table 38: United Kingdom E.coli Industry Revenue (Million) Forecast, by Application 2019 & 2032
- Table 39: France E.coli Industry Revenue (Million) Forecast, by Application 2019 & 2032
- Table 40: Italy E.coli Industry Revenue (Million) Forecast, by Application 2019 & 2032
- Table 41: Spain E.coli Industry Revenue (Million) Forecast, by Application 2019 & 2032
- Table 42: Rest of Europe E.coli Industry Revenue (Million) Forecast, by Application 2019 & 2032
- Table 43: Global E.coli Industry Revenue Million Forecast, by Test 2019 & 2032
- Table 44: Global E.coli Industry Revenue Million Forecast, by Country 2019 & 2032
- Table 45: China E.coli Industry Revenue (Million) Forecast, by Application 2019 & 2032
- Table 46: Japan E.coli Industry Revenue (Million) Forecast, by Application 2019 & 2032
- Table 47: India E.coli Industry Revenue (Million) Forecast, by Application 2019 & 2032
- Table 48: Australia E.coli Industry Revenue (Million) Forecast, by Application 2019 & 2032
- Table 49: South Korea E.coli Industry Revenue (Million) Forecast, by Application 2019 & 2032
- Table 50: Rest of Asia Pacific E.coli Industry Revenue (Million) Forecast, by Application 2019 & 2032
- Table 51: Global E.coli Industry Revenue Million Forecast, by Test 2019 & 2032
- Table 52: Global E.coli Industry Revenue Million Forecast, by Country 2019 & 2032
- Table 53: GCC E.coli Industry Revenue (Million) Forecast, by Application 2019 & 2032
- Table 54: South Africa E.coli Industry Revenue (Million) Forecast, by Application 2019 & 2032
- Table 55: Rest of Middle East and Africa E.coli Industry Revenue (Million) Forecast, by Application 2019 & 2032
- Table 56: Global E.coli Industry Revenue Million Forecast, by Test 2019 & 2032
- Table 57: Global E.coli Industry Revenue Million Forecast, by Country 2019 & 2032
- Table 58: Brazil E.coli Industry Revenue (Million) Forecast, by Application 2019 & 2032
- Table 59: Argentina E.coli Industry Revenue (Million) Forecast, by Application 2019 & 2032
- Table 60: Rest of South America E.coli Industry Revenue (Million) Forecast, by Application 2019 & 2032
Frequently Asked Questions
1. What is the projected Compound Annual Growth Rate (CAGR) of the E.coli Industry?
The projected CAGR is approximately 7.93%.
2. Which companies are prominent players in the E.coli Industry?
Key companies in the market include Caisson Laboratories Inc, Becton Dickinson and Company, Bio-Rad Laboratories Inc, Cell Culture Technologies LLC, GE Healthcare, Lonza Group Ltd, HiMedia Laboratories Pvt Ltd, Merck & Co Inc*List Not Exhaustive, Corning Incorporated, Fujifilm Holdings Corporation.
3. What are the main segments of the E.coli Industry?
The market segments include Test.
4. Can you provide details about the market size?
The market size is estimated to be USD 1.36 Million as of 2022.
5. What are some drivers contributing to market growth?
Increasing Prevalence of Diarrhoea; New Technological Advancements.
6. What are the notable trends driving market growth?
Polymerase Chain Reaction Segment is Expected to be Major Segment in the Escherichia coli Testing Market.
7. Are there any restraints impacting market growth?
High Cost of E. coli Treatment.
8. Can you provide examples of recent developments in the market?
In June 2022, Researchers from the Indian Institute of Technology (IIT) Kanpur developed an enzyme-substrate medium-based E.coli. water testing kit that is highly sensitive and can detect the presence or absence of a single E.coli. in drinking water.
9. What pricing options are available for accessing the report?
Pricing options include single-user, multi-user, and enterprise licenses priced at USD 4750, USD 5250, and USD 8750 respectively.
10. Is the market size provided in terms of value or volume?
The market size is provided in terms of value, measured in Million.
11. Are there any specific market keywords associated with the report?
Yes, the market keyword associated with the report is "E.coli Industry," which aids in identifying and referencing the specific market segment covered.
12. How do I determine which pricing option suits my needs best?
The pricing options vary based on user requirements and access needs. Individual users may opt for single-user licenses, while businesses requiring broader access may choose multi-user or enterprise licenses for cost-effective access to the report.
13. Are there any additional resources or data provided in the E.coli Industry report?
While the report offers comprehensive insights, it's advisable to review the specific contents or supplementary materials provided to ascertain if additional resources or data are available.
14. How can I stay updated on further developments or reports in the E.coli Industry?
To stay informed about further developments, trends, and reports in the E.coli Industry, consider subscribing to industry newsletters, following relevant companies and organizations, or regularly checking reputable industry news sources and publications.
Methodology
Step 1 - Identification of Relevant Samples Size from Population Database


Step 2 - Approaches for Defining Global Market Size (Value, Volume* & Price*)

Note*: In applicable scenarios
Step 3 - Data Sources
Primary Research
- Web Analytics
- Survey Reports
- Research Institute
- Latest Research Reports
- Opinion Leaders
Secondary Research
- Annual Reports
- White Paper
- Latest Press Release
- Industry Association
- Paid Database
- Investor Presentations

Step 4 - Data Triangulation
Involves using different sources of information in order to increase the validity of a study
These sources are likely to be stakeholders in a program - participants, other researchers, program staff, other community members, and so on.
Then we put all data in single framework & apply various statistical tools to find out the dynamic on the market.
During the analysis stage, feedback from the stakeholder groups would be compared to determine areas of agreement as well as areas of divergence
