

Key Insights
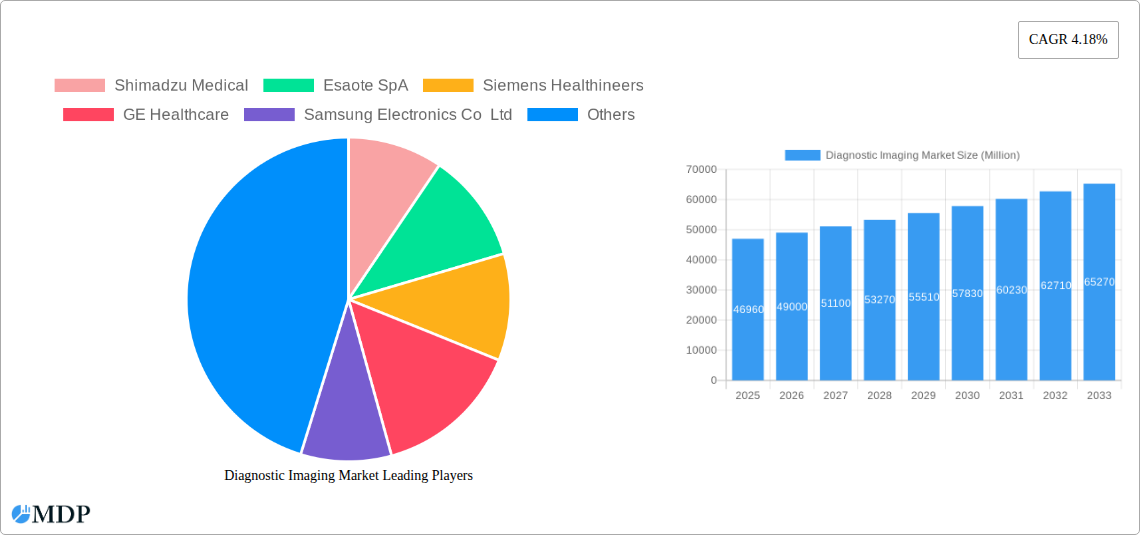
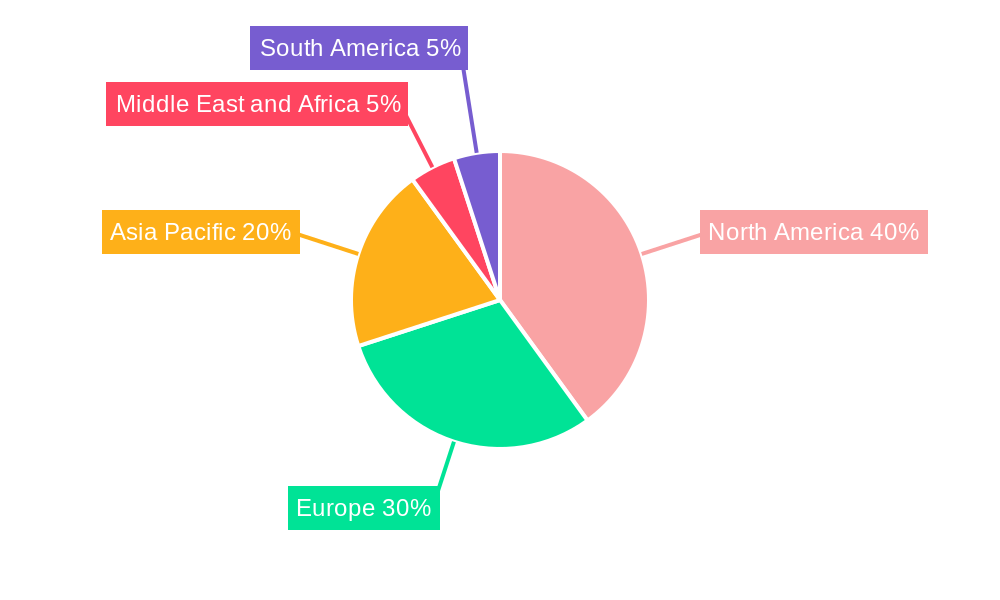
The global diagnostic imaging market, valued at $46.96 billion in 2025, is projected to experience robust growth, driven by several key factors. Technological advancements, such as the development of AI-powered image analysis and improved resolution imaging techniques (e.g., higher-resolution CT and MRI), are significantly enhancing diagnostic accuracy and efficiency. The rising prevalence of chronic diseases, an aging global population requiring increased healthcare services, and a growing emphasis on preventative healthcare are fueling demand for advanced imaging technologies. Furthermore, the increasing adoption of minimally invasive procedures necessitates precise and detailed pre- and post-operative imaging, further bolstering market growth. The market is segmented by application (cardiology, oncology, neurology, orthopedics, gastroenterology, gynecology, and others), end-user (hospitals, diagnostic centers, and others), and modality (X-ray, ultrasound, CT, nuclear imaging, and MRI). While the market's growth is broadly positive, certain restraints exist, including high equipment costs, the need for skilled professionals for operation and interpretation, and regulatory hurdles associated with new technology approvals. Regional variations in healthcare infrastructure and spending also influence market penetration. North America currently holds a significant market share, driven by advanced healthcare infrastructure and high adoption of cutting-edge technologies. However, Asia-Pacific is anticipated to experience rapid growth due to rising disposable incomes and expanding healthcare infrastructure.
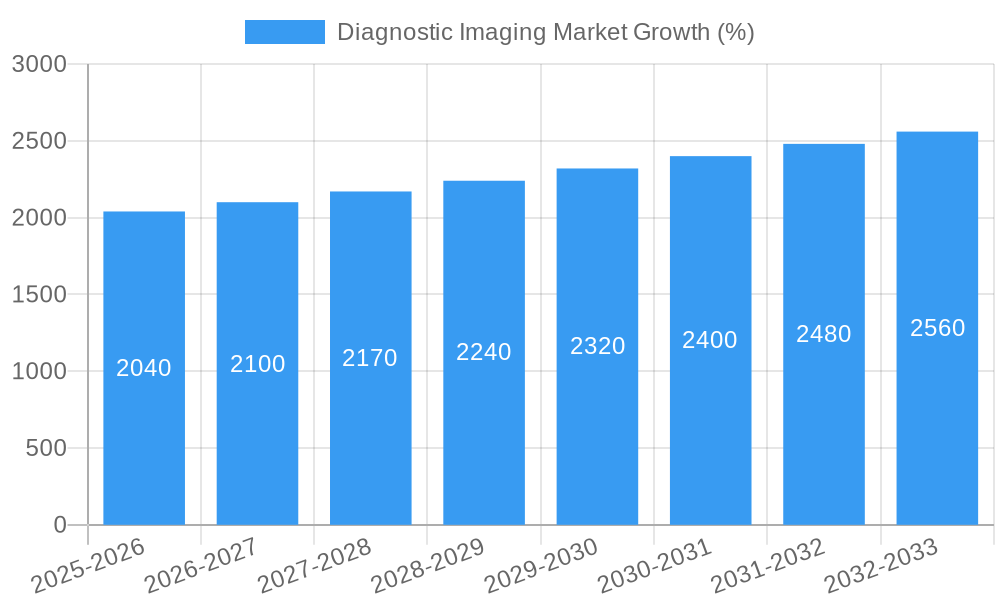
The projected Compound Annual Growth Rate (CAGR) of 4.18% from 2025 to 2033 suggests a steadily increasing market size. Competitive pressures among major players like Shimadzu Medical, Esaote SpA, Siemens Healthineers, and GE Healthcare are driving innovation and improving affordability. To sustain growth, companies are focusing on strategic partnerships, acquisitions, and the development of innovative imaging solutions that offer enhanced capabilities and improved workflow efficiency. The increasing integration of digital platforms, telehealth, and cloud-based image management systems are also expected to contribute significantly to market expansion in the coming years. The market’s future trajectory will depend on continued advancements in technology, evolving healthcare policies, and economic conditions across different regions. The demand for precise, timely, and cost-effective diagnostic imaging will continue to be a central driver of growth.
Diagnostic Imaging Market Report: 2019-2033 Forecast
This comprehensive report provides a detailed analysis of the Diagnostic Imaging Market, offering invaluable insights for industry stakeholders, investors, and strategic decision-makers. Covering the period 2019-2033, with a base year of 2025 and a forecast period of 2025-2033, this report leverages extensive market research and data analysis to paint a clear picture of current market dynamics and future growth prospects. The report uses Million as the unit for all values.
Diagnostic Imaging Market Market Dynamics & Concentration
The global diagnostic imaging market is a dynamic landscape characterized by significant concentration among key players and continuous innovation. The market's growth is driven by factors such as the rising prevalence of chronic diseases, technological advancements leading to improved image quality and faster scan times, and increasing demand for minimally invasive procedures. Regulatory frameworks, such as those governing medical device approvals and data privacy, play a crucial role in shaping market dynamics. The presence of substitute technologies, like advanced ultrasound systems, adds another layer of complexity. End-user trends, including the preference for outpatient imaging centers and the increasing adoption of telehealth, are also reshaping the market.
Market concentration is moderate, with a few large players holding significant market share. The market share of the top five players is estimated at approximately 60% in 2025. Mergers and acquisitions (M&A) activity has been relatively high in recent years, with approximately xx M&A deals reported between 2019 and 2024. These deals are primarily driven by strategic expansion, technological integration, and geographical reach.
- Key Market Dynamics:
- Rising prevalence of chronic diseases
- Technological advancements (e.g., AI integration)
- Increasing demand for minimally invasive procedures
- Stringent regulatory frameworks
- Presence of substitute technologies
- Shifting end-user preferences (outpatient centers, telehealth)
- High M&A activity
Diagnostic Imaging Market Industry Trends & Analysis
The Diagnostic Imaging market is experiencing robust growth, with a projected Compound Annual Growth Rate (CAGR) of xx% during the forecast period (2025-2033). This growth is fueled by several key trends: the increasing adoption of advanced imaging technologies such as AI-powered diagnostic tools, the rising demand for faster and more accurate diagnostic procedures, and the expanding geriatric population requiring more frequent medical screenings. Technological disruptions, such as the integration of artificial intelligence (AI) and machine learning (ML) in image analysis, are significantly improving diagnostic accuracy and efficiency. Consumer preferences are shifting toward minimally invasive procedures and personalized medicine, further driving demand for advanced imaging solutions. The competitive landscape is characterized by intense competition among established players and the emergence of new entrants offering innovative solutions. Market penetration of advanced modalities like MRI and CT is increasing steadily across various healthcare settings.
Leading Markets & Segments in Diagnostic Imaging Market
The North American region holds the largest market share within the global diagnostic imaging market, driven by factors such as high healthcare expenditure, the presence of advanced healthcare infrastructure, and a large number of diagnostic imaging centers. Within the various segments, Cardiology holds a dominant position due to the rising prevalence of cardiovascular diseases. Hospitals remain the largest end-user segment, accounting for approximately xx% of the market. Computed Tomography (CT) leads the modality segment due to its wide application across various medical specialties.
Key Drivers by Segment:
- Cardiology: Rising prevalence of cardiovascular diseases, technological advancements in cardiac imaging.
- Oncology: Increasing cancer incidence rates, demand for early detection and treatment monitoring.
- Hospitals (End User): Established infrastructure, high patient volume, investment capacity.
- Computed Tomography (Modality): Versatility, high image quality, widespread availability.
Regional Dominance Analysis: North America’s dominance stems from its robust healthcare infrastructure, high healthcare expenditure, and strong regulatory support. However, Asia-Pacific is expected to exhibit significant growth driven by increasing healthcare investment and rising awareness about preventive healthcare.
Diagnostic Imaging Market Product Developments
Recent years have witnessed significant advancements in diagnostic imaging technology, focusing on improving image quality, reducing scan times, and enhancing workflow efficiency. New MRI systems offer innovative workflow solutions and accelerated scan technology, leading to faster procedures. Advanced CT scanners are being developed with improved image resolution and lower radiation doses. Integration of AI and machine learning is playing a pivotal role in automating image analysis and improving diagnostic accuracy. These product developments are strengthening the competitive landscape and driving market growth by catering to the growing demand for faster, more accurate, and efficient diagnostic solutions.
Key Drivers of Diagnostic Imaging Market Growth
Several factors contribute to the growth of the diagnostic imaging market. Technological advancements, such as AI-powered image analysis and faster scan times, are pivotal. The increasing prevalence of chronic diseases necessitates more frequent diagnostic imaging. Favorable regulatory environments in several countries promote the adoption of advanced imaging technologies. Finally, rising healthcare expenditure globally further fuels market growth.
Challenges in the Diagnostic Imaging Market Market
The diagnostic imaging market faces several challenges. High costs of advanced imaging equipment can limit accessibility, particularly in developing countries. Stringent regulatory approvals for new technologies can slow down innovation. Supply chain disruptions can impact the availability of imaging components. Finally, intense competition among established players and emerging companies presents significant challenges.
Emerging Opportunities in Diagnostic Imaging Market
Significant opportunities exist for growth in the diagnostic imaging market. The integration of AI and ML in image analysis offers improved accuracy and efficiency. Strategic partnerships between imaging equipment manufacturers and healthcare providers can facilitate broader access to advanced technologies. Expansion into emerging markets with rising healthcare spending presents substantial growth potential. Furthermore, the development of portable and point-of-care imaging systems presents a new frontier.
Leading Players in the Diagnostic Imaging Market Sector
- Shimadzu Medical
- Esaote SpA
- Siemens Healthineers
- GE Healthcare
- Samsung Electronics Co Ltd
- Browns Medical Imaging (BMI)
- Mindray Medical International Limited
- FUJIFILM Holdings Corporation
- Koninklijke Philips NV
- Canon Medical Systems Corporation
- Hologic Corporation
- Koning Corporation
Key Milestones in Diagnostic Imaging Market Industry
- July 2022: Canon Medical launched the Vantage Fortain MRI System at ECR 2022, featuring innovative workflow solutions, image enhancements, and accelerated scan technology, significantly reducing MRI procedure times.
- April 2022: Wipro GE Healthcare launched the next-generation Revolution Aspire CT scanner, an advanced imaging solution designed and manufactured end-to-end in India.
Strategic Outlook for Diagnostic Imaging Market Market
The future of the diagnostic imaging market appears promising, driven by continuous technological advancements, expanding healthcare infrastructure, and the increasing prevalence of chronic diseases. Strategic opportunities exist for companies to focus on developing AI-powered solutions, expanding into emerging markets, and forging strategic partnerships to gain market share. Companies that embrace innovation and adapt to evolving healthcare needs are likely to be well-positioned for sustained growth in this dynamic market.
Diagnostic Imaging Market Segmentation
-
1. Modality
-
1.1. MRI
- 1.1.1. Low and mid field MRI Systems (less than 1.5 T)
- 1.1.2. High field MRI Systems (1.5-3 T)
- 1.1.3. Very Hig
-
1.2. Computed Tomography
- 1.2.1. Low-end Scanners (~16-Slice)
- 1.2.2. Mid-range Scanners (~64-Slice)
- 1.2.3. High-end Scanners (128-Slice and More)
-
1.3. Ultrasound
- 1.3.1. 2D Ultrasound
- 1.3.2. 3D Ultrasound
- 1.3.3. Other Ultrasound
-
1.4. X-Ray
- 1.4.1. Analog Systems
- 1.4.2. Digital Systems
-
1.5. Nuclear Imaging
- 1.5.1. Positron Emission Tomography (PET)
- 1.5.2. Single Photon Emission Computed Tomography (SPECT)
- 1.6. Fluoroscopy
- 1.7. Mammography
-
1.1. MRI
-
2. Application
- 2.1. Cardiology
- 2.2. Oncology
- 2.3. Neurology
- 2.4. Orthopedics
- 2.5. Gastroenterology
- 2.6. Gynecology
- 2.7. Other Applications
-
3. End User
- 3.1. Hospital
- 3.2. Diagnostic Centers
- 3.3. Other End Users
Diagnostic Imaging Market Segmentation By Geography
-
1. North America
- 1.1. United States
- 1.2. Canada
- 1.3. Mexico
-
2. Europe
- 2.1. Germany
- 2.2. United Kingdom
- 2.3. France
- 2.4. Italy
- 2.5. Spain
- 2.6. Rest of Europe
-
3. Asia Pacific
- 3.1. China
- 3.2. Japan
- 3.3. India
- 3.4. Australia
- 3.5. South Korea
- 3.6. Rest of Asia Pacific
-
4. Middle East and Africa
- 4.1. GCC
- 4.2. South Africa
- 4.3. Rest of Middle East and Africa
-
5. South America
- 5.1. Brazil
- 5.2. Argentina
- 5.3. Rest of South America
Diagnostic Imaging Market REPORT HIGHLIGHTS
| Aspects | Details |
|---|---|
| Study Period | 2019-2033 |
| Base Year | 2024 |
| Estimated Year | 2025 |
| Forecast Period | 2025-2033 |
| Historical Period | 2019-2024 |
| Growth Rate | CAGR of 4.18% from 2019-2033 |
| Segmentation |
|
Table of Contents
- 1. Introduction
- 1.1. Research Scope
- 1.2. Market Segmentation
- 1.3. Research Methodology
- 1.4. Definitions and Assumptions
- 2. Executive Summary
- 2.1. Introduction
- 3. Market Dynamics
- 3.1. Introduction
- 3.2. Market Drivers
- 3.2.1. Rise in the Prevalence of Chronic Diseases; Increased Adoption of Advanced Technologies in Medical Imaging; Increase in the Geriatric Population
- 3.3. Market Restrains
- 3.3.1. Expensive Procedures and Equipment; Side Effects of Diagnostic Imaging
- 3.4. Market Trends
- 3.4.1. Mid-range Scanners (~64-Slice) Segment under Computed Tomography expected to Account for Largest Market Share during the Forecast Period
- 4. Market Factor Analysis
- 4.1. Porters Five Forces
- 4.2. Supply/Value Chain
- 4.3. PESTEL analysis
- 4.4. Market Entropy
- 4.5. Patent/Trademark Analysis
- 5. Global Diagnostic Imaging Market Analysis, Insights and Forecast, 2019-2031
- 5.1. Market Analysis, Insights and Forecast - by Modality
- 5.1.1. MRI
- 5.1.1.1. Low and mid field MRI Systems (less than 1.5 T)
- 5.1.1.2. High field MRI Systems (1.5-3 T)
- 5.1.1.3. Very Hig
- 5.1.2. Computed Tomography
- 5.1.2.1. Low-end Scanners (~16-Slice)
- 5.1.2.2. Mid-range Scanners (~64-Slice)
- 5.1.2.3. High-end Scanners (128-Slice and More)
- 5.1.3. Ultrasound
- 5.1.3.1. 2D Ultrasound
- 5.1.3.2. 3D Ultrasound
- 5.1.3.3. Other Ultrasound
- 5.1.4. X-Ray
- 5.1.4.1. Analog Systems
- 5.1.4.2. Digital Systems
- 5.1.5. Nuclear Imaging
- 5.1.5.1. Positron Emission Tomography (PET)
- 5.1.5.2. Single Photon Emission Computed Tomography (SPECT)
- 5.1.6. Fluoroscopy
- 5.1.7. Mammography
- 5.1.1. MRI
- 5.2. Market Analysis, Insights and Forecast - by Application
- 5.2.1. Cardiology
- 5.2.2. Oncology
- 5.2.3. Neurology
- 5.2.4. Orthopedics
- 5.2.5. Gastroenterology
- 5.2.6. Gynecology
- 5.2.7. Other Applications
- 5.3. Market Analysis, Insights and Forecast - by End User
- 5.3.1. Hospital
- 5.3.2. Diagnostic Centers
- 5.3.3. Other End Users
- 5.4. Market Analysis, Insights and Forecast - by Region
- 5.4.1. North America
- 5.4.2. Europe
- 5.4.3. Asia Pacific
- 5.4.4. Middle East and Africa
- 5.4.5. South America
- 5.1. Market Analysis, Insights and Forecast - by Modality
- 6. North America Diagnostic Imaging Market Analysis, Insights and Forecast, 2019-2031
- 6.1. Market Analysis, Insights and Forecast - by Modality
- 6.1.1. MRI
- 6.1.1.1. Low and mid field MRI Systems (less than 1.5 T)
- 6.1.1.2. High field MRI Systems (1.5-3 T)
- 6.1.1.3. Very Hig
- 6.1.2. Computed Tomography
- 6.1.2.1. Low-end Scanners (~16-Slice)
- 6.1.2.2. Mid-range Scanners (~64-Slice)
- 6.1.2.3. High-end Scanners (128-Slice and More)
- 6.1.3. Ultrasound
- 6.1.3.1. 2D Ultrasound
- 6.1.3.2. 3D Ultrasound
- 6.1.3.3. Other Ultrasound
- 6.1.4. X-Ray
- 6.1.4.1. Analog Systems
- 6.1.4.2. Digital Systems
- 6.1.5. Nuclear Imaging
- 6.1.5.1. Positron Emission Tomography (PET)
- 6.1.5.2. Single Photon Emission Computed Tomography (SPECT)
- 6.1.6. Fluoroscopy
- 6.1.7. Mammography
- 6.1.1. MRI
- 6.2. Market Analysis, Insights and Forecast - by Application
- 6.2.1. Cardiology
- 6.2.2. Oncology
- 6.2.3. Neurology
- 6.2.4. Orthopedics
- 6.2.5. Gastroenterology
- 6.2.6. Gynecology
- 6.2.7. Other Applications
- 6.3. Market Analysis, Insights and Forecast - by End User
- 6.3.1. Hospital
- 6.3.2. Diagnostic Centers
- 6.3.3. Other End Users
- 6.1. Market Analysis, Insights and Forecast - by Modality
- 7. Europe Diagnostic Imaging Market Analysis, Insights and Forecast, 2019-2031
- 7.1. Market Analysis, Insights and Forecast - by Modality
- 7.1.1. MRI
- 7.1.1.1. Low and mid field MRI Systems (less than 1.5 T)
- 7.1.1.2. High field MRI Systems (1.5-3 T)
- 7.1.1.3. Very Hig
- 7.1.2. Computed Tomography
- 7.1.2.1. Low-end Scanners (~16-Slice)
- 7.1.2.2. Mid-range Scanners (~64-Slice)
- 7.1.2.3. High-end Scanners (128-Slice and More)
- 7.1.3. Ultrasound
- 7.1.3.1. 2D Ultrasound
- 7.1.3.2. 3D Ultrasound
- 7.1.3.3. Other Ultrasound
- 7.1.4. X-Ray
- 7.1.4.1. Analog Systems
- 7.1.4.2. Digital Systems
- 7.1.5. Nuclear Imaging
- 7.1.5.1. Positron Emission Tomography (PET)
- 7.1.5.2. Single Photon Emission Computed Tomography (SPECT)
- 7.1.6. Fluoroscopy
- 7.1.7. Mammography
- 7.1.1. MRI
- 7.2. Market Analysis, Insights and Forecast - by Application
- 7.2.1. Cardiology
- 7.2.2. Oncology
- 7.2.3. Neurology
- 7.2.4. Orthopedics
- 7.2.5. Gastroenterology
- 7.2.6. Gynecology
- 7.2.7. Other Applications
- 7.3. Market Analysis, Insights and Forecast - by End User
- 7.3.1. Hospital
- 7.3.2. Diagnostic Centers
- 7.3.3. Other End Users
- 7.1. Market Analysis, Insights and Forecast - by Modality
- 8. Asia Pacific Diagnostic Imaging Market Analysis, Insights and Forecast, 2019-2031
- 8.1. Market Analysis, Insights and Forecast - by Modality
- 8.1.1. MRI
- 8.1.1.1. Low and mid field MRI Systems (less than 1.5 T)
- 8.1.1.2. High field MRI Systems (1.5-3 T)
- 8.1.1.3. Very Hig
- 8.1.2. Computed Tomography
- 8.1.2.1. Low-end Scanners (~16-Slice)
- 8.1.2.2. Mid-range Scanners (~64-Slice)
- 8.1.2.3. High-end Scanners (128-Slice and More)
- 8.1.3. Ultrasound
- 8.1.3.1. 2D Ultrasound
- 8.1.3.2. 3D Ultrasound
- 8.1.3.3. Other Ultrasound
- 8.1.4. X-Ray
- 8.1.4.1. Analog Systems
- 8.1.4.2. Digital Systems
- 8.1.5. Nuclear Imaging
- 8.1.5.1. Positron Emission Tomography (PET)
- 8.1.5.2. Single Photon Emission Computed Tomography (SPECT)
- 8.1.6. Fluoroscopy
- 8.1.7. Mammography
- 8.1.1. MRI
- 8.2. Market Analysis, Insights and Forecast - by Application
- 8.2.1. Cardiology
- 8.2.2. Oncology
- 8.2.3. Neurology
- 8.2.4. Orthopedics
- 8.2.5. Gastroenterology
- 8.2.6. Gynecology
- 8.2.7. Other Applications
- 8.3. Market Analysis, Insights and Forecast - by End User
- 8.3.1. Hospital
- 8.3.2. Diagnostic Centers
- 8.3.3. Other End Users
- 8.1. Market Analysis, Insights and Forecast - by Modality
- 9. Middle East and Africa Diagnostic Imaging Market Analysis, Insights and Forecast, 2019-2031
- 9.1. Market Analysis, Insights and Forecast - by Modality
- 9.1.1. MRI
- 9.1.1.1. Low and mid field MRI Systems (less than 1.5 T)
- 9.1.1.2. High field MRI Systems (1.5-3 T)
- 9.1.1.3. Very Hig
- 9.1.2. Computed Tomography
- 9.1.2.1. Low-end Scanners (~16-Slice)
- 9.1.2.2. Mid-range Scanners (~64-Slice)
- 9.1.2.3. High-end Scanners (128-Slice and More)
- 9.1.3. Ultrasound
- 9.1.3.1. 2D Ultrasound
- 9.1.3.2. 3D Ultrasound
- 9.1.3.3. Other Ultrasound
- 9.1.4. X-Ray
- 9.1.4.1. Analog Systems
- 9.1.4.2. Digital Systems
- 9.1.5. Nuclear Imaging
- 9.1.5.1. Positron Emission Tomography (PET)
- 9.1.5.2. Single Photon Emission Computed Tomography (SPECT)
- 9.1.6. Fluoroscopy
- 9.1.7. Mammography
- 9.1.1. MRI
- 9.2. Market Analysis, Insights and Forecast - by Application
- 9.2.1. Cardiology
- 9.2.2. Oncology
- 9.2.3. Neurology
- 9.2.4. Orthopedics
- 9.2.5. Gastroenterology
- 9.2.6. Gynecology
- 9.2.7. Other Applications
- 9.3. Market Analysis, Insights and Forecast - by End User
- 9.3.1. Hospital
- 9.3.2. Diagnostic Centers
- 9.3.3. Other End Users
- 9.1. Market Analysis, Insights and Forecast - by Modality
- 10. South America Diagnostic Imaging Market Analysis, Insights and Forecast, 2019-2031
- 10.1. Market Analysis, Insights and Forecast - by Modality
- 10.1.1. MRI
- 10.1.1.1. Low and mid field MRI Systems (less than 1.5 T)
- 10.1.1.2. High field MRI Systems (1.5-3 T)
- 10.1.1.3. Very Hig
- 10.1.2. Computed Tomography
- 10.1.2.1. Low-end Scanners (~16-Slice)
- 10.1.2.2. Mid-range Scanners (~64-Slice)
- 10.1.2.3. High-end Scanners (128-Slice and More)
- 10.1.3. Ultrasound
- 10.1.3.1. 2D Ultrasound
- 10.1.3.2. 3D Ultrasound
- 10.1.3.3. Other Ultrasound
- 10.1.4. X-Ray
- 10.1.4.1. Analog Systems
- 10.1.4.2. Digital Systems
- 10.1.5. Nuclear Imaging
- 10.1.5.1. Positron Emission Tomography (PET)
- 10.1.5.2. Single Photon Emission Computed Tomography (SPECT)
- 10.1.6. Fluoroscopy
- 10.1.7. Mammography
- 10.1.1. MRI
- 10.2. Market Analysis, Insights and Forecast - by Application
- 10.2.1. Cardiology
- 10.2.2. Oncology
- 10.2.3. Neurology
- 10.2.4. Orthopedics
- 10.2.5. Gastroenterology
- 10.2.6. Gynecology
- 10.2.7. Other Applications
- 10.3. Market Analysis, Insights and Forecast - by End User
- 10.3.1. Hospital
- 10.3.2. Diagnostic Centers
- 10.3.3. Other End Users
- 10.1. Market Analysis, Insights and Forecast - by Modality
- 11. North America Diagnostic Imaging Market Analysis, Insights and Forecast, 2019-2031
- 11.1. Market Analysis, Insights and Forecast - By Country/Sub-region
- 11.1.1 United States
- 11.1.2 Canada
- 11.1.3 Mexico
- 12. Europe Diagnostic Imaging Market Analysis, Insights and Forecast, 2019-2031
- 12.1. Market Analysis, Insights and Forecast - By Country/Sub-region
- 12.1.1 Germany
- 12.1.2 United Kingdom
- 12.1.3 France
- 12.1.4 Italy
- 12.1.5 Spain
- 12.1.6 Benelux
- 12.1.7 Nordics
- 12.1.8 Rest of Europe
- 13. Asia Pacific Diagnostic Imaging Market Analysis, Insights and Forecast, 2019-2031
- 13.1. Market Analysis, Insights and Forecast - By Country/Sub-region
- 13.1.1 China
- 13.1.2 Japan
- 13.1.3 India
- 13.1.4 Australia
- 13.1.5 South Korea
- 13.1.6 Rest of Asia Pacific
- 14. Middle East and Africa Diagnostic Imaging Market Analysis, Insights and Forecast, 2019-2031
- 14.1. Market Analysis, Insights and Forecast - By Country/Sub-region
- 14.1.1 GCC
- 14.1.2 South Africa
- 14.1.3 Rest of Middle East and Africa
- 15. South America Diagnostic Imaging Market Analysis, Insights and Forecast, 2019-2031
- 15.1. Market Analysis, Insights and Forecast - By Country/Sub-region
- 15.1.1 Brazil
- 15.1.2 Argentina
- 15.1.3 Rest of South America
- 16. Competitive Analysis
- 16.1. Global Market Share Analysis 2024
- 16.2. Company Profiles
- 16.2.1 Shimadzu Medical
- 16.2.1.1. Overview
- 16.2.1.2. Products
- 16.2.1.3. SWOT Analysis
- 16.2.1.4. Recent Developments
- 16.2.1.5. Financials (Based on Availability)
- 16.2.2 Esaote SpA
- 16.2.2.1. Overview
- 16.2.2.2. Products
- 16.2.2.3. SWOT Analysis
- 16.2.2.4. Recent Developments
- 16.2.2.5. Financials (Based on Availability)
- 16.2.3 Siemens Healthineers
- 16.2.3.1. Overview
- 16.2.3.2. Products
- 16.2.3.3. SWOT Analysis
- 16.2.3.4. Recent Developments
- 16.2.3.5. Financials (Based on Availability)
- 16.2.4 GE Healthcare
- 16.2.4.1. Overview
- 16.2.4.2. Products
- 16.2.4.3. SWOT Analysis
- 16.2.4.4. Recent Developments
- 16.2.4.5. Financials (Based on Availability)
- 16.2.5 Samsung Electronics Co Ltd
- 16.2.5.1. Overview
- 16.2.5.2. Products
- 16.2.5.3. SWOT Analysis
- 16.2.5.4. Recent Developments
- 16.2.5.5. Financials (Based on Availability)
- 16.2.6 Browns Medical Imaging (BMI)
- 16.2.6.1. Overview
- 16.2.6.2. Products
- 16.2.6.3. SWOT Analysis
- 16.2.6.4. Recent Developments
- 16.2.6.5. Financials (Based on Availability)
- 16.2.7 Mindray Medical International Limited
- 16.2.7.1. Overview
- 16.2.7.2. Products
- 16.2.7.3. SWOT Analysis
- 16.2.7.4. Recent Developments
- 16.2.7.5. Financials (Based on Availability)
- 16.2.8 FUJIFILM Holdings Corporation
- 16.2.8.1. Overview
- 16.2.8.2. Products
- 16.2.8.3. SWOT Analysis
- 16.2.8.4. Recent Developments
- 16.2.8.5. Financials (Based on Availability)
- 16.2.9 Koninklijke Philips NV
- 16.2.9.1. Overview
- 16.2.9.2. Products
- 16.2.9.3. SWOT Analysis
- 16.2.9.4. Recent Developments
- 16.2.9.5. Financials (Based on Availability)
- 16.2.10 Canon Medical Systems Corporation
- 16.2.10.1. Overview
- 16.2.10.2. Products
- 16.2.10.3. SWOT Analysis
- 16.2.10.4. Recent Developments
- 16.2.10.5. Financials (Based on Availability)
- 16.2.11 Hologic Corporation
- 16.2.11.1. Overview
- 16.2.11.2. Products
- 16.2.11.3. SWOT Analysis
- 16.2.11.4. Recent Developments
- 16.2.11.5. Financials (Based on Availability)
- 16.2.12 Koning Corporation*List Not Exhaustive
- 16.2.12.1. Overview
- 16.2.12.2. Products
- 16.2.12.3. SWOT Analysis
- 16.2.12.4. Recent Developments
- 16.2.12.5. Financials (Based on Availability)
- 16.2.1 Shimadzu Medical
List of Figures
- Figure 1: Global Diagnostic Imaging Market Revenue Breakdown (Million, %) by Region 2024 & 2032
- Figure 2: North America Diagnostic Imaging Market Revenue (Million), by Country 2024 & 2032
- Figure 3: North America Diagnostic Imaging Market Revenue Share (%), by Country 2024 & 2032
- Figure 4: Europe Diagnostic Imaging Market Revenue (Million), by Country 2024 & 2032
- Figure 5: Europe Diagnostic Imaging Market Revenue Share (%), by Country 2024 & 2032
- Figure 6: Asia Pacific Diagnostic Imaging Market Revenue (Million), by Country 2024 & 2032
- Figure 7: Asia Pacific Diagnostic Imaging Market Revenue Share (%), by Country 2024 & 2032
- Figure 8: Middle East and Africa Diagnostic Imaging Market Revenue (Million), by Country 2024 & 2032
- Figure 9: Middle East and Africa Diagnostic Imaging Market Revenue Share (%), by Country 2024 & 2032
- Figure 10: South America Diagnostic Imaging Market Revenue (Million), by Country 2024 & 2032
- Figure 11: South America Diagnostic Imaging Market Revenue Share (%), by Country 2024 & 2032
- Figure 12: North America Diagnostic Imaging Market Revenue (Million), by Modality 2024 & 2032
- Figure 13: North America Diagnostic Imaging Market Revenue Share (%), by Modality 2024 & 2032
- Figure 14: North America Diagnostic Imaging Market Revenue (Million), by Application 2024 & 2032
- Figure 15: North America Diagnostic Imaging Market Revenue Share (%), by Application 2024 & 2032
- Figure 16: North America Diagnostic Imaging Market Revenue (Million), by End User 2024 & 2032
- Figure 17: North America Diagnostic Imaging Market Revenue Share (%), by End User 2024 & 2032
- Figure 18: North America Diagnostic Imaging Market Revenue (Million), by Country 2024 & 2032
- Figure 19: North America Diagnostic Imaging Market Revenue Share (%), by Country 2024 & 2032
- Figure 20: Europe Diagnostic Imaging Market Revenue (Million), by Modality 2024 & 2032
- Figure 21: Europe Diagnostic Imaging Market Revenue Share (%), by Modality 2024 & 2032
- Figure 22: Europe Diagnostic Imaging Market Revenue (Million), by Application 2024 & 2032
- Figure 23: Europe Diagnostic Imaging Market Revenue Share (%), by Application 2024 & 2032
- Figure 24: Europe Diagnostic Imaging Market Revenue (Million), by End User 2024 & 2032
- Figure 25: Europe Diagnostic Imaging Market Revenue Share (%), by End User 2024 & 2032
- Figure 26: Europe Diagnostic Imaging Market Revenue (Million), by Country 2024 & 2032
- Figure 27: Europe Diagnostic Imaging Market Revenue Share (%), by Country 2024 & 2032
- Figure 28: Asia Pacific Diagnostic Imaging Market Revenue (Million), by Modality 2024 & 2032
- Figure 29: Asia Pacific Diagnostic Imaging Market Revenue Share (%), by Modality 2024 & 2032
- Figure 30: Asia Pacific Diagnostic Imaging Market Revenue (Million), by Application 2024 & 2032
- Figure 31: Asia Pacific Diagnostic Imaging Market Revenue Share (%), by Application 2024 & 2032
- Figure 32: Asia Pacific Diagnostic Imaging Market Revenue (Million), by End User 2024 & 2032
- Figure 33: Asia Pacific Diagnostic Imaging Market Revenue Share (%), by End User 2024 & 2032
- Figure 34: Asia Pacific Diagnostic Imaging Market Revenue (Million), by Country 2024 & 2032
- Figure 35: Asia Pacific Diagnostic Imaging Market Revenue Share (%), by Country 2024 & 2032
- Figure 36: Middle East and Africa Diagnostic Imaging Market Revenue (Million), by Modality 2024 & 2032
- Figure 37: Middle East and Africa Diagnostic Imaging Market Revenue Share (%), by Modality 2024 & 2032
- Figure 38: Middle East and Africa Diagnostic Imaging Market Revenue (Million), by Application 2024 & 2032
- Figure 39: Middle East and Africa Diagnostic Imaging Market Revenue Share (%), by Application 2024 & 2032
- Figure 40: Middle East and Africa Diagnostic Imaging Market Revenue (Million), by End User 2024 & 2032
- Figure 41: Middle East and Africa Diagnostic Imaging Market Revenue Share (%), by End User 2024 & 2032
- Figure 42: Middle East and Africa Diagnostic Imaging Market Revenue (Million), by Country 2024 & 2032
- Figure 43: Middle East and Africa Diagnostic Imaging Market Revenue Share (%), by Country 2024 & 2032
- Figure 44: South America Diagnostic Imaging Market Revenue (Million), by Modality 2024 & 2032
- Figure 45: South America Diagnostic Imaging Market Revenue Share (%), by Modality 2024 & 2032
- Figure 46: South America Diagnostic Imaging Market Revenue (Million), by Application 2024 & 2032
- Figure 47: South America Diagnostic Imaging Market Revenue Share (%), by Application 2024 & 2032
- Figure 48: South America Diagnostic Imaging Market Revenue (Million), by End User 2024 & 2032
- Figure 49: South America Diagnostic Imaging Market Revenue Share (%), by End User 2024 & 2032
- Figure 50: South America Diagnostic Imaging Market Revenue (Million), by Country 2024 & 2032
- Figure 51: South America Diagnostic Imaging Market Revenue Share (%), by Country 2024 & 2032
List of Tables
- Table 1: Global Diagnostic Imaging Market Revenue Million Forecast, by Region 2019 & 2032
- Table 2: Global Diagnostic Imaging Market Revenue Million Forecast, by Modality 2019 & 2032
- Table 3: Global Diagnostic Imaging Market Revenue Million Forecast, by Application 2019 & 2032
- Table 4: Global Diagnostic Imaging Market Revenue Million Forecast, by End User 2019 & 2032
- Table 5: Global Diagnostic Imaging Market Revenue Million Forecast, by Region 2019 & 2032
- Table 6: Global Diagnostic Imaging Market Revenue Million Forecast, by Country 2019 & 2032
- Table 7: United States Diagnostic Imaging Market Revenue (Million) Forecast, by Application 2019 & 2032
- Table 8: Canada Diagnostic Imaging Market Revenue (Million) Forecast, by Application 2019 & 2032
- Table 9: Mexico Diagnostic Imaging Market Revenue (Million) Forecast, by Application 2019 & 2032
- Table 10: Global Diagnostic Imaging Market Revenue Million Forecast, by Country 2019 & 2032
- Table 11: Germany Diagnostic Imaging Market Revenue (Million) Forecast, by Application 2019 & 2032
- Table 12: United Kingdom Diagnostic Imaging Market Revenue (Million) Forecast, by Application 2019 & 2032
- Table 13: France Diagnostic Imaging Market Revenue (Million) Forecast, by Application 2019 & 2032
- Table 14: Italy Diagnostic Imaging Market Revenue (Million) Forecast, by Application 2019 & 2032
- Table 15: Spain Diagnostic Imaging Market Revenue (Million) Forecast, by Application 2019 & 2032
- Table 16: Benelux Diagnostic Imaging Market Revenue (Million) Forecast, by Application 2019 & 2032
- Table 17: Nordics Diagnostic Imaging Market Revenue (Million) Forecast, by Application 2019 & 2032
- Table 18: Rest of Europe Diagnostic Imaging Market Revenue (Million) Forecast, by Application 2019 & 2032
- Table 19: Global Diagnostic Imaging Market Revenue Million Forecast, by Country 2019 & 2032
- Table 20: China Diagnostic Imaging Market Revenue (Million) Forecast, by Application 2019 & 2032
- Table 21: Japan Diagnostic Imaging Market Revenue (Million) Forecast, by Application 2019 & 2032
- Table 22: India Diagnostic Imaging Market Revenue (Million) Forecast, by Application 2019 & 2032
- Table 23: Australia Diagnostic Imaging Market Revenue (Million) Forecast, by Application 2019 & 2032
- Table 24: South Korea Diagnostic Imaging Market Revenue (Million) Forecast, by Application 2019 & 2032
- Table 25: Rest of Asia Pacific Diagnostic Imaging Market Revenue (Million) Forecast, by Application 2019 & 2032
- Table 26: Global Diagnostic Imaging Market Revenue Million Forecast, by Country 2019 & 2032
- Table 27: GCC Diagnostic Imaging Market Revenue (Million) Forecast, by Application 2019 & 2032
- Table 28: South Africa Diagnostic Imaging Market Revenue (Million) Forecast, by Application 2019 & 2032
- Table 29: Rest of Middle East and Africa Diagnostic Imaging Market Revenue (Million) Forecast, by Application 2019 & 2032
- Table 30: Global Diagnostic Imaging Market Revenue Million Forecast, by Country 2019 & 2032
- Table 31: Brazil Diagnostic Imaging Market Revenue (Million) Forecast, by Application 2019 & 2032
- Table 32: Argentina Diagnostic Imaging Market Revenue (Million) Forecast, by Application 2019 & 2032
- Table 33: Rest of South America Diagnostic Imaging Market Revenue (Million) Forecast, by Application 2019 & 2032
- Table 34: Global Diagnostic Imaging Market Revenue Million Forecast, by Modality 2019 & 2032
- Table 35: Global Diagnostic Imaging Market Revenue Million Forecast, by Application 2019 & 2032
- Table 36: Global Diagnostic Imaging Market Revenue Million Forecast, by End User 2019 & 2032
- Table 37: Global Diagnostic Imaging Market Revenue Million Forecast, by Country 2019 & 2032
- Table 38: United States Diagnostic Imaging Market Revenue (Million) Forecast, by Application 2019 & 2032
- Table 39: Canada Diagnostic Imaging Market Revenue (Million) Forecast, by Application 2019 & 2032
- Table 40: Mexico Diagnostic Imaging Market Revenue (Million) Forecast, by Application 2019 & 2032
- Table 41: Global Diagnostic Imaging Market Revenue Million Forecast, by Modality 2019 & 2032
- Table 42: Global Diagnostic Imaging Market Revenue Million Forecast, by Application 2019 & 2032
- Table 43: Global Diagnostic Imaging Market Revenue Million Forecast, by End User 2019 & 2032
- Table 44: Global Diagnostic Imaging Market Revenue Million Forecast, by Country 2019 & 2032
- Table 45: Germany Diagnostic Imaging Market Revenue (Million) Forecast, by Application 2019 & 2032
- Table 46: United Kingdom Diagnostic Imaging Market Revenue (Million) Forecast, by Application 2019 & 2032
- Table 47: France Diagnostic Imaging Market Revenue (Million) Forecast, by Application 2019 & 2032
- Table 48: Italy Diagnostic Imaging Market Revenue (Million) Forecast, by Application 2019 & 2032
- Table 49: Spain Diagnostic Imaging Market Revenue (Million) Forecast, by Application 2019 & 2032
- Table 50: Rest of Europe Diagnostic Imaging Market Revenue (Million) Forecast, by Application 2019 & 2032
- Table 51: Global Diagnostic Imaging Market Revenue Million Forecast, by Modality 2019 & 2032
- Table 52: Global Diagnostic Imaging Market Revenue Million Forecast, by Application 2019 & 2032
- Table 53: Global Diagnostic Imaging Market Revenue Million Forecast, by End User 2019 & 2032
- Table 54: Global Diagnostic Imaging Market Revenue Million Forecast, by Country 2019 & 2032
- Table 55: China Diagnostic Imaging Market Revenue (Million) Forecast, by Application 2019 & 2032
- Table 56: Japan Diagnostic Imaging Market Revenue (Million) Forecast, by Application 2019 & 2032
- Table 57: India Diagnostic Imaging Market Revenue (Million) Forecast, by Application 2019 & 2032
- Table 58: Australia Diagnostic Imaging Market Revenue (Million) Forecast, by Application 2019 & 2032
- Table 59: South Korea Diagnostic Imaging Market Revenue (Million) Forecast, by Application 2019 & 2032
- Table 60: Rest of Asia Pacific Diagnostic Imaging Market Revenue (Million) Forecast, by Application 2019 & 2032
- Table 61: Global Diagnostic Imaging Market Revenue Million Forecast, by Modality 2019 & 2032
- Table 62: Global Diagnostic Imaging Market Revenue Million Forecast, by Application 2019 & 2032
- Table 63: Global Diagnostic Imaging Market Revenue Million Forecast, by End User 2019 & 2032
- Table 64: Global Diagnostic Imaging Market Revenue Million Forecast, by Country 2019 & 2032
- Table 65: GCC Diagnostic Imaging Market Revenue (Million) Forecast, by Application 2019 & 2032
- Table 66: South Africa Diagnostic Imaging Market Revenue (Million) Forecast, by Application 2019 & 2032
- Table 67: Rest of Middle East and Africa Diagnostic Imaging Market Revenue (Million) Forecast, by Application 2019 & 2032
- Table 68: Global Diagnostic Imaging Market Revenue Million Forecast, by Modality 2019 & 2032
- Table 69: Global Diagnostic Imaging Market Revenue Million Forecast, by Application 2019 & 2032
- Table 70: Global Diagnostic Imaging Market Revenue Million Forecast, by End User 2019 & 2032
- Table 71: Global Diagnostic Imaging Market Revenue Million Forecast, by Country 2019 & 2032
- Table 72: Brazil Diagnostic Imaging Market Revenue (Million) Forecast, by Application 2019 & 2032
- Table 73: Argentina Diagnostic Imaging Market Revenue (Million) Forecast, by Application 2019 & 2032
- Table 74: Rest of South America Diagnostic Imaging Market Revenue (Million) Forecast, by Application 2019 & 2032
Frequently Asked Questions
1. What is the projected Compound Annual Growth Rate (CAGR) of the Diagnostic Imaging Market?
The projected CAGR is approximately 4.18%.
2. Which companies are prominent players in the Diagnostic Imaging Market?
Key companies in the market include Shimadzu Medical, Esaote SpA, Siemens Healthineers, GE Healthcare, Samsung Electronics Co Ltd, Browns Medical Imaging (BMI), Mindray Medical International Limited, FUJIFILM Holdings Corporation, Koninklijke Philips NV, Canon Medical Systems Corporation, Hologic Corporation, Koning Corporation*List Not Exhaustive.
3. What are the main segments of the Diagnostic Imaging Market?
The market segments include Modality, Application, End User.
4. Can you provide details about the market size?
The market size is estimated to be USD 46.96 Million as of 2022.
5. What are some drivers contributing to market growth?
Rise in the Prevalence of Chronic Diseases; Increased Adoption of Advanced Technologies in Medical Imaging; Increase in the Geriatric Population.
6. What are the notable trends driving market growth?
Mid-range Scanners (~64-Slice) Segment under Computed Tomography expected to Account for Largest Market Share during the Forecast Period.
7. Are there any restraints impacting market growth?
Expensive Procedures and Equipment; Side Effects of Diagnostic Imaging.
8. Can you provide examples of recent developments in the market?
July 2022 : Canon Medical launched the Vantage Fortain MRI System at ECR 2022, This MRI system features innovative workflow solutions, image enhancements and accelerated scan technology, which together contributes to reducing the time required for MRI procedures.
9. What pricing options are available for accessing the report?
Pricing options include single-user, multi-user, and enterprise licenses priced at USD 4750, USD 5250, and USD 8750 respectively.
10. Is the market size provided in terms of value or volume?
The market size is provided in terms of value, measured in Million.
11. Are there any specific market keywords associated with the report?
Yes, the market keyword associated with the report is "Diagnostic Imaging Market," which aids in identifying and referencing the specific market segment covered.
12. How do I determine which pricing option suits my needs best?
The pricing options vary based on user requirements and access needs. Individual users may opt for single-user licenses, while businesses requiring broader access may choose multi-user or enterprise licenses for cost-effective access to the report.
13. Are there any additional resources or data provided in the Diagnostic Imaging Market report?
While the report offers comprehensive insights, it's advisable to review the specific contents or supplementary materials provided to ascertain if additional resources or data are available.
14. How can I stay updated on further developments or reports in the Diagnostic Imaging Market?
To stay informed about further developments, trends, and reports in the Diagnostic Imaging Market, consider subscribing to industry newsletters, following relevant companies and organizations, or regularly checking reputable industry news sources and publications.
Methodology
Step 1 - Identification of Relevant Samples Size from Population Database


Step 2 - Approaches for Defining Global Market Size (Value, Volume* & Price*)

Note*: In applicable scenarios
Step 3 - Data Sources
Primary Research
- Web Analytics
- Survey Reports
- Research Institute
- Latest Research Reports
- Opinion Leaders
Secondary Research
- Annual Reports
- White Paper
- Latest Press Release
- Industry Association
- Paid Database
- Investor Presentations

Step 4 - Data Triangulation
Involves using different sources of information in order to increase the validity of a study
These sources are likely to be stakeholders in a program - participants, other researchers, program staff, other community members, and so on.
Then we put all data in single framework & apply various statistical tools to find out the dynamic on the market.
During the analysis stage, feedback from the stakeholder groups would be compared to determine areas of agreement as well as areas of divergence
