

Key Insights
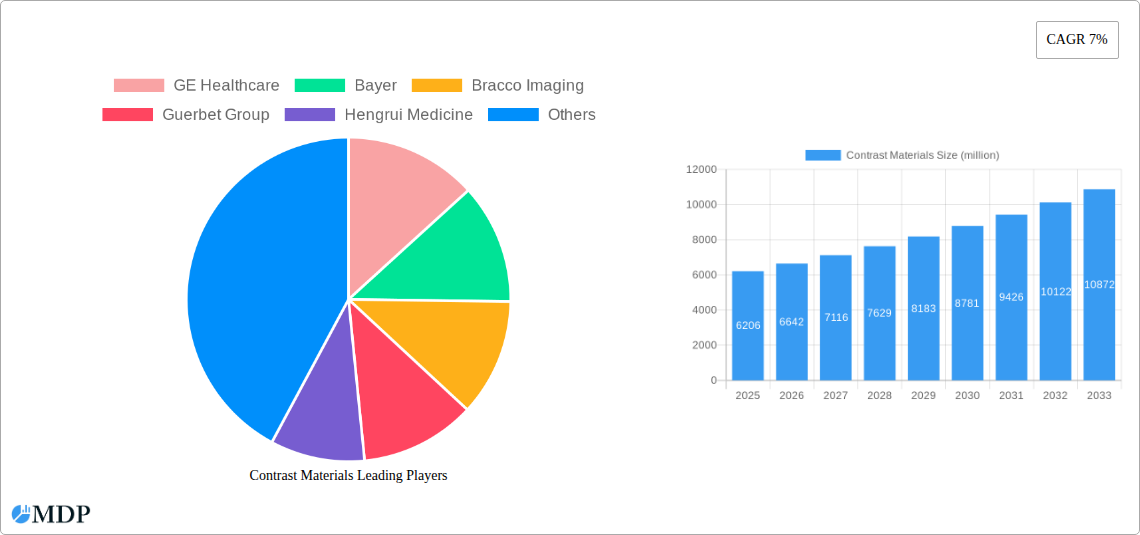
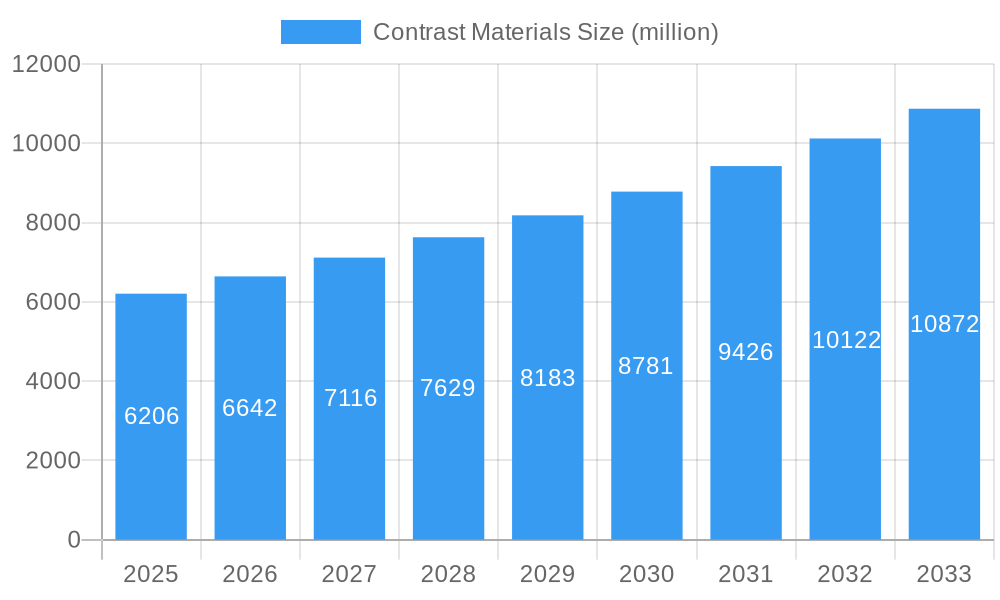
The global contrast materials market, valued at $6.206 billion in 2025, is projected to experience robust growth, driven by a compound annual growth rate (CAGR) of 7% from 2025 to 2033. This expansion is fueled by several key factors. The increasing prevalence of chronic diseases necessitating advanced medical imaging procedures, coupled with technological advancements leading to the development of safer and more effective contrast agents, are primary drivers. The rising geriatric population, susceptible to various conditions requiring frequent imaging, further contributes to market growth. Furthermore, the expanding healthcare infrastructure in developing economies, particularly in Asia-Pacific and the Middle East & Africa, is creating lucrative opportunities for contrast material manufacturers. Segmentation reveals that the X-ray & CT segment holds a significant market share due to the widespread use of these imaging modalities. Hospitals remain the dominant application segment, reflecting the concentration of sophisticated diagnostic imaging equipment in these settings. Major players like GE Healthcare, Bayer, and Bracco Imaging are strategically investing in research and development to enhance product portfolios and expand market reach. Competition is intense, characterized by continuous innovation and strategic partnerships aimed at capturing a larger market share.
Contrast Materials Market Size (In Billion)
Despite the promising growth outlook, the market faces certain challenges. Regulatory hurdles associated with the approval of new contrast agents and concerns regarding adverse reactions in certain patient populations impose constraints. Pricing pressures from healthcare providers and increasing generic competition also exert downward pressure on profitability. However, the long-term growth trajectory remains positive, driven by the continuous need for accurate and timely diagnosis in a rapidly aging global population and the ongoing advancements in medical imaging technology. The market is expected to witness consolidation through mergers and acquisitions, further shaping the competitive landscape in the coming years. The development of novel contrast agents with improved safety profiles and targeted delivery mechanisms will continue to be a key focus for industry players, driving innovation and market expansion.
Contrast Materials Company Market Share
Contrast Materials Market Report: A Comprehensive Analysis (2019-2033)
This in-depth report provides a comprehensive analysis of the global Contrast Materials market, projecting a market value exceeding $XX billion by 2033. It meticulously examines market dynamics, competitive landscapes, technological advancements, and future growth opportunities. This report is an invaluable resource for industry stakeholders, investors, and researchers seeking actionable insights into this vital sector. The report covers the period from 2019 to 2033, with a focus on the 2025-2033 forecast period and a base year of 2025. Key players analyzed include GE Healthcare, Bayer, Bracco Imaging, Guerbet Group, Hengrui Medicine, Lantheus, YRPG, and BeiLu Pharma.
Contrast Materials Market Dynamics & Concentration
The global contrast materials market, valued at $XX billion in 2025, exhibits a moderately concentrated structure with key players holding significant market share. GE Healthcare, Bayer, and Bracco Imaging are among the leading companies, collectively accounting for approximately xx% of the market in 2025. Market concentration is influenced by factors including substantial R&D investments, stringent regulatory approvals, and economies of scale in manufacturing.
Market Drivers:
- Technological Innovation: Continuous advancements in contrast agent formulations, leading to improved safety profiles and enhanced imaging capabilities.
- Rising Prevalence of Chronic Diseases: The increasing incidence of cardiovascular diseases, cancer, and other chronic conditions fuels demand for diagnostic imaging procedures.
- Stringent Regulatory Frameworks: Regulations governing the safety and efficacy of contrast agents drive innovation and market consolidation.
- Product Substitutes: The availability of alternative imaging techniques and contrast agents influences market dynamics and competition.
- End-User Trends: Growing adoption of advanced imaging techniques in hospitals and clinics, coupled with increasing patient awareness, stimulates market growth.
- Mergers & Acquisitions (M&A) Activities: Consolidation through M&A activities shapes the competitive landscape, fostering innovation and expansion. Over the historical period (2019-2024), approximately xx M&A deals were recorded in the contrast materials industry.
Contrast Materials Industry Trends & Analysis
The contrast materials market is experiencing robust growth, driven by a compound annual growth rate (CAGR) of xx% during the forecast period (2025-2033). This growth is fueled by several key factors:
- Technological Disruptions: The introduction of novel contrast agents with improved efficacy and reduced side effects is reshaping the market.
- Increased Adoption of Advanced Imaging Techniques: The rising popularity of MRI and CT scans, compared to traditional X-ray, drives demand for specialized contrast agents.
- Changing Consumer Preferences: Patients increasingly demand minimally invasive procedures with quicker recovery times, leading to increased use of contrast-enhanced imaging.
- Competitive Dynamics: Intense competition among established players and emerging companies drives innovation and price optimization. Market penetration of next-generation contrast agents is expected to reach xx% by 2033.
Leading Markets & Segments in Contrast Materials
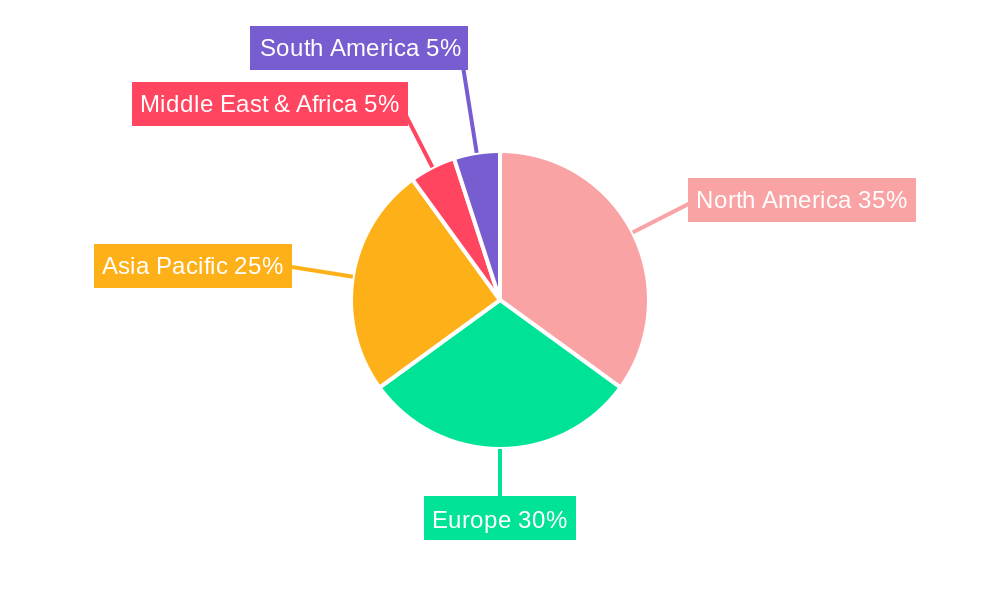
The North American market currently holds the largest share of the global contrast materials market. This dominance is attributed to several factors:
Key Drivers (North America):
- High healthcare expenditure and advanced medical infrastructure.
- Early adoption of new technologies and innovative contrast agents.
- Stringent regulatory environment promoting safety and efficacy.
- High prevalence of chronic diseases requiring advanced diagnostic imaging.
Dominance Analysis: The substantial market share reflects higher per capita healthcare spending, a large aging population, and a well-established network of hospitals and clinics equipped with advanced imaging technologies. The hospitals segment accounts for a larger share compared to clinics due to higher procedure volumes and advanced imaging capabilities. Within types, X-ray & CT currently holds the largest market share, followed by MRI and Ultrasound.
Contrast Materials Product Developments
Recent innovations in contrast materials focus on developing safer, more effective agents with improved biocompatibility and reduced side effects. This includes the introduction of novel contrast agents tailored for specific applications and body regions, enhancing image quality and reducing patient discomfort. The focus on personalized medicine is driving the development of contrast agents with improved targeting capabilities.
Key Drivers of Contrast Materials Growth
Several factors contribute to the growth of the contrast materials market. These include:
- Technological advancements: Development of novel contrast agents with improved safety and efficacy.
- Economic growth: Increased healthcare spending in developing economies.
- Favorable regulatory environment: Approvals for new contrast agents and imaging techniques.
- Rising prevalence of chronic diseases: Increased demand for diagnostic imaging procedures.
Challenges in the Contrast Materials Market
The contrast materials market faces several challenges, including:
- Stringent regulatory hurdles: The lengthy approval processes for new contrast agents increase time-to-market.
- Supply chain disruptions: Global supply chain issues can impact availability and pricing of raw materials.
- Intense competition: Competition among established players and emerging companies puts pressure on pricing and margins. This pressure could lead to a xx% decrease in average selling prices by 2033.
Emerging Opportunities in Contrast Materials
Significant growth potential exists in the contrast materials market. Emerging opportunities include the development of targeted contrast agents for improved disease diagnosis, expansion into new geographic markets, and strategic partnerships to leverage technological advancements. The development of biodegradable and biocompatible contrast agents presents a significant opportunity for growth.
Leading Players in the Contrast Materials Sector
- GE Healthcare
- Bayer
- Bracco Imaging
- Guerbet Group
- Hengrui Medicine
- Lantheus
- YRPG
- BeiLu Pharma
Key Milestones in Contrast Materials Industry
- 2020: Launch of a novel MRI contrast agent with improved safety profile by GE Healthcare.
- 2021: Acquisition of a smaller contrast agent manufacturer by Bayer.
- 2022: Approval of a new CT contrast agent with enhanced image quality by Bracco Imaging.
- 2023: Collaboration between Guerbet Group and a research institution to develop targeted contrast agents. (Further milestones to be added as data becomes available).
Strategic Outlook for Contrast Materials Market
The contrast materials market is poised for significant growth driven by technological innovations, increased adoption of advanced imaging techniques, and expansion into emerging markets. Strategic partnerships, investments in R&D, and focused product development are key success factors for companies operating in this dynamic market. The continued focus on enhancing safety and efficacy will be crucial for maintaining market leadership.
Contrast Materials Segmentation
-
1. Application
- 1.1. Hospitals
- 1.2. Clinics
-
2. Types
- 2.1. X-ray & CT
- 2.2. MRI
- 2.3. Ultrasound
Contrast Materials Segmentation By Geography
-
1. North America
- 1.1. United States
- 1.2. Canada
- 1.3. Mexico
-
2. South America
- 2.1. Brazil
- 2.2. Argentina
- 2.3. Rest of South America
-
3. Europe
- 3.1. United Kingdom
- 3.2. Germany
- 3.3. France
- 3.4. Italy
- 3.5. Spain
- 3.6. Russia
- 3.7. Benelux
- 3.8. Nordics
- 3.9. Rest of Europe
-
4. Middle East & Africa
- 4.1. Turkey
- 4.2. Israel
- 4.3. GCC
- 4.4. North Africa
- 4.5. South Africa
- 4.6. Rest of Middle East & Africa
-
5. Asia Pacific
- 5.1. China
- 5.2. India
- 5.3. Japan
- 5.4. South Korea
- 5.5. ASEAN
- 5.6. Oceania
- 5.7. Rest of Asia Pacific
Contrast Materials Regional Market Share
Geographic Coverage of Contrast Materials
Contrast Materials REPORT HIGHLIGHTS
| Aspects | Details |
|---|---|
| Study Period | 2020-2034 |
| Base Year | 2025 |
| Estimated Year | 2026 |
| Forecast Period | 2026-2034 |
| Historical Period | 2020-2025 |
| Growth Rate | CAGR of 7% from 2020-2034 |
| Segmentation |
|
Table of Contents
- 1. Introduction
- 1.1. Research Scope
- 1.2. Market Segmentation
- 1.3. Research Methodology
- 1.4. Definitions and Assumptions
- 2. Executive Summary
- 2.1. Introduction
- 3. Market Dynamics
- 3.1. Introduction
- 3.2. Market Drivers
- 3.3. Market Restrains
- 3.4. Market Trends
- 4. Market Factor Analysis
- 4.1. Porters Five Forces
- 4.2. Supply/Value Chain
- 4.3. PESTEL analysis
- 4.4. Market Entropy
- 4.5. Patent/Trademark Analysis
- 5. Global Contrast Materials Analysis, Insights and Forecast, 2020-2032
- 5.1. Market Analysis, Insights and Forecast - by Application
- 5.1.1. Hospitals
- 5.1.2. Clinics
- 5.2. Market Analysis, Insights and Forecast - by Types
- 5.2.1. X-ray & CT
- 5.2.2. MRI
- 5.2.3. Ultrasound
- 5.3. Market Analysis, Insights and Forecast - by Region
- 5.3.1. North America
- 5.3.2. South America
- 5.3.3. Europe
- 5.3.4. Middle East & Africa
- 5.3.5. Asia Pacific
- 5.1. Market Analysis, Insights and Forecast - by Application
- 6. North America Contrast Materials Analysis, Insights and Forecast, 2020-2032
- 6.1. Market Analysis, Insights and Forecast - by Application
- 6.1.1. Hospitals
- 6.1.2. Clinics
- 6.2. Market Analysis, Insights and Forecast - by Types
- 6.2.1. X-ray & CT
- 6.2.2. MRI
- 6.2.3. Ultrasound
- 6.1. Market Analysis, Insights and Forecast - by Application
- 7. South America Contrast Materials Analysis, Insights and Forecast, 2020-2032
- 7.1. Market Analysis, Insights and Forecast - by Application
- 7.1.1. Hospitals
- 7.1.2. Clinics
- 7.2. Market Analysis, Insights and Forecast - by Types
- 7.2.1. X-ray & CT
- 7.2.2. MRI
- 7.2.3. Ultrasound
- 7.1. Market Analysis, Insights and Forecast - by Application
- 8. Europe Contrast Materials Analysis, Insights and Forecast, 2020-2032
- 8.1. Market Analysis, Insights and Forecast - by Application
- 8.1.1. Hospitals
- 8.1.2. Clinics
- 8.2. Market Analysis, Insights and Forecast - by Types
- 8.2.1. X-ray & CT
- 8.2.2. MRI
- 8.2.3. Ultrasound
- 8.1. Market Analysis, Insights and Forecast - by Application
- 9. Middle East & Africa Contrast Materials Analysis, Insights and Forecast, 2020-2032
- 9.1. Market Analysis, Insights and Forecast - by Application
- 9.1.1. Hospitals
- 9.1.2. Clinics
- 9.2. Market Analysis, Insights and Forecast - by Types
- 9.2.1. X-ray & CT
- 9.2.2. MRI
- 9.2.3. Ultrasound
- 9.1. Market Analysis, Insights and Forecast - by Application
- 10. Asia Pacific Contrast Materials Analysis, Insights and Forecast, 2020-2032
- 10.1. Market Analysis, Insights and Forecast - by Application
- 10.1.1. Hospitals
- 10.1.2. Clinics
- 10.2. Market Analysis, Insights and Forecast - by Types
- 10.2.1. X-ray & CT
- 10.2.2. MRI
- 10.2.3. Ultrasound
- 10.1. Market Analysis, Insights and Forecast - by Application
- 11. Competitive Analysis
- 11.1. Global Market Share Analysis 2025
- 11.2. Company Profiles
- 11.2.1 GE Healthcare
- 11.2.1.1. Overview
- 11.2.1.2. Products
- 11.2.1.3. SWOT Analysis
- 11.2.1.4. Recent Developments
- 11.2.1.5. Financials (Based on Availability)
- 11.2.2 Bayer
- 11.2.2.1. Overview
- 11.2.2.2. Products
- 11.2.2.3. SWOT Analysis
- 11.2.2.4. Recent Developments
- 11.2.2.5. Financials (Based on Availability)
- 11.2.3 Bracco Imaging
- 11.2.3.1. Overview
- 11.2.3.2. Products
- 11.2.3.3. SWOT Analysis
- 11.2.3.4. Recent Developments
- 11.2.3.5. Financials (Based on Availability)
- 11.2.4 Guerbet Group
- 11.2.4.1. Overview
- 11.2.4.2. Products
- 11.2.4.3. SWOT Analysis
- 11.2.4.4. Recent Developments
- 11.2.4.5. Financials (Based on Availability)
- 11.2.5 Hengrui Medicine
- 11.2.5.1. Overview
- 11.2.5.2. Products
- 11.2.5.3. SWOT Analysis
- 11.2.5.4. Recent Developments
- 11.2.5.5. Financials (Based on Availability)
- 11.2.6 Lantheus
- 11.2.6.1. Overview
- 11.2.6.2. Products
- 11.2.6.3. SWOT Analysis
- 11.2.6.4. Recent Developments
- 11.2.6.5. Financials (Based on Availability)
- 11.2.7 YRPG
- 11.2.7.1. Overview
- 11.2.7.2. Products
- 11.2.7.3. SWOT Analysis
- 11.2.7.4. Recent Developments
- 11.2.7.5. Financials (Based on Availability)
- 11.2.8 BeiLu Pharma
- 11.2.8.1. Overview
- 11.2.8.2. Products
- 11.2.8.3. SWOT Analysis
- 11.2.8.4. Recent Developments
- 11.2.8.5. Financials (Based on Availability)
- 11.2.1 GE Healthcare
List of Figures
- Figure 1: Global Contrast Materials Revenue Breakdown (million, %) by Region 2025 & 2033
- Figure 2: North America Contrast Materials Revenue (million), by Application 2025 & 2033
- Figure 3: North America Contrast Materials Revenue Share (%), by Application 2025 & 2033
- Figure 4: North America Contrast Materials Revenue (million), by Types 2025 & 2033
- Figure 5: North America Contrast Materials Revenue Share (%), by Types 2025 & 2033
- Figure 6: North America Contrast Materials Revenue (million), by Country 2025 & 2033
- Figure 7: North America Contrast Materials Revenue Share (%), by Country 2025 & 2033
- Figure 8: South America Contrast Materials Revenue (million), by Application 2025 & 2033
- Figure 9: South America Contrast Materials Revenue Share (%), by Application 2025 & 2033
- Figure 10: South America Contrast Materials Revenue (million), by Types 2025 & 2033
- Figure 11: South America Contrast Materials Revenue Share (%), by Types 2025 & 2033
- Figure 12: South America Contrast Materials Revenue (million), by Country 2025 & 2033
- Figure 13: South America Contrast Materials Revenue Share (%), by Country 2025 & 2033
- Figure 14: Europe Contrast Materials Revenue (million), by Application 2025 & 2033
- Figure 15: Europe Contrast Materials Revenue Share (%), by Application 2025 & 2033
- Figure 16: Europe Contrast Materials Revenue (million), by Types 2025 & 2033
- Figure 17: Europe Contrast Materials Revenue Share (%), by Types 2025 & 2033
- Figure 18: Europe Contrast Materials Revenue (million), by Country 2025 & 2033
- Figure 19: Europe Contrast Materials Revenue Share (%), by Country 2025 & 2033
- Figure 20: Middle East & Africa Contrast Materials Revenue (million), by Application 2025 & 2033
- Figure 21: Middle East & Africa Contrast Materials Revenue Share (%), by Application 2025 & 2033
- Figure 22: Middle East & Africa Contrast Materials Revenue (million), by Types 2025 & 2033
- Figure 23: Middle East & Africa Contrast Materials Revenue Share (%), by Types 2025 & 2033
- Figure 24: Middle East & Africa Contrast Materials Revenue (million), by Country 2025 & 2033
- Figure 25: Middle East & Africa Contrast Materials Revenue Share (%), by Country 2025 & 2033
- Figure 26: Asia Pacific Contrast Materials Revenue (million), by Application 2025 & 2033
- Figure 27: Asia Pacific Contrast Materials Revenue Share (%), by Application 2025 & 2033
- Figure 28: Asia Pacific Contrast Materials Revenue (million), by Types 2025 & 2033
- Figure 29: Asia Pacific Contrast Materials Revenue Share (%), by Types 2025 & 2033
- Figure 30: Asia Pacific Contrast Materials Revenue (million), by Country 2025 & 2033
- Figure 31: Asia Pacific Contrast Materials Revenue Share (%), by Country 2025 & 2033
List of Tables
- Table 1: Global Contrast Materials Revenue million Forecast, by Application 2020 & 2033
- Table 2: Global Contrast Materials Revenue million Forecast, by Types 2020 & 2033
- Table 3: Global Contrast Materials Revenue million Forecast, by Region 2020 & 2033
- Table 4: Global Contrast Materials Revenue million Forecast, by Application 2020 & 2033
- Table 5: Global Contrast Materials Revenue million Forecast, by Types 2020 & 2033
- Table 6: Global Contrast Materials Revenue million Forecast, by Country 2020 & 2033
- Table 7: United States Contrast Materials Revenue (million) Forecast, by Application 2020 & 2033
- Table 8: Canada Contrast Materials Revenue (million) Forecast, by Application 2020 & 2033
- Table 9: Mexico Contrast Materials Revenue (million) Forecast, by Application 2020 & 2033
- Table 10: Global Contrast Materials Revenue million Forecast, by Application 2020 & 2033
- Table 11: Global Contrast Materials Revenue million Forecast, by Types 2020 & 2033
- Table 12: Global Contrast Materials Revenue million Forecast, by Country 2020 & 2033
- Table 13: Brazil Contrast Materials Revenue (million) Forecast, by Application 2020 & 2033
- Table 14: Argentina Contrast Materials Revenue (million) Forecast, by Application 2020 & 2033
- Table 15: Rest of South America Contrast Materials Revenue (million) Forecast, by Application 2020 & 2033
- Table 16: Global Contrast Materials Revenue million Forecast, by Application 2020 & 2033
- Table 17: Global Contrast Materials Revenue million Forecast, by Types 2020 & 2033
- Table 18: Global Contrast Materials Revenue million Forecast, by Country 2020 & 2033
- Table 19: United Kingdom Contrast Materials Revenue (million) Forecast, by Application 2020 & 2033
- Table 20: Germany Contrast Materials Revenue (million) Forecast, by Application 2020 & 2033
- Table 21: France Contrast Materials Revenue (million) Forecast, by Application 2020 & 2033
- Table 22: Italy Contrast Materials Revenue (million) Forecast, by Application 2020 & 2033
- Table 23: Spain Contrast Materials Revenue (million) Forecast, by Application 2020 & 2033
- Table 24: Russia Contrast Materials Revenue (million) Forecast, by Application 2020 & 2033
- Table 25: Benelux Contrast Materials Revenue (million) Forecast, by Application 2020 & 2033
- Table 26: Nordics Contrast Materials Revenue (million) Forecast, by Application 2020 & 2033
- Table 27: Rest of Europe Contrast Materials Revenue (million) Forecast, by Application 2020 & 2033
- Table 28: Global Contrast Materials Revenue million Forecast, by Application 2020 & 2033
- Table 29: Global Contrast Materials Revenue million Forecast, by Types 2020 & 2033
- Table 30: Global Contrast Materials Revenue million Forecast, by Country 2020 & 2033
- Table 31: Turkey Contrast Materials Revenue (million) Forecast, by Application 2020 & 2033
- Table 32: Israel Contrast Materials Revenue (million) Forecast, by Application 2020 & 2033
- Table 33: GCC Contrast Materials Revenue (million) Forecast, by Application 2020 & 2033
- Table 34: North Africa Contrast Materials Revenue (million) Forecast, by Application 2020 & 2033
- Table 35: South Africa Contrast Materials Revenue (million) Forecast, by Application 2020 & 2033
- Table 36: Rest of Middle East & Africa Contrast Materials Revenue (million) Forecast, by Application 2020 & 2033
- Table 37: Global Contrast Materials Revenue million Forecast, by Application 2020 & 2033
- Table 38: Global Contrast Materials Revenue million Forecast, by Types 2020 & 2033
- Table 39: Global Contrast Materials Revenue million Forecast, by Country 2020 & 2033
- Table 40: China Contrast Materials Revenue (million) Forecast, by Application 2020 & 2033
- Table 41: India Contrast Materials Revenue (million) Forecast, by Application 2020 & 2033
- Table 42: Japan Contrast Materials Revenue (million) Forecast, by Application 2020 & 2033
- Table 43: South Korea Contrast Materials Revenue (million) Forecast, by Application 2020 & 2033
- Table 44: ASEAN Contrast Materials Revenue (million) Forecast, by Application 2020 & 2033
- Table 45: Oceania Contrast Materials Revenue (million) Forecast, by Application 2020 & 2033
- Table 46: Rest of Asia Pacific Contrast Materials Revenue (million) Forecast, by Application 2020 & 2033
Frequently Asked Questions
1. What is the projected Compound Annual Growth Rate (CAGR) of the Contrast Materials?
The projected CAGR is approximately 7%.
2. Which companies are prominent players in the Contrast Materials?
Key companies in the market include GE Healthcare, Bayer, Bracco Imaging, Guerbet Group, Hengrui Medicine, Lantheus, YRPG, BeiLu Pharma.
3. What are the main segments of the Contrast Materials?
The market segments include Application, Types.
4. Can you provide details about the market size?
The market size is estimated to be USD 6206 million as of 2022.
5. What are some drivers contributing to market growth?
N/A
6. What are the notable trends driving market growth?
N/A
7. Are there any restraints impacting market growth?
N/A
8. Can you provide examples of recent developments in the market?
N/A
9. What pricing options are available for accessing the report?
Pricing options include single-user, multi-user, and enterprise licenses priced at USD 2900.00, USD 4350.00, and USD 5800.00 respectively.
10. Is the market size provided in terms of value or volume?
The market size is provided in terms of value, measured in million.
11. Are there any specific market keywords associated with the report?
Yes, the market keyword associated with the report is "Contrast Materials," which aids in identifying and referencing the specific market segment covered.
12. How do I determine which pricing option suits my needs best?
The pricing options vary based on user requirements and access needs. Individual users may opt for single-user licenses, while businesses requiring broader access may choose multi-user or enterprise licenses for cost-effective access to the report.
13. Are there any additional resources or data provided in the Contrast Materials report?
While the report offers comprehensive insights, it's advisable to review the specific contents or supplementary materials provided to ascertain if additional resources or data are available.
14. How can I stay updated on further developments or reports in the Contrast Materials?
To stay informed about further developments, trends, and reports in the Contrast Materials, consider subscribing to industry newsletters, following relevant companies and organizations, or regularly checking reputable industry news sources and publications.
Methodology
Step 1 - Identification of Relevant Samples Size from Population Database


Step 2 - Approaches for Defining Global Market Size (Value, Volume* & Price*)

Note*: In applicable scenarios
Step 3 - Data Sources
Primary Research
- Web Analytics
- Survey Reports
- Research Institute
- Latest Research Reports
- Opinion Leaders
Secondary Research
- Annual Reports
- White Paper
- Latest Press Release
- Industry Association
- Paid Database
- Investor Presentations

Step 4 - Data Triangulation
Involves using different sources of information in order to increase the validity of a study
These sources are likely to be stakeholders in a program - participants, other researchers, program staff, other community members, and so on.
Then we put all data in single framework & apply various statistical tools to find out the dynamic on the market.
During the analysis stage, feedback from the stakeholder groups would be compared to determine areas of agreement as well as areas of divergence