

Key Insights
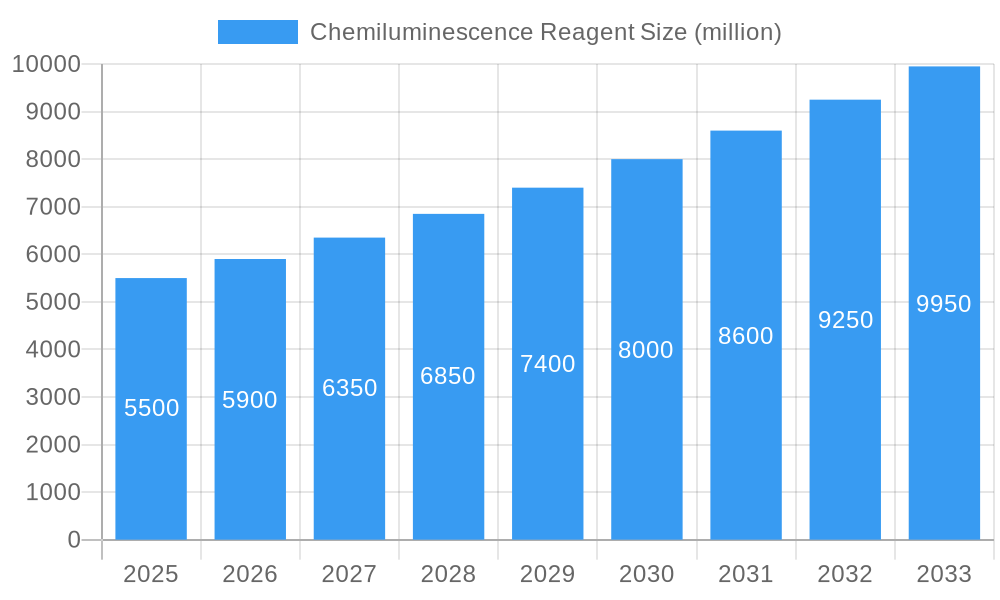
The global Chemiluminescence Reagent market is forecast for significant expansion, driven by the escalating need for precise and sensitive diagnostic solutions across diverse healthcare sectors. With an estimated market size of 6.64 billion in 2025, the market is set for substantial growth, projecting a Compound Annual Growth Rate (CAGR) of 6.1% through 2033. This growth is primarily propelled by expanding applications in critical areas such as tumor detection, where early and accurate identification is vital for patient outcomes. The increasing global prevalence of cardiovascular and infectious diseases further necessitates advanced diagnostic tools, positioning chemiluminescence reagents as essential in contemporary laboratory testing. Technological advancements in immunoassay techniques and the development of novel reagent formulations with improved sensitivity and specificity are also key drivers, facilitating earlier and more precise disease diagnosis.
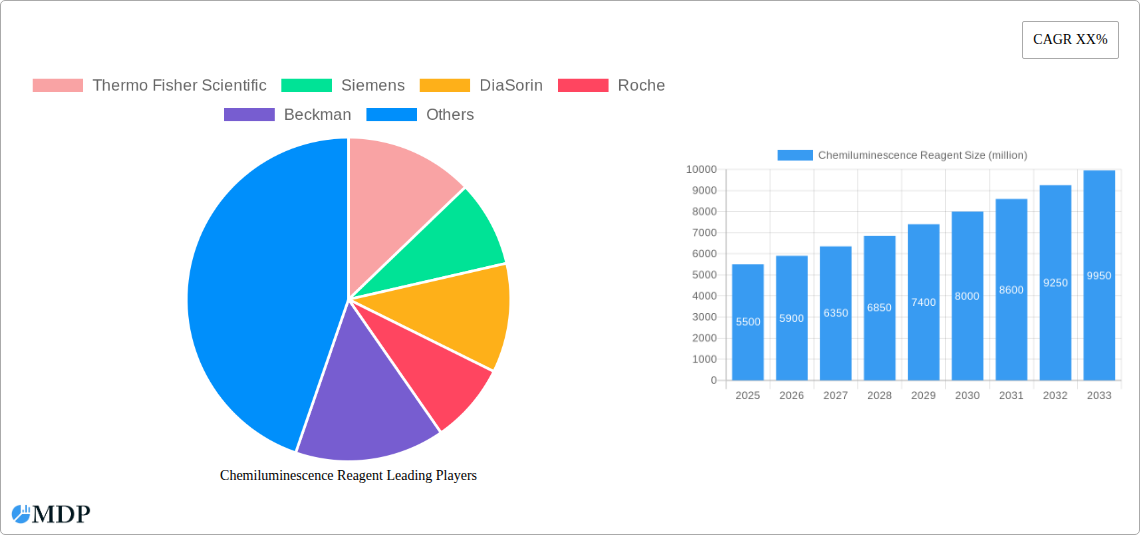
Chemiluminescence Reagent Market Size (In Billion)
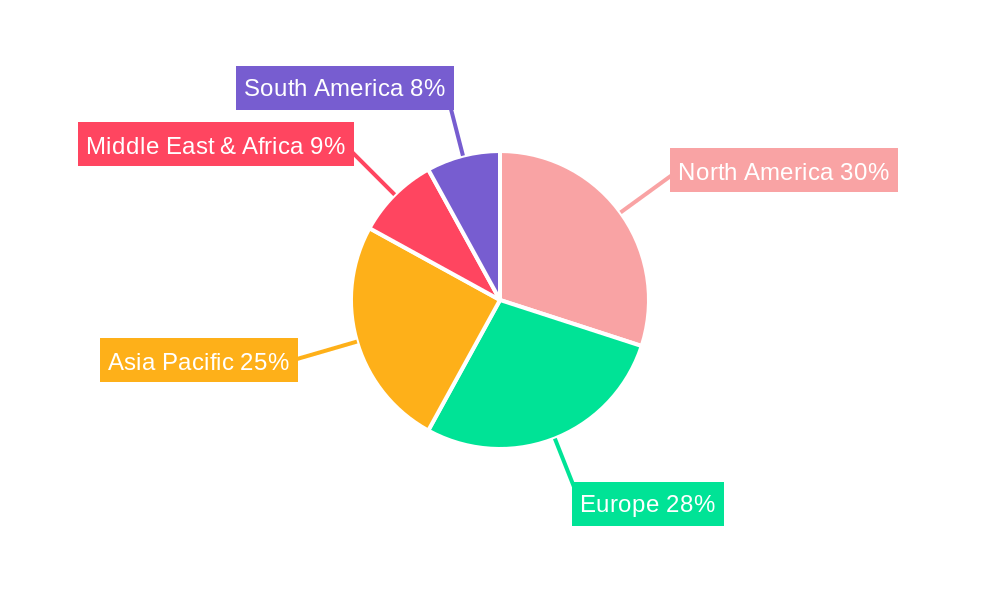
Key application segments include Tumor Detection, Thyroid Function Detection, Cardiovascular and Myocardial Markers, and Infectious Disease Detection. Indirect Chemiluminescence currently holds a dominant market share due to its proven efficacy and widespread adoption. However, Direct Chemiluminescence and Electrochemiluminescence are anticipated to experience considerable growth owing to enhanced performance characteristics and suitability for high-throughput screening. Geographically, the Asia Pacific region, particularly China and India, is emerging as a high-growth market, supported by expanding healthcare infrastructure, rising healthcare expenditure, and increased awareness of early disease detection. North America and Europe remain substantial markets, characterized by robust healthcare systems and a strong focus on research and development. Leading companies such as Thermo Fisher Scientific, Siemens, and Roche are actively influencing market dynamics through continuous innovation and strategic partnerships. The market is projected to reach an estimated value of 9.5 billion by 2033, highlighting its considerable economic impact and pivotal role in advancing global healthcare diagnostics.
Chemiluminescence Reagent Company Market Share
Chemiluminescence Reagent Market: In-depth Analysis, Trends, and Future Outlook (2019–2033)
This comprehensive report provides a detailed analysis of the global Chemiluminescence Reagent market, encompassing historical trends, current dynamics, and future projections. With a study period from 2019 to 2033, and a base and estimated year of 2025, this report offers invaluable insights for industry stakeholders seeking to understand market growth drivers, technological advancements, competitive landscapes, and emerging opportunities in this rapidly evolving sector. The market is segmented by application and type, with leading companies and key milestones meticulously documented.
Chemiluminescence Reagent Market Dynamics & Concentration
The Chemiluminescence Reagent market exhibits a moderate to high concentration, with a few dominant players accounting for a significant portion of the market share. Key innovation drivers include the continuous development of more sensitive and specific assays, driven by the increasing demand for early and accurate disease detection. Regulatory frameworks, particularly in major markets like the United States and European Union, play a crucial role in shaping product approvals and market access, fostering innovation while ensuring safety and efficacy. Product substitutes, while present, are largely outpaced by the superior performance and broad applicability of chemiluminescence assays. End-user trends highlight a strong preference for automated, high-throughput solutions, particularly in clinical diagnostics and research laboratories. Mergers and acquisitions (M&A) activities are prevalent as larger companies aim to expand their product portfolios and geographical reach, consolidate market power, and acquire cutting-edge technologies. M&A deal counts have been steadily increasing, indicating a strategic consolidation trend.
Chemiluminescence Reagent Industry Trends & Analysis
The Chemiluminescence Reagent industry is poised for robust growth, driven by several interconnected factors. The Compound Annual Growth Rate (CAGR) is projected to be substantial throughout the forecast period (2025–2033), reflecting the increasing adoption of chemiluminescence-based diagnostic tools in healthcare. Market penetration is expanding rapidly, particularly in emerging economies, as awareness of the benefits of accurate and timely diagnostics grows. Technological disruptions are at the forefront, with advancements in assay design, detection technologies, and automation significantly enhancing the performance and efficiency of chemiluminescence assays. Consumer preferences are increasingly leaning towards personalized medicine and predictive diagnostics, areas where chemiluminescence reagents excel due to their sensitivity and ability to detect a wide range of biomarkers. Competitive dynamics are characterized by intense innovation, strategic partnerships, and a focus on cost-effectiveness and ease of use. The growing prevalence of chronic diseases, coupled with an aging global population, fuels the demand for diagnostic solutions that can accurately identify and monitor various health conditions, thereby driving market expansion. Furthermore, the increasing investment in research and development by major industry players is leading to the introduction of novel chemiluminescence assays for an expanding array of applications.
Leading Markets & Segments in Chemiluminescence Reagent
The global Chemiluminescence Reagent market is dominated by North America, driven by its advanced healthcare infrastructure, high disposable incomes, and a strong emphasis on early disease detection. Within North America, the United States stands out as the leading country, fueled by substantial investments in research and development, a robust regulatory framework that encourages innovation, and a high prevalence of target diseases.
In terms of Application, Tumor Detection is a leading segment. Key drivers include the rising global incidence of cancer, the increasing demand for early cancer screening and diagnosis, and the development of highly sensitive chemiluminescence assays for tumor markers. The ability of these reagents to detect minute quantities of cancer biomarkers at early stages significantly contributes to improved patient outcomes and survival rates.
Infectious Disease Detection is another pivotal segment. The recurrent outbreaks of infectious diseases worldwide and the growing need for rapid and accurate diagnostic tests for pathogens like HIV, Hepatitis, and emerging viruses are major growth catalysts. Chemiluminescence assays offer high throughput and excellent sensitivity, making them indispensable tools in public health surveillance and outbreak management.
Among the Types, Indirect Chemiluminescence holds a significant market share due to its versatility and established efficacy in various diagnostic assays. However, Electrochemiluminescence (ECL) is rapidly gaining traction due to its superior sensitivity, broader dynamic range, and lower background noise, making it ideal for detecting low-abundance analytes. This technological advancement is driving its adoption in sophisticated diagnostic platforms.
Chemiluminescence Reagent Product Developments
Product developments in the Chemiluminescence Reagent market are characterized by a relentless pursuit of enhanced sensitivity, specificity, and multiplexing capabilities. Innovations are focused on novel luminophores, improved assay chemistries, and miniaturized detection systems. These advancements enable the simultaneous detection of multiple biomarkers from a single sample, leading to more efficient and cost-effective diagnostics. Competitive advantages are derived from faster assay times, reduced sample volumes, and improved accuracy, particularly for detecting early-stage diseases and low-abundance analytes. The market fit for these new products is strong, addressing the growing demand for advanced diagnostic solutions in clinical laboratories and research settings.
Key Drivers of Chemiluminescence Reagent Growth
Several key factors are driving the growth of the Chemiluminescence Reagent market. Technological advancements in assay design and detection platforms are crucial, enabling higher sensitivity and specificity. The increasing global prevalence of chronic diseases, such as cancer and cardiovascular conditions, fuels demand for accurate diagnostic tools. Growing healthcare expenditure, particularly in emerging economies, is expanding access to advanced diagnostic technologies. Favorable regulatory environments that support the approval and adoption of innovative diagnostic solutions also contribute significantly. Furthermore, the increasing demand for in-vitro diagnostics (IVD) for early disease detection and personalized medicine applications is a primary growth accelerator.
Challenges in the Chemiluminescence Reagent Market
Despite its robust growth trajectory, the Chemiluminescence Reagent market faces certain challenges. Stringent regulatory hurdles for new product approvals can lead to extended timelines and increased development costs. Supply chain disruptions, as witnessed in recent global events, can impact the availability of raw materials and finished products. Intense competition from other diagnostic technologies and the pressure to offer cost-effective solutions can impact profit margins. Furthermore, the need for specialized instrumentation for certain chemiluminescence assays can act as a barrier to adoption in resource-limited settings. The high cost of certain reagents can also be a restraining factor for widespread implementation.
Emerging Opportunities in Chemiluminescence Reagent
Emerging opportunities in the Chemiluminescence Reagent market are largely driven by technological breakthroughs and strategic market expansion. The development of point-of-care (POC) chemiluminescence devices presents a significant growth avenue, enabling rapid diagnostics in diverse settings. Strategic partnerships between reagent manufacturers and diagnostic instrument providers are crucial for developing integrated solutions. The growing demand for personalized medicine and companion diagnostics creates opportunities for highly specific and sensitive chemiluminescence assays. Furthermore, the expanding veterinary diagnostics market and the increasing adoption of chemiluminescence in food safety and environmental testing offer new avenues for growth.
Leading Players in the Chemiluminescence Reagent Sector
- Thermo Fisher Scientific
- Siemens
- DiaSorin
- Roche
- Beckman Coulter
- Abbott GmbH
- PerkinElmer
- CovalAb
- Quanta BioDesign
- Invitron
- BGI Group
- Merck KGaA
- Autobio
- Mindray
- Maccura
- Snibe
- Bio-Rad Laboratories
Key Milestones in Chemiluminescence Reagent Industry
- 2019: Launch of highly sensitive chemiluminescence assays for early cancer detection.
- 2020: Increased demand for infectious disease testing kits due to global health events.
- 2021: Advancements in multiplexing capabilities for simultaneous biomarker detection.
- 2022: Significant investments in R&D for novel luminophore development.
- 2023: Growing adoption of electrochemiluminescence in advanced diagnostic platforms.
- 2024: Strategic collaborations for developing point-of-care chemiluminescence solutions.
Strategic Outlook for Chemiluminescence Reagent Market
The strategic outlook for the Chemiluminescence Reagent market remains highly positive, driven by ongoing technological innovation and the increasing global demand for accurate and efficient diagnostic solutions. Growth accelerators include the expansion of chemiluminescence applications in personalized medicine, the development of integrated automated systems, and the increasing penetration in emerging markets. Strategic opportunities lie in forging partnerships to develop novel assays for unmet diagnostic needs, expanding into veterinary and environmental testing sectors, and leveraging advancements in artificial intelligence for data analysis and assay optimization. The market is expected to witness continued growth fueled by its versatility, sensitivity, and ability to address critical healthcare challenges.
Chemiluminescence Reagent Segmentation
-
1. Application
- 1.1. Tumor Detection
- 1.2. Thyroid Function Detection
- 1.3. Cardiovascular and Myocardial Markers
- 1.4. Infectious Disease Detection
- 1.5. Other
-
2. Types
- 2.1. Indirect Chemiluminescence
- 2.2. Direct Chemiluminescence
- 2.3. Electrochemiluminescence
Chemiluminescence Reagent Segmentation By Geography
-
1. North America
- 1.1. United States
- 1.2. Canada
- 1.3. Mexico
-
2. South America
- 2.1. Brazil
- 2.2. Argentina
- 2.3. Rest of South America
-
3. Europe
- 3.1. United Kingdom
- 3.2. Germany
- 3.3. France
- 3.4. Italy
- 3.5. Spain
- 3.6. Russia
- 3.7. Benelux
- 3.8. Nordics
- 3.9. Rest of Europe
-
4. Middle East & Africa
- 4.1. Turkey
- 4.2. Israel
- 4.3. GCC
- 4.4. North Africa
- 4.5. South Africa
- 4.6. Rest of Middle East & Africa
-
5. Asia Pacific
- 5.1. China
- 5.2. India
- 5.3. Japan
- 5.4. South Korea
- 5.5. ASEAN
- 5.6. Oceania
- 5.7. Rest of Asia Pacific
Chemiluminescence Reagent Regional Market Share
Geographic Coverage of Chemiluminescence Reagent
Chemiluminescence Reagent REPORT HIGHLIGHTS
| Aspects | Details |
|---|---|
| Study Period | 2020-2034 |
| Base Year | 2025 |
| Estimated Year | 2026 |
| Forecast Period | 2026-2034 |
| Historical Period | 2020-2025 |
| Growth Rate | CAGR of 6.1% from 2020-2034 |
| Segmentation |
|
Table of Contents
- 1. Introduction
- 1.1. Research Scope
- 1.2. Market Segmentation
- 1.3. Research Objective
- 1.4. Definitions and Assumptions
- 2. Executive Summary
- 2.1. Market Snapshot
- 3. Market Dynamics
- 3.1. Market Drivers
- 3.2. Market Restrains
- 3.3. Market Trends
- 3.4. Market Opportunities
- 4. Market Factor Analysis
- 4.1. Porters Five Forces
- 4.1.1. Bargaining Power of Suppliers
- 4.1.2. Bargaining Power of Buyers
- 4.1.3. Threat of New Entrants
- 4.1.4. Threat of Substitutes
- 4.1.5. Competitive Rivalry
- 4.2. PESTEL analysis
- 4.3. BCG Analysis
- 4.3.1. Stars (High Growth, High Market Share)
- 4.3.2. Cash Cows (Low Growth, High Market Share)
- 4.3.3. Question Mark (High Growth, Low Market Share)
- 4.3.4. Dogs (Low Growth, Low Market Share)
- 4.4. Ansoff Matrix Analysis
- 4.5. Supply Chain Analysis
- 4.6. Regulatory Landscape
- 4.7. Current Market Potential and Opportunity Assessment (TAM–SAM–SOM Framework)
- 4.8. MDP Analyst Note
- 4.1. Porters Five Forces
- 5. Market Analysis, Insights and Forecast 2021-2033
- 5.1. Market Analysis, Insights and Forecast - by Application
- 5.1.1. Tumor Detection
- 5.1.2. Thyroid Function Detection
- 5.1.3. Cardiovascular and Myocardial Markers
- 5.1.4. Infectious Disease Detection
- 5.1.5. Other
- 5.2. Market Analysis, Insights and Forecast - by Types
- 5.2.1. Indirect Chemiluminescence
- 5.2.2. Direct Chemiluminescence
- 5.2.3. Electrochemiluminescence
- 5.3. Market Analysis, Insights and Forecast - by Region
- 5.3.1. North America
- 5.3.2. South America
- 5.3.3. Europe
- 5.3.4. Middle East & Africa
- 5.3.5. Asia Pacific
- 5.1. Market Analysis, Insights and Forecast - by Application
- 6. Global Chemiluminescence Reagent Analysis, Insights and Forecast, 2021-2033
- 6.1. Market Analysis, Insights and Forecast - by Application
- 6.1.1. Tumor Detection
- 6.1.2. Thyroid Function Detection
- 6.1.3. Cardiovascular and Myocardial Markers
- 6.1.4. Infectious Disease Detection
- 6.1.5. Other
- 6.2. Market Analysis, Insights and Forecast - by Types
- 6.2.1. Indirect Chemiluminescence
- 6.2.2. Direct Chemiluminescence
- 6.2.3. Electrochemiluminescence
- 6.1. Market Analysis, Insights and Forecast - by Application
- 7. North America Chemiluminescence Reagent Analysis, Insights and Forecast, 2020-2032
- 7.1. Market Analysis, Insights and Forecast - by Application
- 7.1.1. Tumor Detection
- 7.1.2. Thyroid Function Detection
- 7.1.3. Cardiovascular and Myocardial Markers
- 7.1.4. Infectious Disease Detection
- 7.1.5. Other
- 7.2. Market Analysis, Insights and Forecast - by Types
- 7.2.1. Indirect Chemiluminescence
- 7.2.2. Direct Chemiluminescence
- 7.2.3. Electrochemiluminescence
- 7.1. Market Analysis, Insights and Forecast - by Application
- 8. South America Chemiluminescence Reagent Analysis, Insights and Forecast, 2020-2032
- 8.1. Market Analysis, Insights and Forecast - by Application
- 8.1.1. Tumor Detection
- 8.1.2. Thyroid Function Detection
- 8.1.3. Cardiovascular and Myocardial Markers
- 8.1.4. Infectious Disease Detection
- 8.1.5. Other
- 8.2. Market Analysis, Insights and Forecast - by Types
- 8.2.1. Indirect Chemiluminescence
- 8.2.2. Direct Chemiluminescence
- 8.2.3. Electrochemiluminescence
- 8.1. Market Analysis, Insights and Forecast - by Application
- 9. Europe Chemiluminescence Reagent Analysis, Insights and Forecast, 2020-2032
- 9.1. Market Analysis, Insights and Forecast - by Application
- 9.1.1. Tumor Detection
- 9.1.2. Thyroid Function Detection
- 9.1.3. Cardiovascular and Myocardial Markers
- 9.1.4. Infectious Disease Detection
- 9.1.5. Other
- 9.2. Market Analysis, Insights and Forecast - by Types
- 9.2.1. Indirect Chemiluminescence
- 9.2.2. Direct Chemiluminescence
- 9.2.3. Electrochemiluminescence
- 9.1. Market Analysis, Insights and Forecast - by Application
- 10. Middle East & Africa Chemiluminescence Reagent Analysis, Insights and Forecast, 2020-2032
- 10.1. Market Analysis, Insights and Forecast - by Application
- 10.1.1. Tumor Detection
- 10.1.2. Thyroid Function Detection
- 10.1.3. Cardiovascular and Myocardial Markers
- 10.1.4. Infectious Disease Detection
- 10.1.5. Other
- 10.2. Market Analysis, Insights and Forecast - by Types
- 10.2.1. Indirect Chemiluminescence
- 10.2.2. Direct Chemiluminescence
- 10.2.3. Electrochemiluminescence
- 10.1. Market Analysis, Insights and Forecast - by Application
- 11. Asia Pacific Chemiluminescence Reagent Analysis, Insights and Forecast, 2020-2032
- 11.1. Market Analysis, Insights and Forecast - by Application
- 11.1.1. Tumor Detection
- 11.1.2. Thyroid Function Detection
- 11.1.3. Cardiovascular and Myocardial Markers
- 11.1.4. Infectious Disease Detection
- 11.1.5. Other
- 11.2. Market Analysis, Insights and Forecast - by Types
- 11.2.1. Indirect Chemiluminescence
- 11.2.2. Direct Chemiluminescence
- 11.2.3. Electrochemiluminescence
- 11.1. Market Analysis, Insights and Forecast - by Application
- 12. Competitive Analysis
- 12.1. Company Profiles
- 12.1.1 Thermo Fisher Scientific
- 12.1.1.1. Company Overview
- 12.1.1.2. Products
- 12.1.1.3. Company Financials
- 12.1.1.4. SWOT Analysis
- 12.1.2 Siemens
- 12.1.2.1. Company Overview
- 12.1.2.2. Products
- 12.1.2.3. Company Financials
- 12.1.2.4. SWOT Analysis
- 12.1.3 DiaSorin
- 12.1.3.1. Company Overview
- 12.1.3.2. Products
- 12.1.3.3. Company Financials
- 12.1.3.4. SWOT Analysis
- 12.1.4 Roche
- 12.1.4.1. Company Overview
- 12.1.4.2. Products
- 12.1.4.3. Company Financials
- 12.1.4.4. SWOT Analysis
- 12.1.5 Beckman
- 12.1.5.1. Company Overview
- 12.1.5.2. Products
- 12.1.5.3. Company Financials
- 12.1.5.4. SWOT Analysis
- 12.1.6 Abbott GmbH
- 12.1.6.1. Company Overview
- 12.1.6.2. Products
- 12.1.6.3. Company Financials
- 12.1.6.4. SWOT Analysis
- 12.1.7 PerkinElmer
- 12.1.7.1. Company Overview
- 12.1.7.2. Products
- 12.1.7.3. Company Financials
- 12.1.7.4. SWOT Analysis
- 12.1.8 CovalAb
- 12.1.8.1. Company Overview
- 12.1.8.2. Products
- 12.1.8.3. Company Financials
- 12.1.8.4. SWOT Analysis
- 12.1.9 Quanta BioDesign
- 12.1.9.1. Company Overview
- 12.1.9.2. Products
- 12.1.9.3. Company Financials
- 12.1.9.4. SWOT Analysis
- 12.1.10 Invitron
- 12.1.10.1. Company Overview
- 12.1.10.2. Products
- 12.1.10.3. Company Financials
- 12.1.10.4. SWOT Analysis
- 12.1.11 BGI Group
- 12.1.11.1. Company Overview
- 12.1.11.2. Products
- 12.1.11.3. Company Financials
- 12.1.11.4. SWOT Analysis
- 12.1.12 Merck KGaA
- 12.1.12.1. Company Overview
- 12.1.12.2. Products
- 12.1.12.3. Company Financials
- 12.1.12.4. SWOT Analysis
- 12.1.13 Autobio
- 12.1.13.1. Company Overview
- 12.1.13.2. Products
- 12.1.13.3. Company Financials
- 12.1.13.4. SWOT Analysis
- 12.1.14 Mindray
- 12.1.14.1. Company Overview
- 12.1.14.2. Products
- 12.1.14.3. Company Financials
- 12.1.14.4. SWOT Analysis
- 12.1.15 Maccura
- 12.1.15.1. Company Overview
- 12.1.15.2. Products
- 12.1.15.3. Company Financials
- 12.1.15.4. SWOT Analysis
- 12.1.16 Snibe
- 12.1.16.1. Company Overview
- 12.1.16.2. Products
- 12.1.16.3. Company Financials
- 12.1.16.4. SWOT Analysis
- 12.1.1 Thermo Fisher Scientific
- 12.2. Market Entropy
- 12.2.1 Company's Key Areas Served
- 12.2.2 Recent Developments
- 12.3. Company Market Share Analysis 2025
- 12.3.1 Top 5 Companies Market Share Analysis
- 12.3.2 Top 3 Companies Market Share Analysis
- 12.4. List of Potential Customers
- 13. Research Methodology
List of Figures
- Figure 1: Global Chemiluminescence Reagent Revenue Breakdown (billion, %) by Region 2025 & 2033
- Figure 2: Global Chemiluminescence Reagent Volume Breakdown (K, %) by Region 2025 & 2033
- Figure 3: North America Chemiluminescence Reagent Revenue (billion), by Application 2025 & 2033
- Figure 4: North America Chemiluminescence Reagent Volume (K), by Application 2025 & 2033
- Figure 5: North America Chemiluminescence Reagent Revenue Share (%), by Application 2025 & 2033
- Figure 6: North America Chemiluminescence Reagent Volume Share (%), by Application 2025 & 2033
- Figure 7: North America Chemiluminescence Reagent Revenue (billion), by Types 2025 & 2033
- Figure 8: North America Chemiluminescence Reagent Volume (K), by Types 2025 & 2033
- Figure 9: North America Chemiluminescence Reagent Revenue Share (%), by Types 2025 & 2033
- Figure 10: North America Chemiluminescence Reagent Volume Share (%), by Types 2025 & 2033
- Figure 11: North America Chemiluminescence Reagent Revenue (billion), by Country 2025 & 2033
- Figure 12: North America Chemiluminescence Reagent Volume (K), by Country 2025 & 2033
- Figure 13: North America Chemiluminescence Reagent Revenue Share (%), by Country 2025 & 2033
- Figure 14: North America Chemiluminescence Reagent Volume Share (%), by Country 2025 & 2033
- Figure 15: South America Chemiluminescence Reagent Revenue (billion), by Application 2025 & 2033
- Figure 16: South America Chemiluminescence Reagent Volume (K), by Application 2025 & 2033
- Figure 17: South America Chemiluminescence Reagent Revenue Share (%), by Application 2025 & 2033
- Figure 18: South America Chemiluminescence Reagent Volume Share (%), by Application 2025 & 2033
- Figure 19: South America Chemiluminescence Reagent Revenue (billion), by Types 2025 & 2033
- Figure 20: South America Chemiluminescence Reagent Volume (K), by Types 2025 & 2033
- Figure 21: South America Chemiluminescence Reagent Revenue Share (%), by Types 2025 & 2033
- Figure 22: South America Chemiluminescence Reagent Volume Share (%), by Types 2025 & 2033
- Figure 23: South America Chemiluminescence Reagent Revenue (billion), by Country 2025 & 2033
- Figure 24: South America Chemiluminescence Reagent Volume (K), by Country 2025 & 2033
- Figure 25: South America Chemiluminescence Reagent Revenue Share (%), by Country 2025 & 2033
- Figure 26: South America Chemiluminescence Reagent Volume Share (%), by Country 2025 & 2033
- Figure 27: Europe Chemiluminescence Reagent Revenue (billion), by Application 2025 & 2033
- Figure 28: Europe Chemiluminescence Reagent Volume (K), by Application 2025 & 2033
- Figure 29: Europe Chemiluminescence Reagent Revenue Share (%), by Application 2025 & 2033
- Figure 30: Europe Chemiluminescence Reagent Volume Share (%), by Application 2025 & 2033
- Figure 31: Europe Chemiluminescence Reagent Revenue (billion), by Types 2025 & 2033
- Figure 32: Europe Chemiluminescence Reagent Volume (K), by Types 2025 & 2033
- Figure 33: Europe Chemiluminescence Reagent Revenue Share (%), by Types 2025 & 2033
- Figure 34: Europe Chemiluminescence Reagent Volume Share (%), by Types 2025 & 2033
- Figure 35: Europe Chemiluminescence Reagent Revenue (billion), by Country 2025 & 2033
- Figure 36: Europe Chemiluminescence Reagent Volume (K), by Country 2025 & 2033
- Figure 37: Europe Chemiluminescence Reagent Revenue Share (%), by Country 2025 & 2033
- Figure 38: Europe Chemiluminescence Reagent Volume Share (%), by Country 2025 & 2033
- Figure 39: Middle East & Africa Chemiluminescence Reagent Revenue (billion), by Application 2025 & 2033
- Figure 40: Middle East & Africa Chemiluminescence Reagent Volume (K), by Application 2025 & 2033
- Figure 41: Middle East & Africa Chemiluminescence Reagent Revenue Share (%), by Application 2025 & 2033
- Figure 42: Middle East & Africa Chemiluminescence Reagent Volume Share (%), by Application 2025 & 2033
- Figure 43: Middle East & Africa Chemiluminescence Reagent Revenue (billion), by Types 2025 & 2033
- Figure 44: Middle East & Africa Chemiluminescence Reagent Volume (K), by Types 2025 & 2033
- Figure 45: Middle East & Africa Chemiluminescence Reagent Revenue Share (%), by Types 2025 & 2033
- Figure 46: Middle East & Africa Chemiluminescence Reagent Volume Share (%), by Types 2025 & 2033
- Figure 47: Middle East & Africa Chemiluminescence Reagent Revenue (billion), by Country 2025 & 2033
- Figure 48: Middle East & Africa Chemiluminescence Reagent Volume (K), by Country 2025 & 2033
- Figure 49: Middle East & Africa Chemiluminescence Reagent Revenue Share (%), by Country 2025 & 2033
- Figure 50: Middle East & Africa Chemiluminescence Reagent Volume Share (%), by Country 2025 & 2033
- Figure 51: Asia Pacific Chemiluminescence Reagent Revenue (billion), by Application 2025 & 2033
- Figure 52: Asia Pacific Chemiluminescence Reagent Volume (K), by Application 2025 & 2033
- Figure 53: Asia Pacific Chemiluminescence Reagent Revenue Share (%), by Application 2025 & 2033
- Figure 54: Asia Pacific Chemiluminescence Reagent Volume Share (%), by Application 2025 & 2033
- Figure 55: Asia Pacific Chemiluminescence Reagent Revenue (billion), by Types 2025 & 2033
- Figure 56: Asia Pacific Chemiluminescence Reagent Volume (K), by Types 2025 & 2033
- Figure 57: Asia Pacific Chemiluminescence Reagent Revenue Share (%), by Types 2025 & 2033
- Figure 58: Asia Pacific Chemiluminescence Reagent Volume Share (%), by Types 2025 & 2033
- Figure 59: Asia Pacific Chemiluminescence Reagent Revenue (billion), by Country 2025 & 2033
- Figure 60: Asia Pacific Chemiluminescence Reagent Volume (K), by Country 2025 & 2033
- Figure 61: Asia Pacific Chemiluminescence Reagent Revenue Share (%), by Country 2025 & 2033
- Figure 62: Asia Pacific Chemiluminescence Reagent Volume Share (%), by Country 2025 & 2033
List of Tables
- Table 1: Global Chemiluminescence Reagent Revenue billion Forecast, by Application 2020 & 2033
- Table 2: Global Chemiluminescence Reagent Volume K Forecast, by Application 2020 & 2033
- Table 3: Global Chemiluminescence Reagent Revenue billion Forecast, by Types 2020 & 2033
- Table 4: Global Chemiluminescence Reagent Volume K Forecast, by Types 2020 & 2033
- Table 5: Global Chemiluminescence Reagent Revenue billion Forecast, by Region 2020 & 2033
- Table 6: Global Chemiluminescence Reagent Volume K Forecast, by Region 2020 & 2033
- Table 7: Global Chemiluminescence Reagent Revenue billion Forecast, by Application 2020 & 2033
- Table 8: Global Chemiluminescence Reagent Volume K Forecast, by Application 2020 & 2033
- Table 9: Global Chemiluminescence Reagent Revenue billion Forecast, by Types 2020 & 2033
- Table 10: Global Chemiluminescence Reagent Volume K Forecast, by Types 2020 & 2033
- Table 11: Global Chemiluminescence Reagent Revenue billion Forecast, by Country 2020 & 2033
- Table 12: Global Chemiluminescence Reagent Volume K Forecast, by Country 2020 & 2033
- Table 13: United States Chemiluminescence Reagent Revenue (billion) Forecast, by Application 2020 & 2033
- Table 14: United States Chemiluminescence Reagent Volume (K) Forecast, by Application 2020 & 2033
- Table 15: Canada Chemiluminescence Reagent Revenue (billion) Forecast, by Application 2020 & 2033
- Table 16: Canada Chemiluminescence Reagent Volume (K) Forecast, by Application 2020 & 2033
- Table 17: Mexico Chemiluminescence Reagent Revenue (billion) Forecast, by Application 2020 & 2033
- Table 18: Mexico Chemiluminescence Reagent Volume (K) Forecast, by Application 2020 & 2033
- Table 19: Global Chemiluminescence Reagent Revenue billion Forecast, by Application 2020 & 2033
- Table 20: Global Chemiluminescence Reagent Volume K Forecast, by Application 2020 & 2033
- Table 21: Global Chemiluminescence Reagent Revenue billion Forecast, by Types 2020 & 2033
- Table 22: Global Chemiluminescence Reagent Volume K Forecast, by Types 2020 & 2033
- Table 23: Global Chemiluminescence Reagent Revenue billion Forecast, by Country 2020 & 2033
- Table 24: Global Chemiluminescence Reagent Volume K Forecast, by Country 2020 & 2033
- Table 25: Brazil Chemiluminescence Reagent Revenue (billion) Forecast, by Application 2020 & 2033
- Table 26: Brazil Chemiluminescence Reagent Volume (K) Forecast, by Application 2020 & 2033
- Table 27: Argentina Chemiluminescence Reagent Revenue (billion) Forecast, by Application 2020 & 2033
- Table 28: Argentina Chemiluminescence Reagent Volume (K) Forecast, by Application 2020 & 2033
- Table 29: Rest of South America Chemiluminescence Reagent Revenue (billion) Forecast, by Application 2020 & 2033
- Table 30: Rest of South America Chemiluminescence Reagent Volume (K) Forecast, by Application 2020 & 2033
- Table 31: Global Chemiluminescence Reagent Revenue billion Forecast, by Application 2020 & 2033
- Table 32: Global Chemiluminescence Reagent Volume K Forecast, by Application 2020 & 2033
- Table 33: Global Chemiluminescence Reagent Revenue billion Forecast, by Types 2020 & 2033
- Table 34: Global Chemiluminescence Reagent Volume K Forecast, by Types 2020 & 2033
- Table 35: Global Chemiluminescence Reagent Revenue billion Forecast, by Country 2020 & 2033
- Table 36: Global Chemiluminescence Reagent Volume K Forecast, by Country 2020 & 2033
- Table 37: United Kingdom Chemiluminescence Reagent Revenue (billion) Forecast, by Application 2020 & 2033
- Table 38: United Kingdom Chemiluminescence Reagent Volume (K) Forecast, by Application 2020 & 2033
- Table 39: Germany Chemiluminescence Reagent Revenue (billion) Forecast, by Application 2020 & 2033
- Table 40: Germany Chemiluminescence Reagent Volume (K) Forecast, by Application 2020 & 2033
- Table 41: France Chemiluminescence Reagent Revenue (billion) Forecast, by Application 2020 & 2033
- Table 42: France Chemiluminescence Reagent Volume (K) Forecast, by Application 2020 & 2033
- Table 43: Italy Chemiluminescence Reagent Revenue (billion) Forecast, by Application 2020 & 2033
- Table 44: Italy Chemiluminescence Reagent Volume (K) Forecast, by Application 2020 & 2033
- Table 45: Spain Chemiluminescence Reagent Revenue (billion) Forecast, by Application 2020 & 2033
- Table 46: Spain Chemiluminescence Reagent Volume (K) Forecast, by Application 2020 & 2033
- Table 47: Russia Chemiluminescence Reagent Revenue (billion) Forecast, by Application 2020 & 2033
- Table 48: Russia Chemiluminescence Reagent Volume (K) Forecast, by Application 2020 & 2033
- Table 49: Benelux Chemiluminescence Reagent Revenue (billion) Forecast, by Application 2020 & 2033
- Table 50: Benelux Chemiluminescence Reagent Volume (K) Forecast, by Application 2020 & 2033
- Table 51: Nordics Chemiluminescence Reagent Revenue (billion) Forecast, by Application 2020 & 2033
- Table 52: Nordics Chemiluminescence Reagent Volume (K) Forecast, by Application 2020 & 2033
- Table 53: Rest of Europe Chemiluminescence Reagent Revenue (billion) Forecast, by Application 2020 & 2033
- Table 54: Rest of Europe Chemiluminescence Reagent Volume (K) Forecast, by Application 2020 & 2033
- Table 55: Global Chemiluminescence Reagent Revenue billion Forecast, by Application 2020 & 2033
- Table 56: Global Chemiluminescence Reagent Volume K Forecast, by Application 2020 & 2033
- Table 57: Global Chemiluminescence Reagent Revenue billion Forecast, by Types 2020 & 2033
- Table 58: Global Chemiluminescence Reagent Volume K Forecast, by Types 2020 & 2033
- Table 59: Global Chemiluminescence Reagent Revenue billion Forecast, by Country 2020 & 2033
- Table 60: Global Chemiluminescence Reagent Volume K Forecast, by Country 2020 & 2033
- Table 61: Turkey Chemiluminescence Reagent Revenue (billion) Forecast, by Application 2020 & 2033
- Table 62: Turkey Chemiluminescence Reagent Volume (K) Forecast, by Application 2020 & 2033
- Table 63: Israel Chemiluminescence Reagent Revenue (billion) Forecast, by Application 2020 & 2033
- Table 64: Israel Chemiluminescence Reagent Volume (K) Forecast, by Application 2020 & 2033
- Table 65: GCC Chemiluminescence Reagent Revenue (billion) Forecast, by Application 2020 & 2033
- Table 66: GCC Chemiluminescence Reagent Volume (K) Forecast, by Application 2020 & 2033
- Table 67: North Africa Chemiluminescence Reagent Revenue (billion) Forecast, by Application 2020 & 2033
- Table 68: North Africa Chemiluminescence Reagent Volume (K) Forecast, by Application 2020 & 2033
- Table 69: South Africa Chemiluminescence Reagent Revenue (billion) Forecast, by Application 2020 & 2033
- Table 70: South Africa Chemiluminescence Reagent Volume (K) Forecast, by Application 2020 & 2033
- Table 71: Rest of Middle East & Africa Chemiluminescence Reagent Revenue (billion) Forecast, by Application 2020 & 2033
- Table 72: Rest of Middle East & Africa Chemiluminescence Reagent Volume (K) Forecast, by Application 2020 & 2033
- Table 73: Global Chemiluminescence Reagent Revenue billion Forecast, by Application 2020 & 2033
- Table 74: Global Chemiluminescence Reagent Volume K Forecast, by Application 2020 & 2033
- Table 75: Global Chemiluminescence Reagent Revenue billion Forecast, by Types 2020 & 2033
- Table 76: Global Chemiluminescence Reagent Volume K Forecast, by Types 2020 & 2033
- Table 77: Global Chemiluminescence Reagent Revenue billion Forecast, by Country 2020 & 2033
- Table 78: Global Chemiluminescence Reagent Volume K Forecast, by Country 2020 & 2033
- Table 79: China Chemiluminescence Reagent Revenue (billion) Forecast, by Application 2020 & 2033
- Table 80: China Chemiluminescence Reagent Volume (K) Forecast, by Application 2020 & 2033
- Table 81: India Chemiluminescence Reagent Revenue (billion) Forecast, by Application 2020 & 2033
- Table 82: India Chemiluminescence Reagent Volume (K) Forecast, by Application 2020 & 2033
- Table 83: Japan Chemiluminescence Reagent Revenue (billion) Forecast, by Application 2020 & 2033
- Table 84: Japan Chemiluminescence Reagent Volume (K) Forecast, by Application 2020 & 2033
- Table 85: South Korea Chemiluminescence Reagent Revenue (billion) Forecast, by Application 2020 & 2033
- Table 86: South Korea Chemiluminescence Reagent Volume (K) Forecast, by Application 2020 & 2033
- Table 87: ASEAN Chemiluminescence Reagent Revenue (billion) Forecast, by Application 2020 & 2033
- Table 88: ASEAN Chemiluminescence Reagent Volume (K) Forecast, by Application 2020 & 2033
- Table 89: Oceania Chemiluminescence Reagent Revenue (billion) Forecast, by Application 2020 & 2033
- Table 90: Oceania Chemiluminescence Reagent Volume (K) Forecast, by Application 2020 & 2033
- Table 91: Rest of Asia Pacific Chemiluminescence Reagent Revenue (billion) Forecast, by Application 2020 & 2033
- Table 92: Rest of Asia Pacific Chemiluminescence Reagent Volume (K) Forecast, by Application 2020 & 2033
Frequently Asked Questions
1. What is the projected Compound Annual Growth Rate (CAGR) of the Chemiluminescence Reagent?
The projected CAGR is approximately 6.1%.
2. Which companies are prominent players in the Chemiluminescence Reagent?
Key companies in the market include Thermo Fisher Scientific, Siemens, DiaSorin, Roche, Beckman, Abbott GmbH, PerkinElmer, CovalAb, Quanta BioDesign, Invitron, BGI Group, Merck KGaA, Autobio, Mindray, Maccura, Snibe.
3. What are the main segments of the Chemiluminescence Reagent?
The market segments include Application, Types.
4. Can you provide details about the market size?
The market size is estimated to be USD 6.64 billion as of 2022.
5. What are some drivers contributing to market growth?
N/A
6. What are the notable trends driving market growth?
N/A
7. Are there any restraints impacting market growth?
N/A
8. Can you provide examples of recent developments in the market?
N/A
9. What pricing options are available for accessing the report?
Pricing options include single-user, multi-user, and enterprise licenses priced at USD 3950.00, USD 5925.00, and USD 7900.00 respectively.
10. Is the market size provided in terms of value or volume?
The market size is provided in terms of value, measured in billion and volume, measured in K.
11. Are there any specific market keywords associated with the report?
Yes, the market keyword associated with the report is "Chemiluminescence Reagent," which aids in identifying and referencing the specific market segment covered.
12. How do I determine which pricing option suits my needs best?
The pricing options vary based on user requirements and access needs. Individual users may opt for single-user licenses, while businesses requiring broader access may choose multi-user or enterprise licenses for cost-effective access to the report.
13. Are there any additional resources or data provided in the Chemiluminescence Reagent report?
While the report offers comprehensive insights, it's advisable to review the specific contents or supplementary materials provided to ascertain if additional resources or data are available.
14. How can I stay updated on further developments or reports in the Chemiluminescence Reagent?
To stay informed about further developments, trends, and reports in the Chemiluminescence Reagent, consider subscribing to industry newsletters, following relevant companies and organizations, or regularly checking reputable industry news sources and publications.
Methodology
Step 1 - Identification of Relevant Samples Size from Population Database


Step 2 - Approaches for Defining Global Market Size (Value, Volume* & Price*)

Note*: In applicable scenarios
Step 3 - Data Sources
Primary Research
- Web Analytics
- Survey Reports
- Research Institute
- Latest Research Reports
- Opinion Leaders
Secondary Research
- Annual Reports
- White Paper
- Latest Press Release
- Industry Association
- Paid Database
- Investor Presentations

Step 4 - Data Triangulation
Involves using different sources of information in order to increase the validity of a study
These sources are likely to be stakeholders in a program - participants, other researchers, program staff, other community members, and so on.
Then we put all data in single framework & apply various statistical tools to find out the dynamic on the market.
During the analysis stage, feedback from the stakeholder groups would be compared to determine areas of agreement as well as areas of divergence