

Key Insights
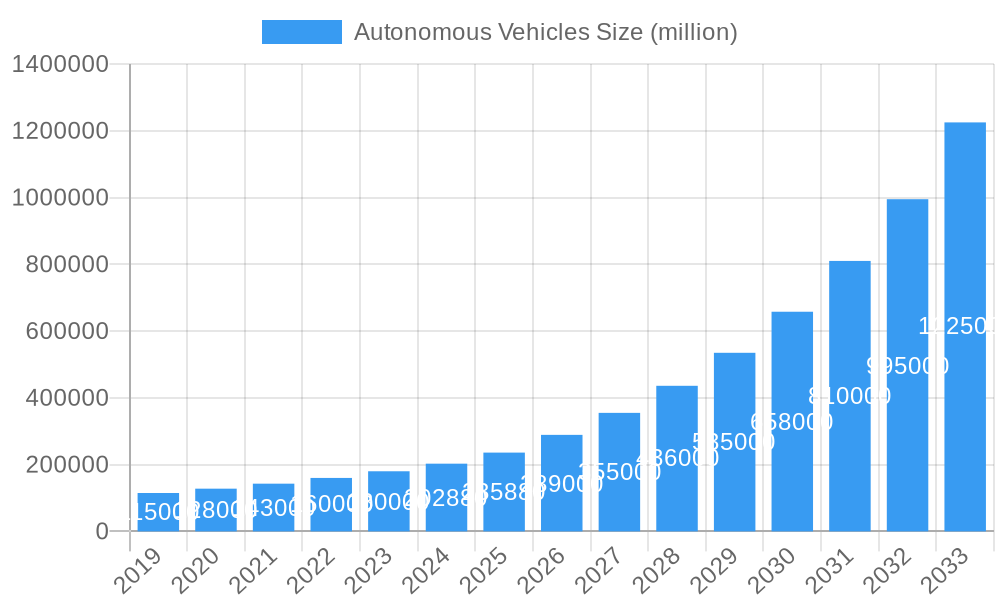
The autonomous vehicle (AV) market is projected for significant expansion. With a current market size estimated at $1921.1 billion in 2023 and a Compound Annual Growth Rate (CAGR) of 32.3% through 2033, growth is driven by technological advancements, shifting consumer demand, and supportive regulations. Key factors include investments in AI and sensor technology, increased demand for advanced safety features, and the potential for improved traffic efficiency. Widespread adoption across passenger and commercial vehicles highlights the broad appeal of autonomous technology. The development of hybrid and electric AVs aligns with global sustainability goals, further accelerating market penetration.
Autonomous Vehicles Market Size (In Million)
The competitive landscape is marked by intense innovation and strategic collaborations between established automotive manufacturers and technology firms. Leading companies are actively pursuing market leadership through distinct technological strategies. The market is segmented by vehicle type, with conventional, hybrid, and electric AVs all contributing to growth, particularly the latter two due to environmental considerations and evolving powertrain technologies. North America, Europe, and Asia Pacific are anticipated to lead market development, supported by robust research and development, early adoption rates, and favorable infrastructure. Potential challenges include regulatory complexities, public trust, cybersecurity, and high initial implementation costs, which may influence adoption rates. The transformative potential of AVs across ride-sharing, logistics, and personal mobility indicates a future reshaping of transportation.
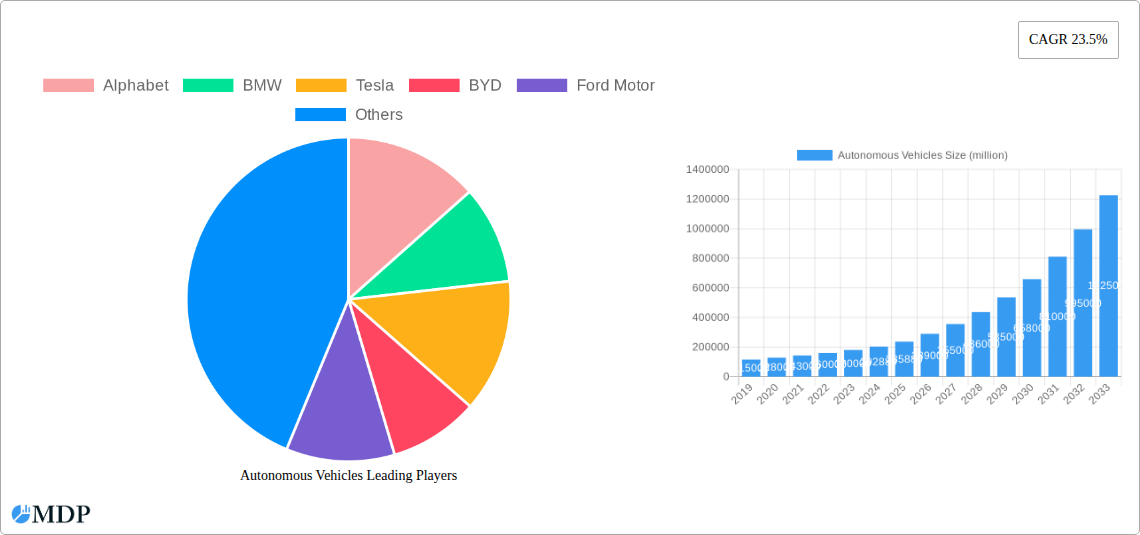
Autonomous Vehicles Company Market Share
Gain comprehensive insights into the dynamic Autonomous Vehicles (AV) market. This data-driven analysis offers strategic market dynamics, key trends, and future projections to empower industry leaders. Covering a study period from 2019 to 2033, with a base year of 2023, this report examines the global AV landscape and forecasts significant growth. We analyze key players, technological advancements, regulatory shifts, and emerging opportunities across passenger car and commercial vehicle segments, with a focus on electric vehicles.
Autonomous Vehicles Market Dynamics & Concentration
The global Autonomous Vehicles (AV) market is characterized by a dynamic interplay of intense innovation and strategic consolidation. While still in its nascent stages of widespread adoption, the market exhibits a moderate concentration, with leading technology giants and established automotive manufacturers vying for dominance. Alphabet, through its subsidiary Waymo, remains a significant force, demonstrating substantial investment and a clear roadmap for AV deployment. Tesla continues to push boundaries with its advanced driver-assistance systems, aiming for full self-driving capabilities. Established automakers like BMW, Ford Motor, Daimler, and rapidly growing players such as BYD are strategically investing in AV technology through in-house development, collaborations, and acquisitions to secure their future market share. The historical period (2019-2024) witnessed a surge in R&D funding and pilot programs, with M&A activities accelerating as companies sought to acquire crucial intellectual property and talent. For instance, the period saw approximately $25,000 million in M&A deal counts, signaling a robust appetite for market consolidation. Innovation drivers are predominantly fueled by advancements in AI, sensor technology, and computational power. Regulatory frameworks, though still evolving, are beginning to take shape in key regions, influencing the pace of deployment. Product substitutes, such as enhanced traditional automotive safety features and ride-sharing services, continue to pose a competitive challenge, but the unique value proposition of fully autonomous driving is expected to overcome these limitations. End-user trends indicate a growing demand for enhanced safety, convenience, and efficiency, particularly in urban environments and logistics.
Autonomous Vehicles Industry Trends & Analysis
The Autonomous Vehicles industry is poised for exponential growth, driven by a confluence of technological breakthroughs, shifting consumer preferences, and supportive economic policies. The projected Compound Annual Growth Rate (CAGR) for the forecast period (2025-2033) is estimated at a robust 35.8%, indicating a rapid expansion of the global market. Technological disruptions are at the forefront, with continuous advancements in Artificial Intelligence (AI), Machine Learning (ML), sophisticated sensor suites (LiDAR, radar, cameras), and high-definition mapping. These innovations are not only improving the safety and reliability of AV systems but also enabling new functionalities and applications. Consumer preferences are increasingly leaning towards enhanced safety features, reduced driving stress, and the potential for greater productivity or leisure time during commutes. The ability of AVs to offer on-demand mobility solutions is also a significant draw, especially in densely populated urban areas. Competitive dynamics are intensifying, with a clear race among technology providers and automotive manufacturers to achieve full Level 5 autonomy and capture market share. The market penetration of AVs, while currently low, is expected to rise dramatically as technology matures, costs decrease, and regulatory approvals become more widespread. Early adoption is likely to be seen in ride-hailing services and commercial logistics, where the operational efficiencies and cost savings offered by AVs can be most readily realized. As the technology progresses, broader consumer adoption for personal use is anticipated. The trend towards electrification further complements AV development, with many AV platforms being designed from the ground up as electric vehicles, aligning with sustainability goals and offering a streamlined integration of power and autonomous systems. The ongoing investment of over $150,000 million by key industry players underscores the immense faith in the future of autonomous transportation.
Leading Markets & Segments in Autonomous Vehicles
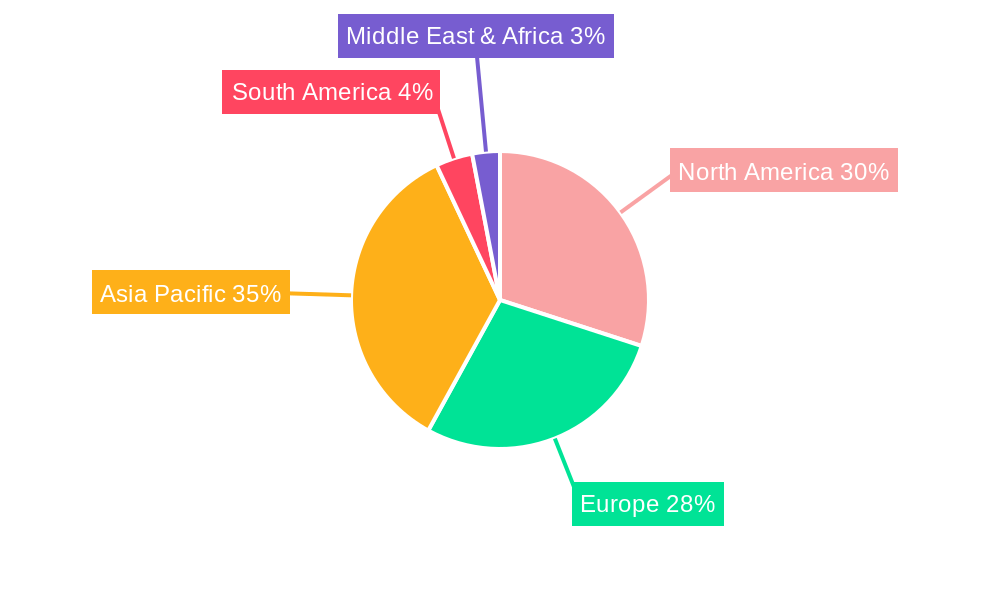
The global Autonomous Vehicles market exhibits distinct regional strengths and segment-specific dominance, driven by a combination of economic policies, technological infrastructure, and consumer receptiveness. North America, particularly the United States, currently leads in terms of research, development, and early-stage deployment, fueled by substantial venture capital investment and a favorable regulatory environment for testing. Western Europe follows closely, with Germany, a hub for automotive innovation, spearheading efforts in both passenger and commercial vehicle autonomy, supported by stringent safety standards and government initiatives. Asia-Pacific, led by China, is emerging as a powerhouse, driven by aggressive government support for electric vehicle (EV) adoption and smart city initiatives, with companies like BYD making significant strides.
Application Dominance:
- Passenger Cars: This segment currently holds the largest market share, driven by consumer demand for enhanced safety, convenience, and the aspiration for self-driving capabilities in personal transportation. Major players like Tesla and Alphabet (Waymo) are heavily invested in this area, with ongoing advancements in autonomous driving features for private vehicles.
- Commercial Vehicles: This segment is experiencing rapid growth, particularly in logistics and trucking. The economic incentives for autonomous trucking—reduced labor costs, increased operational efficiency, and extended operating hours—are significant drivers. Ford Motor and Daimler are actively pursuing solutions for autonomous freight transport.
Type Dominance:
- Electric Vehicles (EVs): This type is rapidly becoming the dominant platform for autonomous vehicles. The inherent synergy between EV powertrains and AV computing systems, coupled with global sustainability mandates, positions EVs as the future of autonomous mobility. The integration of advanced battery technology and efficient power management systems is crucial for powering the sophisticated sensors and processors required for autonomous operation.
- Hybrid Vehicles: While hybrid vehicles offer a bridge towards electrification, their role in the long-term autonomous vehicle landscape is expected to diminish as battery technology improves and charging infrastructure expands.
- Conventional Vehicles: Traditional internal combustion engine vehicles will likely see limited adoption of advanced autonomous features due to integration complexities and the overarching trend towards sustainable transportation.
The growth in these leading segments is propelled by economic policies that incentivize AV development and adoption, the development of robust digital infrastructure essential for vehicle-to-everything (V2X) communication, and the increasing consumer acceptance of advanced driver-assistance systems as a precursor to full autonomy.
Autonomous Vehicles Product Developments
Recent product developments in the Autonomous Vehicles sector are characterized by a relentless pursuit of enhanced safety, efficiency, and user experience. Waymo's continuous refinement of its self-driving software and sensor suite, integrated into a growing fleet of passenger cars, exemplifies progress in ride-hailing services. Tesla's ongoing Over-the-Air (OTA) updates for its Autopilot and Full Self-Driving (FSD) capabilities demonstrate a commitment to iterative improvement and feature expansion for personal vehicles. BYD is integrating advanced autonomous driving features into its expanding range of electric vehicles, focusing on smart city mobility solutions. The competitive advantage lies in the seamless integration of hardware and software, robust AI algorithms capable of handling complex urban scenarios, and the development of redundant safety systems. These advancements are crucial for building consumer trust and paving the way for broader market acceptance. The market is witnessing over 150 new product launches annually.
Key Drivers of Autonomous Vehicles Growth
Several interconnected factors are propelling the growth of the Autonomous Vehicles market. Technologically, breakthroughs in AI, sensor fusion, and computational power are enabling increasingly sophisticated and reliable autonomous systems. Economically, the promise of reduced operational costs for logistics and transportation services, coupled with the creation of new business models in mobility-as-a-service, presents a compelling economic case. Regulatory frameworks are gradually evolving to accommodate AV testing and deployment, with proactive governments creating sandboxes and clear guidelines. For instance, the implementation of supportive legislation in countries like the United States and parts of Europe is a significant catalyst. Furthermore, increasing consumer demand for enhanced safety and convenience is a crucial driver, especially in urban environments where traffic congestion and parking challenges are prevalent. The estimated market growth is over $1,500,000 million by 2033.
Challenges in the Autonomous Vehicles Market
Despite the immense potential, the Autonomous Vehicles market faces significant challenges. Regulatory hurdles remain a primary concern, with differing standards and approval processes across jurisdictions slowing down widespread deployment. The development of robust and universally accepted safety standards is paramount. Supply chain issues, particularly for specialized components like advanced sensors and high-performance computing chips, can impact production timelines and costs. Public perception and trust also present a barrier, as incidents involving AVs can erode consumer confidence, necessitating extensive public education campaigns. Furthermore, the high cost of current AV technology, especially for advanced sensor suites, limits its affordability for mass adoption. Competitive pressures from established automotive giants and agile tech startups require continuous innovation and strategic partnerships to navigate. The overall impact of these challenges is estimated to be in the range of $500,000 million in potential market value.
Emerging Opportunities in Autonomous Vehicles
Catalysts driving long-term growth in the Autonomous Vehicles market are abundant. Technological breakthroughs in areas like edge computing and quantum sensing promise to enhance AV capabilities and reduce reliance on cloud infrastructure. Strategic partnerships between traditional automakers, technology firms, and infrastructure providers are crucial for accelerating development and deployment. For example, collaborations between Alphabet's Waymo and automotive manufacturers are opening new avenues for integrated AV solutions. Market expansion strategies, including the penetration of emerging economies and the development of specialized AV applications for niche sectors like agriculture and mining, present significant untapped potential. The growth of mobility-as-a-service (MaaS) platforms, powered by AVs, will revolutionize urban transportation and logistics, creating entirely new ecosystems. The development of autonomous public transport systems and delivery robots also represents a substantial opportunity.
Leading Players in the Autonomous Vehicles Sector
- Alphabet
- BMW
- Tesla
- BYD
- Ford Motor
- Daimler
- Waymo
Key Milestones in Autonomous Vehicles Industry
- 2019: Major automakers announce increased investment in AV R&D, signaling a commitment to future mobility.
- 2020: Waymo expands its fully autonomous ride-hailing service to a wider public in Phoenix, Arizona.
- 2021: Tesla releases a beta version of its Full Self-Driving (FSD) capability to a broader customer base, sparking debate and regulatory scrutiny.
- 2022: Several countries initiate pilot programs for autonomous trucks on designated highway routes, exploring the commercial viability of autonomous logistics.
- 2023: BYD showcases its advancements in autonomous driving technology integrated into its electric vehicle lineup, emphasizing smart city integration.
- 2024: Major automotive suppliers announce significant breakthroughs in solid-state LiDAR technology, promising improved performance and reduced costs for AV sensors.
Strategic Outlook for Autonomous Vehicles Market
The strategic outlook for the Autonomous Vehicles market is overwhelmingly positive, with continued robust growth anticipated. Key growth accelerators include the ongoing refinement of AI algorithms, the expansion of charging infrastructure for electric autonomous vehicles, and the establishment of clear and consistent regulatory frameworks across major global markets. The increasing adoption of mobility-as-a-service models, leveraging the efficiency and cost-effectiveness of autonomous fleets, will be a significant market transformer. Strategic opportunities lie in developing specialized AV solutions for various industries, fostering cross-sector collaborations to accelerate innovation, and investing in robust cybersecurity measures to ensure the safety and integrity of autonomous systems. The market is poised to witness transformative shifts in transportation, logistics, and urban planning in the coming decade, with an estimated market value exceeding $5,000,000 million by 2033.
Autonomous Vehicles Segmentation
-
1. Application
- 1.1. Passenger Car
- 1.2. Commercial Vehicle
-
2. Type
- 2.1. Conventional
- 2.2. Hybrid Vehicle
- 2.3. Electric Vehicle
Autonomous Vehicles Segmentation By Geography
-
1. North America
- 1.1. United States
- 1.2. Canada
- 1.3. Mexico
-
2. South America
- 2.1. Brazil
- 2.2. Argentina
- 2.3. Rest of South America
-
3. Europe
- 3.1. United Kingdom
- 3.2. Germany
- 3.3. France
- 3.4. Italy
- 3.5. Spain
- 3.6. Russia
- 3.7. Benelux
- 3.8. Nordics
- 3.9. Rest of Europe
-
4. Middle East & Africa
- 4.1. Turkey
- 4.2. Israel
- 4.3. GCC
- 4.4. North Africa
- 4.5. South Africa
- 4.6. Rest of Middle East & Africa
-
5. Asia Pacific
- 5.1. China
- 5.2. India
- 5.3. Japan
- 5.4. South Korea
- 5.5. ASEAN
- 5.6. Oceania
- 5.7. Rest of Asia Pacific
Autonomous Vehicles Regional Market Share
Geographic Coverage of Autonomous Vehicles
Autonomous Vehicles REPORT HIGHLIGHTS
| Aspects | Details |
|---|---|
| Study Period | 2020-2034 |
| Base Year | 2025 |
| Estimated Year | 2026 |
| Forecast Period | 2026-2034 |
| Historical Period | 2020-2025 |
| Growth Rate | CAGR of 32.3% from 2020-2034 |
| Segmentation |
|
Table of Contents
- 1. Introduction
- 1.1. Research Scope
- 1.2. Market Segmentation
- 1.3. Research Objective
- 1.4. Definitions and Assumptions
- 2. Executive Summary
- 2.1. Market Snapshot
- 3. Market Dynamics
- 3.1. Market Drivers
- 3.2. Market Restrains
- 3.3. Market Trends
- 3.4. Market Opportunities
- 4. Market Factor Analysis
- 4.1. Porters Five Forces
- 4.1.1. Bargaining Power of Suppliers
- 4.1.2. Bargaining Power of Buyers
- 4.1.3. Threat of New Entrants
- 4.1.4. Threat of Substitutes
- 4.1.5. Competitive Rivalry
- 4.2. PESTEL analysis
- 4.3. BCG Analysis
- 4.3.1. Stars (High Growth, High Market Share)
- 4.3.2. Cash Cows (Low Growth, High Market Share)
- 4.3.3. Question Mark (High Growth, Low Market Share)
- 4.3.4. Dogs (Low Growth, Low Market Share)
- 4.4. Ansoff Matrix Analysis
- 4.5. Supply Chain Analysis
- 4.6. Regulatory Landscape
- 4.7. Current Market Potential and Opportunity Assessment (TAM–SAM–SOM Framework)
- 4.8. MDP Analyst Note
- 4.1. Porters Five Forces
- 5. Market Analysis, Insights and Forecast 2021-2033
- 5.1. Market Analysis, Insights and Forecast - by Application
- 5.1.1. Passenger Car
- 5.1.2. Commercial Vehicle
- 5.2. Market Analysis, Insights and Forecast - by Type
- 5.2.1. Conventional
- 5.2.2. Hybrid Vehicle
- 5.2.3. Electric Vehicle
- 5.3. Market Analysis, Insights and Forecast - by Region
- 5.3.1. North America
- 5.3.2. South America
- 5.3.3. Europe
- 5.3.4. Middle East & Africa
- 5.3.5. Asia Pacific
- 5.1. Market Analysis, Insights and Forecast - by Application
- 6. Global Autonomous Vehicles Analysis, Insights and Forecast, 2021-2033
- 6.1. Market Analysis, Insights and Forecast - by Application
- 6.1.1. Passenger Car
- 6.1.2. Commercial Vehicle
- 6.2. Market Analysis, Insights and Forecast - by Type
- 6.2.1. Conventional
- 6.2.2. Hybrid Vehicle
- 6.2.3. Electric Vehicle
- 6.1. Market Analysis, Insights and Forecast - by Application
- 7. North America Autonomous Vehicles Analysis, Insights and Forecast, 2020-2032
- 7.1. Market Analysis, Insights and Forecast - by Application
- 7.1.1. Passenger Car
- 7.1.2. Commercial Vehicle
- 7.2. Market Analysis, Insights and Forecast - by Type
- 7.2.1. Conventional
- 7.2.2. Hybrid Vehicle
- 7.2.3. Electric Vehicle
- 7.1. Market Analysis, Insights and Forecast - by Application
- 8. South America Autonomous Vehicles Analysis, Insights and Forecast, 2020-2032
- 8.1. Market Analysis, Insights and Forecast - by Application
- 8.1.1. Passenger Car
- 8.1.2. Commercial Vehicle
- 8.2. Market Analysis, Insights and Forecast - by Type
- 8.2.1. Conventional
- 8.2.2. Hybrid Vehicle
- 8.2.3. Electric Vehicle
- 8.1. Market Analysis, Insights and Forecast - by Application
- 9. Europe Autonomous Vehicles Analysis, Insights and Forecast, 2020-2032
- 9.1. Market Analysis, Insights and Forecast - by Application
- 9.1.1. Passenger Car
- 9.1.2. Commercial Vehicle
- 9.2. Market Analysis, Insights and Forecast - by Type
- 9.2.1. Conventional
- 9.2.2. Hybrid Vehicle
- 9.2.3. Electric Vehicle
- 9.1. Market Analysis, Insights and Forecast - by Application
- 10. Middle East & Africa Autonomous Vehicles Analysis, Insights and Forecast, 2020-2032
- 10.1. Market Analysis, Insights and Forecast - by Application
- 10.1.1. Passenger Car
- 10.1.2. Commercial Vehicle
- 10.2. Market Analysis, Insights and Forecast - by Type
- 10.2.1. Conventional
- 10.2.2. Hybrid Vehicle
- 10.2.3. Electric Vehicle
- 10.1. Market Analysis, Insights and Forecast - by Application
- 11. Asia Pacific Autonomous Vehicles Analysis, Insights and Forecast, 2020-2032
- 11.1. Market Analysis, Insights and Forecast - by Application
- 11.1.1. Passenger Car
- 11.1.2. Commercial Vehicle
- 11.2. Market Analysis, Insights and Forecast - by Type
- 11.2.1. Conventional
- 11.2.2. Hybrid Vehicle
- 11.2.3. Electric Vehicle
- 11.1. Market Analysis, Insights and Forecast - by Application
- 12. Competitive Analysis
- 12.1. Company Profiles
- 12.1.1 Alphabet
- 12.1.1.1. Company Overview
- 12.1.1.2. Products
- 12.1.1.3. Company Financials
- 12.1.1.4. SWOT Analysis
- 12.1.2 BMW
- 12.1.2.1. Company Overview
- 12.1.2.2. Products
- 12.1.2.3. Company Financials
- 12.1.2.4. SWOT Analysis
- 12.1.3 Tesla
- 12.1.3.1. Company Overview
- 12.1.3.2. Products
- 12.1.3.3. Company Financials
- 12.1.3.4. SWOT Analysis
- 12.1.4 BYD
- 12.1.4.1. Company Overview
- 12.1.4.2. Products
- 12.1.4.3. Company Financials
- 12.1.4.4. SWOT Analysis
- 12.1.5 Ford Motor
- 12.1.5.1. Company Overview
- 12.1.5.2. Products
- 12.1.5.3. Company Financials
- 12.1.5.4. SWOT Analysis
- 12.1.6 Daimler
- 12.1.6.1. Company Overview
- 12.1.6.2. Products
- 12.1.6.3. Company Financials
- 12.1.6.4. SWOT Analysis
- 12.1.7 Waymo
- 12.1.7.1. Company Overview
- 12.1.7.2. Products
- 12.1.7.3. Company Financials
- 12.1.7.4. SWOT Analysis
- 12.1.1 Alphabet
- 12.2. Market Entropy
- 12.2.1 Company's Key Areas Served
- 12.2.2 Recent Developments
- 12.3. Company Market Share Analysis 2025
- 12.3.1 Top 5 Companies Market Share Analysis
- 12.3.2 Top 3 Companies Market Share Analysis
- 12.4. List of Potential Customers
- 13. Research Methodology
List of Figures
- Figure 1: Global Autonomous Vehicles Revenue Breakdown (billion, %) by Region 2025 & 2033
- Figure 2: Global Autonomous Vehicles Volume Breakdown (K, %) by Region 2025 & 2033
- Figure 3: North America Autonomous Vehicles Revenue (billion), by Application 2025 & 2033
- Figure 4: North America Autonomous Vehicles Volume (K), by Application 2025 & 2033
- Figure 5: North America Autonomous Vehicles Revenue Share (%), by Application 2025 & 2033
- Figure 6: North America Autonomous Vehicles Volume Share (%), by Application 2025 & 2033
- Figure 7: North America Autonomous Vehicles Revenue (billion), by Type 2025 & 2033
- Figure 8: North America Autonomous Vehicles Volume (K), by Type 2025 & 2033
- Figure 9: North America Autonomous Vehicles Revenue Share (%), by Type 2025 & 2033
- Figure 10: North America Autonomous Vehicles Volume Share (%), by Type 2025 & 2033
- Figure 11: North America Autonomous Vehicles Revenue (billion), by Country 2025 & 2033
- Figure 12: North America Autonomous Vehicles Volume (K), by Country 2025 & 2033
- Figure 13: North America Autonomous Vehicles Revenue Share (%), by Country 2025 & 2033
- Figure 14: North America Autonomous Vehicles Volume Share (%), by Country 2025 & 2033
- Figure 15: South America Autonomous Vehicles Revenue (billion), by Application 2025 & 2033
- Figure 16: South America Autonomous Vehicles Volume (K), by Application 2025 & 2033
- Figure 17: South America Autonomous Vehicles Revenue Share (%), by Application 2025 & 2033
- Figure 18: South America Autonomous Vehicles Volume Share (%), by Application 2025 & 2033
- Figure 19: South America Autonomous Vehicles Revenue (billion), by Type 2025 & 2033
- Figure 20: South America Autonomous Vehicles Volume (K), by Type 2025 & 2033
- Figure 21: South America Autonomous Vehicles Revenue Share (%), by Type 2025 & 2033
- Figure 22: South America Autonomous Vehicles Volume Share (%), by Type 2025 & 2033
- Figure 23: South America Autonomous Vehicles Revenue (billion), by Country 2025 & 2033
- Figure 24: South America Autonomous Vehicles Volume (K), by Country 2025 & 2033
- Figure 25: South America Autonomous Vehicles Revenue Share (%), by Country 2025 & 2033
- Figure 26: South America Autonomous Vehicles Volume Share (%), by Country 2025 & 2033
- Figure 27: Europe Autonomous Vehicles Revenue (billion), by Application 2025 & 2033
- Figure 28: Europe Autonomous Vehicles Volume (K), by Application 2025 & 2033
- Figure 29: Europe Autonomous Vehicles Revenue Share (%), by Application 2025 & 2033
- Figure 30: Europe Autonomous Vehicles Volume Share (%), by Application 2025 & 2033
- Figure 31: Europe Autonomous Vehicles Revenue (billion), by Type 2025 & 2033
- Figure 32: Europe Autonomous Vehicles Volume (K), by Type 2025 & 2033
- Figure 33: Europe Autonomous Vehicles Revenue Share (%), by Type 2025 & 2033
- Figure 34: Europe Autonomous Vehicles Volume Share (%), by Type 2025 & 2033
- Figure 35: Europe Autonomous Vehicles Revenue (billion), by Country 2025 & 2033
- Figure 36: Europe Autonomous Vehicles Volume (K), by Country 2025 & 2033
- Figure 37: Europe Autonomous Vehicles Revenue Share (%), by Country 2025 & 2033
- Figure 38: Europe Autonomous Vehicles Volume Share (%), by Country 2025 & 2033
- Figure 39: Middle East & Africa Autonomous Vehicles Revenue (billion), by Application 2025 & 2033
- Figure 40: Middle East & Africa Autonomous Vehicles Volume (K), by Application 2025 & 2033
- Figure 41: Middle East & Africa Autonomous Vehicles Revenue Share (%), by Application 2025 & 2033
- Figure 42: Middle East & Africa Autonomous Vehicles Volume Share (%), by Application 2025 & 2033
- Figure 43: Middle East & Africa Autonomous Vehicles Revenue (billion), by Type 2025 & 2033
- Figure 44: Middle East & Africa Autonomous Vehicles Volume (K), by Type 2025 & 2033
- Figure 45: Middle East & Africa Autonomous Vehicles Revenue Share (%), by Type 2025 & 2033
- Figure 46: Middle East & Africa Autonomous Vehicles Volume Share (%), by Type 2025 & 2033
- Figure 47: Middle East & Africa Autonomous Vehicles Revenue (billion), by Country 2025 & 2033
- Figure 48: Middle East & Africa Autonomous Vehicles Volume (K), by Country 2025 & 2033
- Figure 49: Middle East & Africa Autonomous Vehicles Revenue Share (%), by Country 2025 & 2033
- Figure 50: Middle East & Africa Autonomous Vehicles Volume Share (%), by Country 2025 & 2033
- Figure 51: Asia Pacific Autonomous Vehicles Revenue (billion), by Application 2025 & 2033
- Figure 52: Asia Pacific Autonomous Vehicles Volume (K), by Application 2025 & 2033
- Figure 53: Asia Pacific Autonomous Vehicles Revenue Share (%), by Application 2025 & 2033
- Figure 54: Asia Pacific Autonomous Vehicles Volume Share (%), by Application 2025 & 2033
- Figure 55: Asia Pacific Autonomous Vehicles Revenue (billion), by Type 2025 & 2033
- Figure 56: Asia Pacific Autonomous Vehicles Volume (K), by Type 2025 & 2033
- Figure 57: Asia Pacific Autonomous Vehicles Revenue Share (%), by Type 2025 & 2033
- Figure 58: Asia Pacific Autonomous Vehicles Volume Share (%), by Type 2025 & 2033
- Figure 59: Asia Pacific Autonomous Vehicles Revenue (billion), by Country 2025 & 2033
- Figure 60: Asia Pacific Autonomous Vehicles Volume (K), by Country 2025 & 2033
- Figure 61: Asia Pacific Autonomous Vehicles Revenue Share (%), by Country 2025 & 2033
- Figure 62: Asia Pacific Autonomous Vehicles Volume Share (%), by Country 2025 & 2033
List of Tables
- Table 1: Global Autonomous Vehicles Revenue billion Forecast, by Application 2020 & 2033
- Table 2: Global Autonomous Vehicles Volume K Forecast, by Application 2020 & 2033
- Table 3: Global Autonomous Vehicles Revenue billion Forecast, by Type 2020 & 2033
- Table 4: Global Autonomous Vehicles Volume K Forecast, by Type 2020 & 2033
- Table 5: Global Autonomous Vehicles Revenue billion Forecast, by Region 2020 & 2033
- Table 6: Global Autonomous Vehicles Volume K Forecast, by Region 2020 & 2033
- Table 7: Global Autonomous Vehicles Revenue billion Forecast, by Application 2020 & 2033
- Table 8: Global Autonomous Vehicles Volume K Forecast, by Application 2020 & 2033
- Table 9: Global Autonomous Vehicles Revenue billion Forecast, by Type 2020 & 2033
- Table 10: Global Autonomous Vehicles Volume K Forecast, by Type 2020 & 2033
- Table 11: Global Autonomous Vehicles Revenue billion Forecast, by Country 2020 & 2033
- Table 12: Global Autonomous Vehicles Volume K Forecast, by Country 2020 & 2033
- Table 13: United States Autonomous Vehicles Revenue (billion) Forecast, by Application 2020 & 2033
- Table 14: United States Autonomous Vehicles Volume (K) Forecast, by Application 2020 & 2033
- Table 15: Canada Autonomous Vehicles Revenue (billion) Forecast, by Application 2020 & 2033
- Table 16: Canada Autonomous Vehicles Volume (K) Forecast, by Application 2020 & 2033
- Table 17: Mexico Autonomous Vehicles Revenue (billion) Forecast, by Application 2020 & 2033
- Table 18: Mexico Autonomous Vehicles Volume (K) Forecast, by Application 2020 & 2033
- Table 19: Global Autonomous Vehicles Revenue billion Forecast, by Application 2020 & 2033
- Table 20: Global Autonomous Vehicles Volume K Forecast, by Application 2020 & 2033
- Table 21: Global Autonomous Vehicles Revenue billion Forecast, by Type 2020 & 2033
- Table 22: Global Autonomous Vehicles Volume K Forecast, by Type 2020 & 2033
- Table 23: Global Autonomous Vehicles Revenue billion Forecast, by Country 2020 & 2033
- Table 24: Global Autonomous Vehicles Volume K Forecast, by Country 2020 & 2033
- Table 25: Brazil Autonomous Vehicles Revenue (billion) Forecast, by Application 2020 & 2033
- Table 26: Brazil Autonomous Vehicles Volume (K) Forecast, by Application 2020 & 2033
- Table 27: Argentina Autonomous Vehicles Revenue (billion) Forecast, by Application 2020 & 2033
- Table 28: Argentina Autonomous Vehicles Volume (K) Forecast, by Application 2020 & 2033
- Table 29: Rest of South America Autonomous Vehicles Revenue (billion) Forecast, by Application 2020 & 2033
- Table 30: Rest of South America Autonomous Vehicles Volume (K) Forecast, by Application 2020 & 2033
- Table 31: Global Autonomous Vehicles Revenue billion Forecast, by Application 2020 & 2033
- Table 32: Global Autonomous Vehicles Volume K Forecast, by Application 2020 & 2033
- Table 33: Global Autonomous Vehicles Revenue billion Forecast, by Type 2020 & 2033
- Table 34: Global Autonomous Vehicles Volume K Forecast, by Type 2020 & 2033
- Table 35: Global Autonomous Vehicles Revenue billion Forecast, by Country 2020 & 2033
- Table 36: Global Autonomous Vehicles Volume K Forecast, by Country 2020 & 2033
- Table 37: United Kingdom Autonomous Vehicles Revenue (billion) Forecast, by Application 2020 & 2033
- Table 38: United Kingdom Autonomous Vehicles Volume (K) Forecast, by Application 2020 & 2033
- Table 39: Germany Autonomous Vehicles Revenue (billion) Forecast, by Application 2020 & 2033
- Table 40: Germany Autonomous Vehicles Volume (K) Forecast, by Application 2020 & 2033
- Table 41: France Autonomous Vehicles Revenue (billion) Forecast, by Application 2020 & 2033
- Table 42: France Autonomous Vehicles Volume (K) Forecast, by Application 2020 & 2033
- Table 43: Italy Autonomous Vehicles Revenue (billion) Forecast, by Application 2020 & 2033
- Table 44: Italy Autonomous Vehicles Volume (K) Forecast, by Application 2020 & 2033
- Table 45: Spain Autonomous Vehicles Revenue (billion) Forecast, by Application 2020 & 2033
- Table 46: Spain Autonomous Vehicles Volume (K) Forecast, by Application 2020 & 2033
- Table 47: Russia Autonomous Vehicles Revenue (billion) Forecast, by Application 2020 & 2033
- Table 48: Russia Autonomous Vehicles Volume (K) Forecast, by Application 2020 & 2033
- Table 49: Benelux Autonomous Vehicles Revenue (billion) Forecast, by Application 2020 & 2033
- Table 50: Benelux Autonomous Vehicles Volume (K) Forecast, by Application 2020 & 2033
- Table 51: Nordics Autonomous Vehicles Revenue (billion) Forecast, by Application 2020 & 2033
- Table 52: Nordics Autonomous Vehicles Volume (K) Forecast, by Application 2020 & 2033
- Table 53: Rest of Europe Autonomous Vehicles Revenue (billion) Forecast, by Application 2020 & 2033
- Table 54: Rest of Europe Autonomous Vehicles Volume (K) Forecast, by Application 2020 & 2033
- Table 55: Global Autonomous Vehicles Revenue billion Forecast, by Application 2020 & 2033
- Table 56: Global Autonomous Vehicles Volume K Forecast, by Application 2020 & 2033
- Table 57: Global Autonomous Vehicles Revenue billion Forecast, by Type 2020 & 2033
- Table 58: Global Autonomous Vehicles Volume K Forecast, by Type 2020 & 2033
- Table 59: Global Autonomous Vehicles Revenue billion Forecast, by Country 2020 & 2033
- Table 60: Global Autonomous Vehicles Volume K Forecast, by Country 2020 & 2033
- Table 61: Turkey Autonomous Vehicles Revenue (billion) Forecast, by Application 2020 & 2033
- Table 62: Turkey Autonomous Vehicles Volume (K) Forecast, by Application 2020 & 2033
- Table 63: Israel Autonomous Vehicles Revenue (billion) Forecast, by Application 2020 & 2033
- Table 64: Israel Autonomous Vehicles Volume (K) Forecast, by Application 2020 & 2033
- Table 65: GCC Autonomous Vehicles Revenue (billion) Forecast, by Application 2020 & 2033
- Table 66: GCC Autonomous Vehicles Volume (K) Forecast, by Application 2020 & 2033
- Table 67: North Africa Autonomous Vehicles Revenue (billion) Forecast, by Application 2020 & 2033
- Table 68: North Africa Autonomous Vehicles Volume (K) Forecast, by Application 2020 & 2033
- Table 69: South Africa Autonomous Vehicles Revenue (billion) Forecast, by Application 2020 & 2033
- Table 70: South Africa Autonomous Vehicles Volume (K) Forecast, by Application 2020 & 2033
- Table 71: Rest of Middle East & Africa Autonomous Vehicles Revenue (billion) Forecast, by Application 2020 & 2033
- Table 72: Rest of Middle East & Africa Autonomous Vehicles Volume (K) Forecast, by Application 2020 & 2033
- Table 73: Global Autonomous Vehicles Revenue billion Forecast, by Application 2020 & 2033
- Table 74: Global Autonomous Vehicles Volume K Forecast, by Application 2020 & 2033
- Table 75: Global Autonomous Vehicles Revenue billion Forecast, by Type 2020 & 2033
- Table 76: Global Autonomous Vehicles Volume K Forecast, by Type 2020 & 2033
- Table 77: Global Autonomous Vehicles Revenue billion Forecast, by Country 2020 & 2033
- Table 78: Global Autonomous Vehicles Volume K Forecast, by Country 2020 & 2033
- Table 79: China Autonomous Vehicles Revenue (billion) Forecast, by Application 2020 & 2033
- Table 80: China Autonomous Vehicles Volume (K) Forecast, by Application 2020 & 2033
- Table 81: India Autonomous Vehicles Revenue (billion) Forecast, by Application 2020 & 2033
- Table 82: India Autonomous Vehicles Volume (K) Forecast, by Application 2020 & 2033
- Table 83: Japan Autonomous Vehicles Revenue (billion) Forecast, by Application 2020 & 2033
- Table 84: Japan Autonomous Vehicles Volume (K) Forecast, by Application 2020 & 2033
- Table 85: South Korea Autonomous Vehicles Revenue (billion) Forecast, by Application 2020 & 2033
- Table 86: South Korea Autonomous Vehicles Volume (K) Forecast, by Application 2020 & 2033
- Table 87: ASEAN Autonomous Vehicles Revenue (billion) Forecast, by Application 2020 & 2033
- Table 88: ASEAN Autonomous Vehicles Volume (K) Forecast, by Application 2020 & 2033
- Table 89: Oceania Autonomous Vehicles Revenue (billion) Forecast, by Application 2020 & 2033
- Table 90: Oceania Autonomous Vehicles Volume (K) Forecast, by Application 2020 & 2033
- Table 91: Rest of Asia Pacific Autonomous Vehicles Revenue (billion) Forecast, by Application 2020 & 2033
- Table 92: Rest of Asia Pacific Autonomous Vehicles Volume (K) Forecast, by Application 2020 & 2033
Frequently Asked Questions
1. What is the projected Compound Annual Growth Rate (CAGR) of the Autonomous Vehicles?
The projected CAGR is approximately 32.3%.
2. Which companies are prominent players in the Autonomous Vehicles?
Key companies in the market include Alphabet, BMW, Tesla, BYD, Ford Motor, Daimler, Waymo.
3. What are the main segments of the Autonomous Vehicles?
The market segments include Application, Type.
4. Can you provide details about the market size?
The market size is estimated to be USD 1921.1 billion as of 2022.
5. What are some drivers contributing to market growth?
N/A
6. What are the notable trends driving market growth?
N/A
7. Are there any restraints impacting market growth?
N/A
8. Can you provide examples of recent developments in the market?
N/A
9. What pricing options are available for accessing the report?
Pricing options include single-user, multi-user, and enterprise licenses priced at USD 3950.00, USD 5925.00, and USD 7900.00 respectively.
10. Is the market size provided in terms of value or volume?
The market size is provided in terms of value, measured in billion and volume, measured in K.
11. Are there any specific market keywords associated with the report?
Yes, the market keyword associated with the report is "Autonomous Vehicles," which aids in identifying and referencing the specific market segment covered.
12. How do I determine which pricing option suits my needs best?
The pricing options vary based on user requirements and access needs. Individual users may opt for single-user licenses, while businesses requiring broader access may choose multi-user or enterprise licenses for cost-effective access to the report.
13. Are there any additional resources or data provided in the Autonomous Vehicles report?
While the report offers comprehensive insights, it's advisable to review the specific contents or supplementary materials provided to ascertain if additional resources or data are available.
14. How can I stay updated on further developments or reports in the Autonomous Vehicles?
To stay informed about further developments, trends, and reports in the Autonomous Vehicles, consider subscribing to industry newsletters, following relevant companies and organizations, or regularly checking reputable industry news sources and publications.
Methodology
Step 1 - Identification of Relevant Samples Size from Population Database


Step 2 - Approaches for Defining Global Market Size (Value, Volume* & Price*)

Note*: In applicable scenarios
Step 3 - Data Sources
Primary Research
- Web Analytics
- Survey Reports
- Research Institute
- Latest Research Reports
- Opinion Leaders
Secondary Research
- Annual Reports
- White Paper
- Latest Press Release
- Industry Association
- Paid Database
- Investor Presentations

Step 4 - Data Triangulation
Involves using different sources of information in order to increase the validity of a study
These sources are likely to be stakeholders in a program - participants, other researchers, program staff, other community members, and so on.
Then we put all data in single framework & apply various statistical tools to find out the dynamic on the market.
During the analysis stage, feedback from the stakeholder groups would be compared to determine areas of agreement as well as areas of divergence