

Key Insights
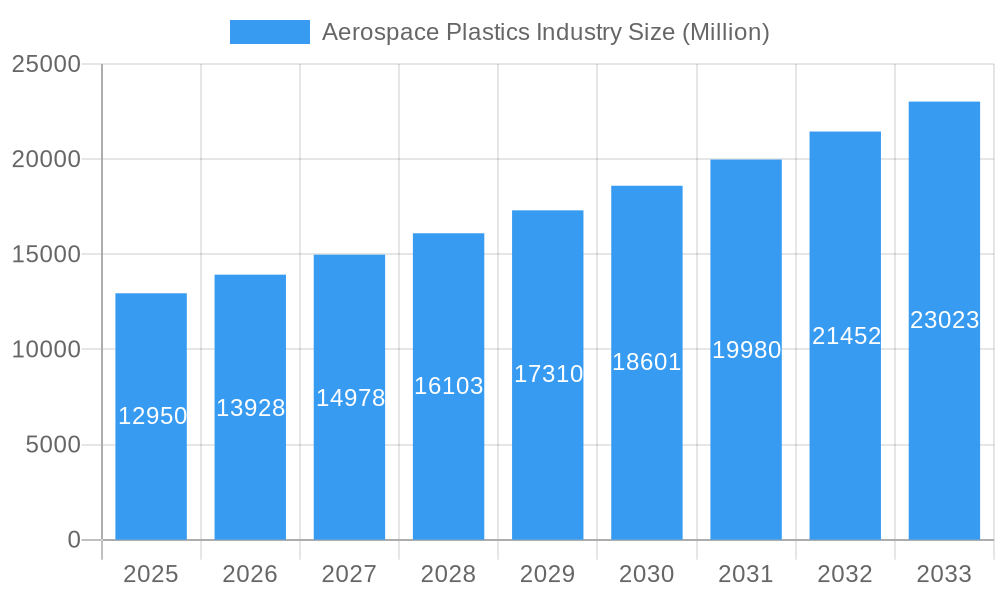
The aerospace plastics market, valued at $12.95 billion in 2025, is projected to experience robust growth, driven by the increasing demand for lightweight yet high-strength materials in aircraft manufacturing and space exploration. This growth is fueled by several key factors. The rising adoption of composite materials in aerostructures, cabin interiors, and propulsion systems significantly reduces aircraft weight, leading to improved fuel efficiency and reduced emissions – a crucial factor in the industry’s push for sustainability. Furthermore, the burgeoning space industry, with its focus on reusable rockets and advanced satellite technologies, is creating a substantial demand for specialized plastics capable of withstanding extreme conditions. Innovation in material science is also a key driver; advancements in polymer technology are constantly leading to the development of plastics with enhanced performance characteristics, including improved thermal stability, durability, and resistance to chemicals and extreme temperatures. While high initial investment costs for advanced composite manufacturing could be considered a restraint, the long-term benefits in terms of fuel savings and operational efficiency are compelling enough to outweigh this concern for many players.
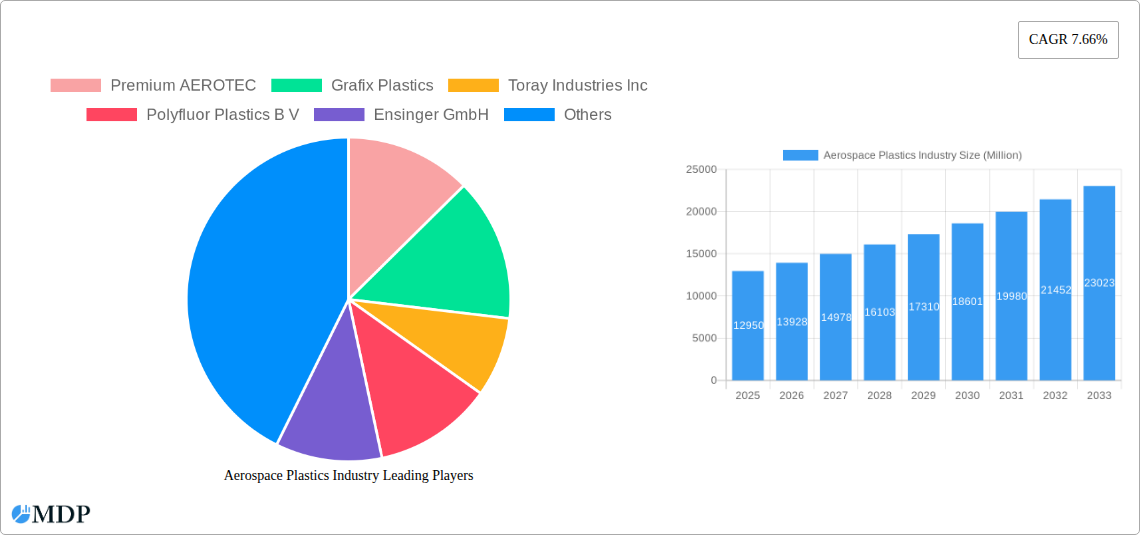
Aerospace Plastics Industry Market Size (In Billion)
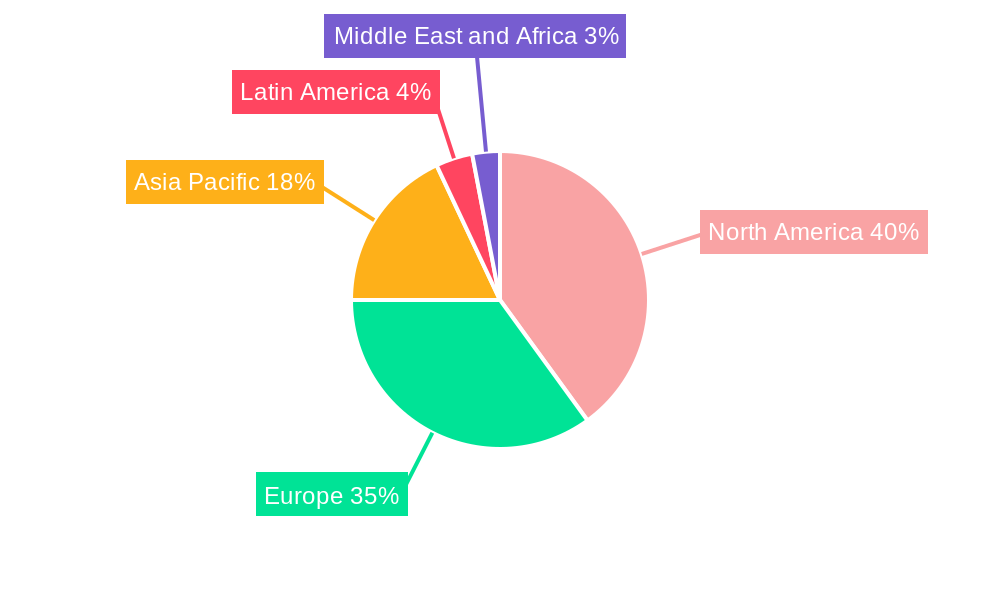
Regional growth patterns are expected to vary. North America and Europe, with their established aerospace manufacturing bases and robust research and development infrastructure, are likely to maintain a dominant market share. However, the Asia-Pacific region, particularly China and India, is anticipated to demonstrate significant growth, driven by expanding domestic aviation industries and government initiatives promoting technological advancements in aerospace. Competition in the market is intense, with established players like Premium AEROTEC and Toray Industries Inc. vying for market share alongside specialized plastics manufacturers. The forecast period (2025-2033) promises continued expansion, influenced by technological advancements, the growing adoption of lightweight materials, and the overall expansion of the aviation and space sectors. The projected CAGR of 7.66% suggests a substantial increase in market value by 2033, reaching an estimated value significantly above the 2025 figure.
Aerospace Plastics Industry Company Market Share
Aerospace Plastics Industry Market Report: 2019-2033 Forecast
Dive deep into the burgeoning Aerospace Plastics Industry with this comprehensive market report, offering actionable insights for stakeholders and investors. This in-depth analysis covers market dynamics, leading players, technological advancements, and future growth projections from 2019 to 2033, with a focus on 2025. Discover key trends, challenges, and opportunities shaping this rapidly evolving sector.
Aerospace Plastics Industry Market Dynamics & Concentration
The global aerospace plastics market, valued at USD xx Million in 2024, is projected to reach USD xx Million by 2033, exhibiting a CAGR of xx% during the forecast period (2025-2033). Market concentration is moderate, with a few key players holding significant market share. Premium AEROTEC and Toray Industries Inc. are prominent examples, although precise market share data requires further analysis.
- Innovation Drivers: Lightweighting initiatives, advancements in high-performance polymers, and increasing demand for sustainable materials are driving innovation.
- Regulatory Frameworks: Stringent safety and environmental regulations influence material selection and manufacturing processes.
- Product Substitutes: The market faces competition from alternative materials like metals and composites, although plastics offer unique advantages in terms of weight and cost.
- End-User Trends: The growing preference for fuel-efficient aircraft and the increasing adoption of electric and hybrid aircraft are driving demand for lightweight and high-strength plastics.
- M&A Activities: The aerospace plastics industry has witnessed a significant number of mergers and acquisitions (M&A) deals in recent years, with approximately xx deals recorded between 2019 and 2024. This consolidation reflects the industry's drive towards efficiency and technological advancement. The acquisition of E.I.S. Aircraft GmbH by Demgy Group in October 2023 highlights this trend.
Aerospace Plastics Industry Industry Trends & Analysis
The aerospace plastics market is experiencing robust growth, fueled by several key factors. The increasing demand for fuel-efficient aircraft is driving the adoption of lightweight plastics. Advancements in materials science, resulting in high-performance polymers with improved strength-to-weight ratios, are another significant contributor. Furthermore, the rising adoption of electric and hybrid-electric aircraft further boosts demand for specialized plastics that can withstand demanding operating conditions. The market penetration of aerospace plastics in various aircraft components is steadily increasing, particularly in aerostructures and cabin interiors. Technological disruptions, such as the development of advanced composites and 3D printing techniques, continue to revolutionize the manufacturing processes. Competitive dynamics are largely shaped by technological advancements and the ability of manufacturers to meet stringent quality and certification standards. Consumer preferences are shifting towards environmentally friendly solutions, creating opportunities for sustainable and recyclable plastics.
Leading Markets & Segments in Aerospace Plastics Industry
The North American and European regions dominate the aerospace plastics market. Specific country-level dominance is currently under investigation. The Aerostructure segment holds the largest market share, driven by the significant demand for lightweight and high-strength materials in aircraft construction.
- Key Drivers for Aerostructure Dominance:
- Lightweighting initiatives to improve fuel efficiency.
- Stringent safety regulations necessitating high-performance materials.
- High capital expenditure in the aerospace manufacturing industry.
- Key Drivers for other segments (General Aviation, Space, Cabin Interiors, Propulsion Systems, Satellites):
- General Aviation and Space: Growing demand for smaller, more efficient aircraft and satellites, with stringent weight requirements.
- Cabin Interiors: Focus on improved passenger comfort and aesthetics, driving demand for specialized plastics with enhanced properties.
- Propulsion Systems: Lightweighting efforts and advancements in composite materials driving innovation in engine and propulsion system design.
- Satellites: High performance, low weight materials are vital to launch cost and operational efficiency.
Further analysis needed to identify definitive dominance on a country or regional level.
Aerospace Plastics Industry Product Developments
Recent product innovations include the development of high-temperature plastics for propulsion systems, self-healing polymers for increased durability, and bio-based plastics for enhanced sustainability. These advancements improve the performance, durability, and environmental friendliness of aerospace plastics, enhancing their market fit and competitiveness.
Key Drivers of Aerospace Plastics Industry Growth
Several factors drive aerospace plastics market growth:
- Technological advancements: Continuous improvements in material properties, such as enhanced strength-to-weight ratios and improved temperature resistance, are crucial drivers.
- Economic growth: Increased global air travel and investments in aircraft manufacturing fuel demand.
- Regulatory frameworks: Regulations promoting fuel efficiency and environmental sustainability drive the adoption of lightweight and sustainable plastics. For example, stricter emissions standards are pushing the development of lighter aircraft.
Challenges in the Aerospace Plastics Industry Market
The aerospace plastics industry faces significant challenges:
- High manufacturing costs: Producing high-performance aerospace plastics can be expensive.
- Supply chain disruptions: Global supply chain volatility affects raw material availability and pricing.
- Stringent quality standards: Meeting strict aerospace certifications is costly and time-consuming. These challenges impact profit margins and market competitiveness. Quantifiable impact currently being assessed.
Emerging Opportunities in Aerospace Plastics Industry
The future holds significant opportunities for growth, driven by advancements in bio-based plastics, the development of next-generation composites, and the expansion into new applications, including electric and hybrid-electric aircraft and space exploration vehicles. Strategic partnerships between material suppliers and aircraft manufacturers will further accelerate market growth.
Leading Players in the Aerospace Plastics Industry Sector
- Premium AEROTEC
- Grafix Plastics
- Toray Industries Inc
- Polyfluor Plastics B V
- Ensinger GmbH
- Curbell Plastics Inc
- Big Bear Plastic Products Limited
- Zeus Industrial Products Inc
- Paco Plastics Inc
- Loar Group Inc
- 3P Performance Plastics Products
Key Milestones in Aerospace Plastics Industry Industry
- January 2023: Toray Industries, Inc. announced a USD 780 Million investment to increase its carbon fiber production capacity by 2025. This significantly boosts the supply of materials crucial for hydrogen fuel tanks and aircraft.
- October 2023: Demgy Group's acquisition of E.I.S. Aircraft GmbH strengthens its position in the German aerospace plastics market and enhances its capabilities in high-value-added plastics processing.
Strategic Outlook for Aerospace Plastics Industry Market
The aerospace plastics market is poised for sustained growth, driven by technological advancements, increasing demand for fuel-efficient aircraft, and rising investments in space exploration. Strategic partnerships, focusing on innovation and sustainability, will be critical for success in this dynamic market. The continued development and adoption of lightweight, high-performance, and sustainable plastics will further drive market expansion in the coming years.
Aerospace Plastics Industry Segmentation
- 1. Production Analysis
- 2. Consumption Analysis
- 3. Import Market Analysis (Value & Volume)
- 4. Export Market Analysis (Value & Volume)
- 5. Price Trend Analysis
Aerospace Plastics Industry Segmentation By Geography
-
1. North America
- 1.1. United States
- 1.2. Canada
- 1.3. Mexico
-
2. South America
- 2.1. Brazil
- 2.2. Argentina
- 2.3. Rest of South America
-
3. Europe
- 3.1. United Kingdom
- 3.2. Germany
- 3.3. France
- 3.4. Italy
- 3.5. Spain
- 3.6. Russia
- 3.7. Benelux
- 3.8. Nordics
- 3.9. Rest of Europe
-
4. Middle East & Africa
- 4.1. Turkey
- 4.2. Israel
- 4.3. GCC
- 4.4. North Africa
- 4.5. South Africa
- 4.6. Rest of Middle East & Africa
-
5. Asia Pacific
- 5.1. China
- 5.2. India
- 5.3. Japan
- 5.4. South Korea
- 5.5. ASEAN
- 5.6. Oceania
- 5.7. Rest of Asia Pacific
Aerospace Plastics Industry Regional Market Share
Geographic Coverage of Aerospace Plastics Industry
Aerospace Plastics Industry REPORT HIGHLIGHTS
| Aspects | Details |
|---|---|
| Study Period | 2020-2034 |
| Base Year | 2025 |
| Estimated Year | 2026 |
| Forecast Period | 2026-2034 |
| Historical Period | 2020-2025 |
| Growth Rate | CAGR of 7.66% from 2020-2034 |
| Segmentation |
|
Table of Contents
- 1. Introduction
- 1.1. Research Scope
- 1.2. Market Segmentation
- 1.3. Research Objective
- 1.4. Definitions and Assumptions
- 2. Executive Summary
- 2.1. Market Snapshot
- 3. Market Dynamics
- 3.1. Market Drivers
- 3.2. Market Restrains
- 3.3. Market Trends
- 3.4. Market Opportunities
- 4. Market Factor Analysis
- 4.1. Porters Five Forces
- 4.1.1. Bargaining Power of Suppliers
- 4.1.2. Bargaining Power of Buyers
- 4.1.3. Threat of New Entrants
- 4.1.4. Threat of Substitutes
- 4.1.5. Competitive Rivalry
- 4.2. PESTEL analysis
- 4.3. BCG Analysis
- 4.3.1. Stars (High Growth, High Market Share)
- 4.3.2. Cash Cows (Low Growth, High Market Share)
- 4.3.3. Question Mark (High Growth, Low Market Share)
- 4.3.4. Dogs (Low Growth, Low Market Share)
- 4.4. Ansoff Matrix Analysis
- 4.5. Supply Chain Analysis
- 4.6. Regulatory Landscape
- 4.7. Current Market Potential and Opportunity Assessment (TAM–SAM–SOM Framework)
- 4.8. MDP Analyst Note
- 4.1. Porters Five Forces
- 5. Market Analysis, Insights and Forecast 2021-2033
- 5.1. Market Analysis, Insights and Forecast - by Production Analysis
- 5.2. Market Analysis, Insights and Forecast - by Consumption Analysis
- 5.3. Market Analysis, Insights and Forecast - by Import Market Analysis (Value & Volume)
- 5.4. Market Analysis, Insights and Forecast - by Export Market Analysis (Value & Volume)
- 5.5. Market Analysis, Insights and Forecast - by Price Trend Analysis
- 5.6. Market Analysis, Insights and Forecast - by Region
- 5.6.1. North America
- 5.6.2. South America
- 5.6.3. Europe
- 5.6.4. Middle East & Africa
- 5.6.5. Asia Pacific
- 6. Global Aerospace Plastics Industry Analysis, Insights and Forecast, 2021-2033
- 6.1. Market Analysis, Insights and Forecast - by Production Analysis
- 6.2. Market Analysis, Insights and Forecast - by Consumption Analysis
- 6.3. Market Analysis, Insights and Forecast - by Import Market Analysis (Value & Volume)
- 6.4. Market Analysis, Insights and Forecast - by Export Market Analysis (Value & Volume)
- 6.5. Market Analysis, Insights and Forecast - by Price Trend Analysis
- 7. North America Aerospace Plastics Industry Analysis, Insights and Forecast, 2020-2032
- 7.1. Market Analysis, Insights and Forecast - by Production Analysis
- 7.2. Market Analysis, Insights and Forecast - by Consumption Analysis
- 7.3. Market Analysis, Insights and Forecast - by Import Market Analysis (Value & Volume)
- 7.4. Market Analysis, Insights and Forecast - by Export Market Analysis (Value & Volume)
- 7.5. Market Analysis, Insights and Forecast - by Price Trend Analysis
- 8. South America Aerospace Plastics Industry Analysis, Insights and Forecast, 2020-2032
- 8.1. Market Analysis, Insights and Forecast - by Production Analysis
- 8.2. Market Analysis, Insights and Forecast - by Consumption Analysis
- 8.3. Market Analysis, Insights and Forecast - by Import Market Analysis (Value & Volume)
- 8.4. Market Analysis, Insights and Forecast - by Export Market Analysis (Value & Volume)
- 8.5. Market Analysis, Insights and Forecast - by Price Trend Analysis
- 9. Europe Aerospace Plastics Industry Analysis, Insights and Forecast, 2020-2032
- 9.1. Market Analysis, Insights and Forecast - by Production Analysis
- 9.2. Market Analysis, Insights and Forecast - by Consumption Analysis
- 9.3. Market Analysis, Insights and Forecast - by Import Market Analysis (Value & Volume)
- 9.4. Market Analysis, Insights and Forecast - by Export Market Analysis (Value & Volume)
- 9.5. Market Analysis, Insights and Forecast - by Price Trend Analysis
- 10. Middle East & Africa Aerospace Plastics Industry Analysis, Insights and Forecast, 2020-2032
- 10.1. Market Analysis, Insights and Forecast - by Production Analysis
- 10.2. Market Analysis, Insights and Forecast - by Consumption Analysis
- 10.3. Market Analysis, Insights and Forecast - by Import Market Analysis (Value & Volume)
- 10.4. Market Analysis, Insights and Forecast - by Export Market Analysis (Value & Volume)
- 10.5. Market Analysis, Insights and Forecast - by Price Trend Analysis
- 11. Asia Pacific Aerospace Plastics Industry Analysis, Insights and Forecast, 2020-2032
- 11.1. Market Analysis, Insights and Forecast - by Production Analysis
- 11.2. Market Analysis, Insights and Forecast - by Consumption Analysis
- 11.3. Market Analysis, Insights and Forecast - by Import Market Analysis (Value & Volume)
- 11.4. Market Analysis, Insights and Forecast - by Export Market Analysis (Value & Volume)
- 11.5. Market Analysis, Insights and Forecast - by Price Trend Analysis
- 12. Competitive Analysis
- 12.1. Company Profiles
- 12.1.1 Premium AEROTEC
- 12.1.1.1. Company Overview
- 12.1.1.2. Products
- 12.1.1.3. Company Financials
- 12.1.1.4. SWOT Analysis
- 12.1.2 Grafix Plastics
- 12.1.2.1. Company Overview
- 12.1.2.2. Products
- 12.1.2.3. Company Financials
- 12.1.2.4. SWOT Analysis
- 12.1.3 Toray Industries Inc
- 12.1.3.1. Company Overview
- 12.1.3.2. Products
- 12.1.3.3. Company Financials
- 12.1.3.4. SWOT Analysis
- 12.1.4 Polyfluor Plastics B V
- 12.1.4.1. Company Overview
- 12.1.4.2. Products
- 12.1.4.3. Company Financials
- 12.1.4.4. SWOT Analysis
- 12.1.5 Ensinger GmbH
- 12.1.5.1. Company Overview
- 12.1.5.2. Products
- 12.1.5.3. Company Financials
- 12.1.5.4. SWOT Analysis
- 12.1.6 Curbell Plastics Inc
- 12.1.6.1. Company Overview
- 12.1.6.2. Products
- 12.1.6.3. Company Financials
- 12.1.6.4. SWOT Analysis
- 12.1.7 Big Bear Plastic Products Limited
- 12.1.7.1. Company Overview
- 12.1.7.2. Products
- 12.1.7.3. Company Financials
- 12.1.7.4. SWOT Analysis
- 12.1.8 Zeus Industrial Products Inc
- 12.1.8.1. Company Overview
- 12.1.8.2. Products
- 12.1.8.3. Company Financials
- 12.1.8.4. SWOT Analysis
- 12.1.9 Paco Plastics Inc
- 12.1.9.1. Company Overview
- 12.1.9.2. Products
- 12.1.9.3. Company Financials
- 12.1.9.4. SWOT Analysis
- 12.1.10 Loar Group Inc
- 12.1.10.1. Company Overview
- 12.1.10.2. Products
- 12.1.10.3. Company Financials
- 12.1.10.4. SWOT Analysis
- 12.1.11 3P Performance Plastics Products
- 12.1.11.1. Company Overview
- 12.1.11.2. Products
- 12.1.11.3. Company Financials
- 12.1.11.4. SWOT Analysis
- 12.1.1 Premium AEROTEC
- 12.2. Market Entropy
- 12.2.1 Company's Key Areas Served
- 12.2.2 Recent Developments
- 12.3. Company Market Share Analysis 2025
- 12.3.1 Top 5 Companies Market Share Analysis
- 12.3.2 Top 3 Companies Market Share Analysis
- 12.4. List of Potential Customers
- 13. Research Methodology
List of Figures
- Figure 1: Global Aerospace Plastics Industry Revenue Breakdown (Million, %) by Region 2025 & 2033
- Figure 2: North America Aerospace Plastics Industry Revenue (Million), by Production Analysis 2025 & 2033
- Figure 3: North America Aerospace Plastics Industry Revenue Share (%), by Production Analysis 2025 & 2033
- Figure 4: North America Aerospace Plastics Industry Revenue (Million), by Consumption Analysis 2025 & 2033
- Figure 5: North America Aerospace Plastics Industry Revenue Share (%), by Consumption Analysis 2025 & 2033
- Figure 6: North America Aerospace Plastics Industry Revenue (Million), by Import Market Analysis (Value & Volume) 2025 & 2033
- Figure 7: North America Aerospace Plastics Industry Revenue Share (%), by Import Market Analysis (Value & Volume) 2025 & 2033
- Figure 8: North America Aerospace Plastics Industry Revenue (Million), by Export Market Analysis (Value & Volume) 2025 & 2033
- Figure 9: North America Aerospace Plastics Industry Revenue Share (%), by Export Market Analysis (Value & Volume) 2025 & 2033
- Figure 10: North America Aerospace Plastics Industry Revenue (Million), by Price Trend Analysis 2025 & 2033
- Figure 11: North America Aerospace Plastics Industry Revenue Share (%), by Price Trend Analysis 2025 & 2033
- Figure 12: North America Aerospace Plastics Industry Revenue (Million), by Country 2025 & 2033
- Figure 13: North America Aerospace Plastics Industry Revenue Share (%), by Country 2025 & 2033
- Figure 14: South America Aerospace Plastics Industry Revenue (Million), by Production Analysis 2025 & 2033
- Figure 15: South America Aerospace Plastics Industry Revenue Share (%), by Production Analysis 2025 & 2033
- Figure 16: South America Aerospace Plastics Industry Revenue (Million), by Consumption Analysis 2025 & 2033
- Figure 17: South America Aerospace Plastics Industry Revenue Share (%), by Consumption Analysis 2025 & 2033
- Figure 18: South America Aerospace Plastics Industry Revenue (Million), by Import Market Analysis (Value & Volume) 2025 & 2033
- Figure 19: South America Aerospace Plastics Industry Revenue Share (%), by Import Market Analysis (Value & Volume) 2025 & 2033
- Figure 20: South America Aerospace Plastics Industry Revenue (Million), by Export Market Analysis (Value & Volume) 2025 & 2033
- Figure 21: South America Aerospace Plastics Industry Revenue Share (%), by Export Market Analysis (Value & Volume) 2025 & 2033
- Figure 22: South America Aerospace Plastics Industry Revenue (Million), by Price Trend Analysis 2025 & 2033
- Figure 23: South America Aerospace Plastics Industry Revenue Share (%), by Price Trend Analysis 2025 & 2033
- Figure 24: South America Aerospace Plastics Industry Revenue (Million), by Country 2025 & 2033
- Figure 25: South America Aerospace Plastics Industry Revenue Share (%), by Country 2025 & 2033
- Figure 26: Europe Aerospace Plastics Industry Revenue (Million), by Production Analysis 2025 & 2033
- Figure 27: Europe Aerospace Plastics Industry Revenue Share (%), by Production Analysis 2025 & 2033
- Figure 28: Europe Aerospace Plastics Industry Revenue (Million), by Consumption Analysis 2025 & 2033
- Figure 29: Europe Aerospace Plastics Industry Revenue Share (%), by Consumption Analysis 2025 & 2033
- Figure 30: Europe Aerospace Plastics Industry Revenue (Million), by Import Market Analysis (Value & Volume) 2025 & 2033
- Figure 31: Europe Aerospace Plastics Industry Revenue Share (%), by Import Market Analysis (Value & Volume) 2025 & 2033
- Figure 32: Europe Aerospace Plastics Industry Revenue (Million), by Export Market Analysis (Value & Volume) 2025 & 2033
- Figure 33: Europe Aerospace Plastics Industry Revenue Share (%), by Export Market Analysis (Value & Volume) 2025 & 2033
- Figure 34: Europe Aerospace Plastics Industry Revenue (Million), by Price Trend Analysis 2025 & 2033
- Figure 35: Europe Aerospace Plastics Industry Revenue Share (%), by Price Trend Analysis 2025 & 2033
- Figure 36: Europe Aerospace Plastics Industry Revenue (Million), by Country 2025 & 2033
- Figure 37: Europe Aerospace Plastics Industry Revenue Share (%), by Country 2025 & 2033
- Figure 38: Middle East & Africa Aerospace Plastics Industry Revenue (Million), by Production Analysis 2025 & 2033
- Figure 39: Middle East & Africa Aerospace Plastics Industry Revenue Share (%), by Production Analysis 2025 & 2033
- Figure 40: Middle East & Africa Aerospace Plastics Industry Revenue (Million), by Consumption Analysis 2025 & 2033
- Figure 41: Middle East & Africa Aerospace Plastics Industry Revenue Share (%), by Consumption Analysis 2025 & 2033
- Figure 42: Middle East & Africa Aerospace Plastics Industry Revenue (Million), by Import Market Analysis (Value & Volume) 2025 & 2033
- Figure 43: Middle East & Africa Aerospace Plastics Industry Revenue Share (%), by Import Market Analysis (Value & Volume) 2025 & 2033
- Figure 44: Middle East & Africa Aerospace Plastics Industry Revenue (Million), by Export Market Analysis (Value & Volume) 2025 & 2033
- Figure 45: Middle East & Africa Aerospace Plastics Industry Revenue Share (%), by Export Market Analysis (Value & Volume) 2025 & 2033
- Figure 46: Middle East & Africa Aerospace Plastics Industry Revenue (Million), by Price Trend Analysis 2025 & 2033
- Figure 47: Middle East & Africa Aerospace Plastics Industry Revenue Share (%), by Price Trend Analysis 2025 & 2033
- Figure 48: Middle East & Africa Aerospace Plastics Industry Revenue (Million), by Country 2025 & 2033
- Figure 49: Middle East & Africa Aerospace Plastics Industry Revenue Share (%), by Country 2025 & 2033
- Figure 50: Asia Pacific Aerospace Plastics Industry Revenue (Million), by Production Analysis 2025 & 2033
- Figure 51: Asia Pacific Aerospace Plastics Industry Revenue Share (%), by Production Analysis 2025 & 2033
- Figure 52: Asia Pacific Aerospace Plastics Industry Revenue (Million), by Consumption Analysis 2025 & 2033
- Figure 53: Asia Pacific Aerospace Plastics Industry Revenue Share (%), by Consumption Analysis 2025 & 2033
- Figure 54: Asia Pacific Aerospace Plastics Industry Revenue (Million), by Import Market Analysis (Value & Volume) 2025 & 2033
- Figure 55: Asia Pacific Aerospace Plastics Industry Revenue Share (%), by Import Market Analysis (Value & Volume) 2025 & 2033
- Figure 56: Asia Pacific Aerospace Plastics Industry Revenue (Million), by Export Market Analysis (Value & Volume) 2025 & 2033
- Figure 57: Asia Pacific Aerospace Plastics Industry Revenue Share (%), by Export Market Analysis (Value & Volume) 2025 & 2033
- Figure 58: Asia Pacific Aerospace Plastics Industry Revenue (Million), by Price Trend Analysis 2025 & 2033
- Figure 59: Asia Pacific Aerospace Plastics Industry Revenue Share (%), by Price Trend Analysis 2025 & 2033
- Figure 60: Asia Pacific Aerospace Plastics Industry Revenue (Million), by Country 2025 & 2033
- Figure 61: Asia Pacific Aerospace Plastics Industry Revenue Share (%), by Country 2025 & 2033
List of Tables
- Table 1: Global Aerospace Plastics Industry Revenue Million Forecast, by Production Analysis 2020 & 2033
- Table 2: Global Aerospace Plastics Industry Revenue Million Forecast, by Consumption Analysis 2020 & 2033
- Table 3: Global Aerospace Plastics Industry Revenue Million Forecast, by Import Market Analysis (Value & Volume) 2020 & 2033
- Table 4: Global Aerospace Plastics Industry Revenue Million Forecast, by Export Market Analysis (Value & Volume) 2020 & 2033
- Table 5: Global Aerospace Plastics Industry Revenue Million Forecast, by Price Trend Analysis 2020 & 2033
- Table 6: Global Aerospace Plastics Industry Revenue Million Forecast, by Region 2020 & 2033
- Table 7: Global Aerospace Plastics Industry Revenue Million Forecast, by Production Analysis 2020 & 2033
- Table 8: Global Aerospace Plastics Industry Revenue Million Forecast, by Consumption Analysis 2020 & 2033
- Table 9: Global Aerospace Plastics Industry Revenue Million Forecast, by Import Market Analysis (Value & Volume) 2020 & 2033
- Table 10: Global Aerospace Plastics Industry Revenue Million Forecast, by Export Market Analysis (Value & Volume) 2020 & 2033
- Table 11: Global Aerospace Plastics Industry Revenue Million Forecast, by Price Trend Analysis 2020 & 2033
- Table 12: Global Aerospace Plastics Industry Revenue Million Forecast, by Country 2020 & 2033
- Table 13: United States Aerospace Plastics Industry Revenue (Million) Forecast, by Application 2020 & 2033
- Table 14: Canada Aerospace Plastics Industry Revenue (Million) Forecast, by Application 2020 & 2033
- Table 15: Mexico Aerospace Plastics Industry Revenue (Million) Forecast, by Application 2020 & 2033
- Table 16: Global Aerospace Plastics Industry Revenue Million Forecast, by Production Analysis 2020 & 2033
- Table 17: Global Aerospace Plastics Industry Revenue Million Forecast, by Consumption Analysis 2020 & 2033
- Table 18: Global Aerospace Plastics Industry Revenue Million Forecast, by Import Market Analysis (Value & Volume) 2020 & 2033
- Table 19: Global Aerospace Plastics Industry Revenue Million Forecast, by Export Market Analysis (Value & Volume) 2020 & 2033
- Table 20: Global Aerospace Plastics Industry Revenue Million Forecast, by Price Trend Analysis 2020 & 2033
- Table 21: Global Aerospace Plastics Industry Revenue Million Forecast, by Country 2020 & 2033
- Table 22: Brazil Aerospace Plastics Industry Revenue (Million) Forecast, by Application 2020 & 2033
- Table 23: Argentina Aerospace Plastics Industry Revenue (Million) Forecast, by Application 2020 & 2033
- Table 24: Rest of South America Aerospace Plastics Industry Revenue (Million) Forecast, by Application 2020 & 2033
- Table 25: Global Aerospace Plastics Industry Revenue Million Forecast, by Production Analysis 2020 & 2033
- Table 26: Global Aerospace Plastics Industry Revenue Million Forecast, by Consumption Analysis 2020 & 2033
- Table 27: Global Aerospace Plastics Industry Revenue Million Forecast, by Import Market Analysis (Value & Volume) 2020 & 2033
- Table 28: Global Aerospace Plastics Industry Revenue Million Forecast, by Export Market Analysis (Value & Volume) 2020 & 2033
- Table 29: Global Aerospace Plastics Industry Revenue Million Forecast, by Price Trend Analysis 2020 & 2033
- Table 30: Global Aerospace Plastics Industry Revenue Million Forecast, by Country 2020 & 2033
- Table 31: United Kingdom Aerospace Plastics Industry Revenue (Million) Forecast, by Application 2020 & 2033
- Table 32: Germany Aerospace Plastics Industry Revenue (Million) Forecast, by Application 2020 & 2033
- Table 33: France Aerospace Plastics Industry Revenue (Million) Forecast, by Application 2020 & 2033
- Table 34: Italy Aerospace Plastics Industry Revenue (Million) Forecast, by Application 2020 & 2033
- Table 35: Spain Aerospace Plastics Industry Revenue (Million) Forecast, by Application 2020 & 2033
- Table 36: Russia Aerospace Plastics Industry Revenue (Million) Forecast, by Application 2020 & 2033
- Table 37: Benelux Aerospace Plastics Industry Revenue (Million) Forecast, by Application 2020 & 2033
- Table 38: Nordics Aerospace Plastics Industry Revenue (Million) Forecast, by Application 2020 & 2033
- Table 39: Rest of Europe Aerospace Plastics Industry Revenue (Million) Forecast, by Application 2020 & 2033
- Table 40: Global Aerospace Plastics Industry Revenue Million Forecast, by Production Analysis 2020 & 2033
- Table 41: Global Aerospace Plastics Industry Revenue Million Forecast, by Consumption Analysis 2020 & 2033
- Table 42: Global Aerospace Plastics Industry Revenue Million Forecast, by Import Market Analysis (Value & Volume) 2020 & 2033
- Table 43: Global Aerospace Plastics Industry Revenue Million Forecast, by Export Market Analysis (Value & Volume) 2020 & 2033
- Table 44: Global Aerospace Plastics Industry Revenue Million Forecast, by Price Trend Analysis 2020 & 2033
- Table 45: Global Aerospace Plastics Industry Revenue Million Forecast, by Country 2020 & 2033
- Table 46: Turkey Aerospace Plastics Industry Revenue (Million) Forecast, by Application 2020 & 2033
- Table 47: Israel Aerospace Plastics Industry Revenue (Million) Forecast, by Application 2020 & 2033
- Table 48: GCC Aerospace Plastics Industry Revenue (Million) Forecast, by Application 2020 & 2033
- Table 49: North Africa Aerospace Plastics Industry Revenue (Million) Forecast, by Application 2020 & 2033
- Table 50: South Africa Aerospace Plastics Industry Revenue (Million) Forecast, by Application 2020 & 2033
- Table 51: Rest of Middle East & Africa Aerospace Plastics Industry Revenue (Million) Forecast, by Application 2020 & 2033
- Table 52: Global Aerospace Plastics Industry Revenue Million Forecast, by Production Analysis 2020 & 2033
- Table 53: Global Aerospace Plastics Industry Revenue Million Forecast, by Consumption Analysis 2020 & 2033
- Table 54: Global Aerospace Plastics Industry Revenue Million Forecast, by Import Market Analysis (Value & Volume) 2020 & 2033
- Table 55: Global Aerospace Plastics Industry Revenue Million Forecast, by Export Market Analysis (Value & Volume) 2020 & 2033
- Table 56: Global Aerospace Plastics Industry Revenue Million Forecast, by Price Trend Analysis 2020 & 2033
- Table 57: Global Aerospace Plastics Industry Revenue Million Forecast, by Country 2020 & 2033
- Table 58: China Aerospace Plastics Industry Revenue (Million) Forecast, by Application 2020 & 2033
- Table 59: India Aerospace Plastics Industry Revenue (Million) Forecast, by Application 2020 & 2033
- Table 60: Japan Aerospace Plastics Industry Revenue (Million) Forecast, by Application 2020 & 2033
- Table 61: South Korea Aerospace Plastics Industry Revenue (Million) Forecast, by Application 2020 & 2033
- Table 62: ASEAN Aerospace Plastics Industry Revenue (Million) Forecast, by Application 2020 & 2033
- Table 63: Oceania Aerospace Plastics Industry Revenue (Million) Forecast, by Application 2020 & 2033
- Table 64: Rest of Asia Pacific Aerospace Plastics Industry Revenue (Million) Forecast, by Application 2020 & 2033
Frequently Asked Questions
1. What is the projected Compound Annual Growth Rate (CAGR) of the Aerospace Plastics Industry?
The projected CAGR is approximately 7.66%.
2. Which companies are prominent players in the Aerospace Plastics Industry?
Key companies in the market include Premium AEROTEC, Grafix Plastics, Toray Industries Inc, Polyfluor Plastics B V, Ensinger GmbH, Curbell Plastics Inc, Big Bear Plastic Products Limited, Zeus Industrial Products Inc, Paco Plastics Inc, Loar Group Inc, 3P Performance Plastics Products.
3. What are the main segments of the Aerospace Plastics Industry?
The market segments include Production Analysis, Consumption Analysis, Import Market Analysis (Value & Volume), Export Market Analysis (Value & Volume), Price Trend Analysis.
4. Can you provide details about the market size?
The market size is estimated to be USD 12.95 Million as of 2022.
5. What are some drivers contributing to market growth?
; Increasing Number Of Air Passengers; Use Of Portable Electronic Devices.
6. What are the notable trends driving market growth?
Cabin Interiors to Witness Higher Growth During the Forecast Period.
7. Are there any restraints impacting market growth?
; High Cost Of Connectivity Equipments.
8. Can you provide examples of recent developments in the market?
In January 2023, Toray Industries, Inc. announced a USD 780 million investment towards increasing its production capacity for carbon fiber materials used in hydrogen fuel tanks and airplanes by 2025.
9. What pricing options are available for accessing the report?
Pricing options include single-user, multi-user, and enterprise licenses priced at USD 4750, USD 5250, and USD 8750 respectively.
10. Is the market size provided in terms of value or volume?
The market size is provided in terms of value, measured in Million.
11. Are there any specific market keywords associated with the report?
Yes, the market keyword associated with the report is "Aerospace Plastics Industry," which aids in identifying and referencing the specific market segment covered.
12. How do I determine which pricing option suits my needs best?
The pricing options vary based on user requirements and access needs. Individual users may opt for single-user licenses, while businesses requiring broader access may choose multi-user or enterprise licenses for cost-effective access to the report.
13. Are there any additional resources or data provided in the Aerospace Plastics Industry report?
While the report offers comprehensive insights, it's advisable to review the specific contents or supplementary materials provided to ascertain if additional resources or data are available.
14. How can I stay updated on further developments or reports in the Aerospace Plastics Industry?
To stay informed about further developments, trends, and reports in the Aerospace Plastics Industry, consider subscribing to industry newsletters, following relevant companies and organizations, or regularly checking reputable industry news sources and publications.
Methodology
Step 1 - Identification of Relevant Samples Size from Population Database


Step 2 - Approaches for Defining Global Market Size (Value, Volume* & Price*)

Note*: In applicable scenarios
Step 3 - Data Sources
Primary Research
- Web Analytics
- Survey Reports
- Research Institute
- Latest Research Reports
- Opinion Leaders
Secondary Research
- Annual Reports
- White Paper
- Latest Press Release
- Industry Association
- Paid Database
- Investor Presentations

Step 4 - Data Triangulation
Involves using different sources of information in order to increase the validity of a study
These sources are likely to be stakeholders in a program - participants, other researchers, program staff, other community members, and so on.
Then we put all data in single framework & apply various statistical tools to find out the dynamic on the market.
During the analysis stage, feedback from the stakeholder groups would be compared to determine areas of agreement as well as areas of divergence