

Key Insights
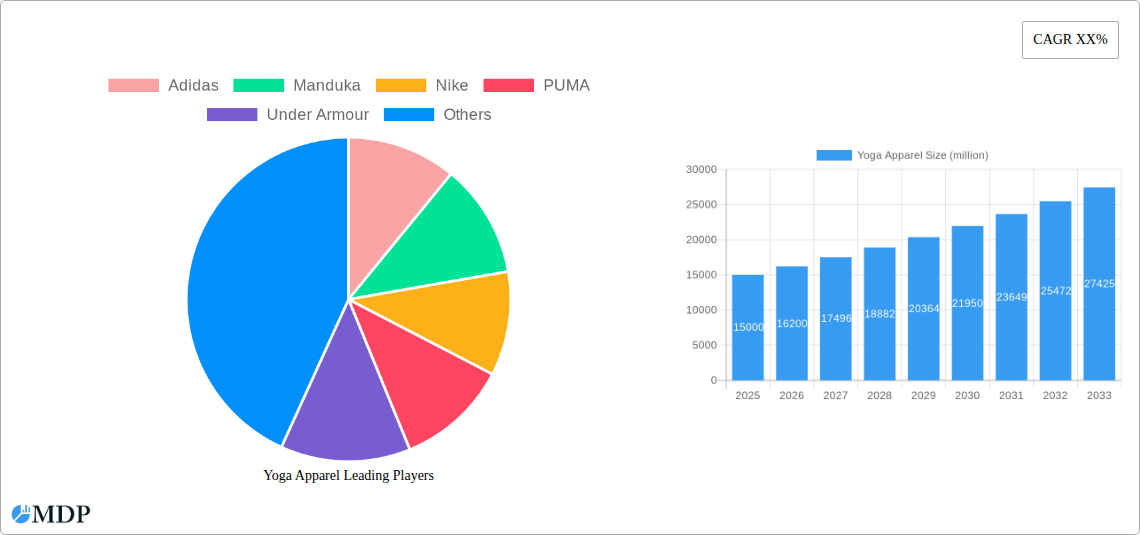
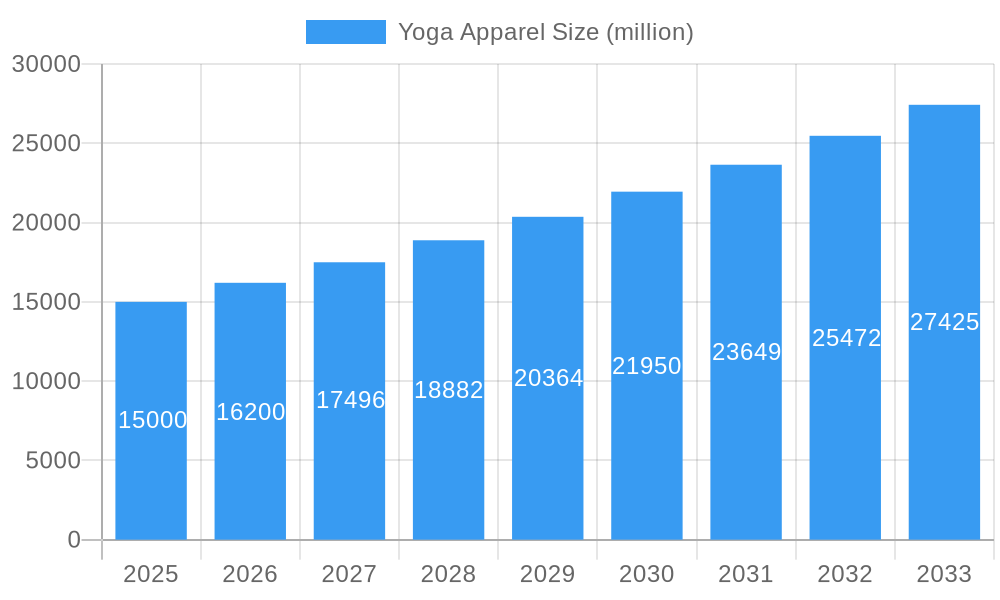
The global yoga apparel market is experiencing robust growth, driven by the increasing popularity of yoga and fitness activities worldwide. The market, estimated at $15 billion in 2025, is projected to exhibit a compound annual growth rate (CAGR) of 8% from 2025 to 2033, reaching an estimated value of $28 billion by 2033. This expansion is fueled by several key factors. Firstly, the rising health consciousness and wellness trends among millennials and Gen Z are significantly boosting demand for comfortable and functional yoga apparel. Secondly, the increasing adoption of online retail channels provides convenient access to a wide variety of products and brands, further fueling market growth. Furthermore, the introduction of innovative fabrics and technologies, such as moisture-wicking and breathable materials, is enhancing the overall consumer experience and driving sales. The market segmentation reveals a strong preference for yoga bottom wear and yoga top wear, indicating a focus on specialized apparel designed for optimal performance and comfort during yoga practice. Major players like Adidas, Nike, and Under Armour are leveraging their established brand recognition and distribution networks to capture significant market share, while smaller, specialized brands cater to niche customer preferences.
Yoga Apparel Market Size (In Billion)
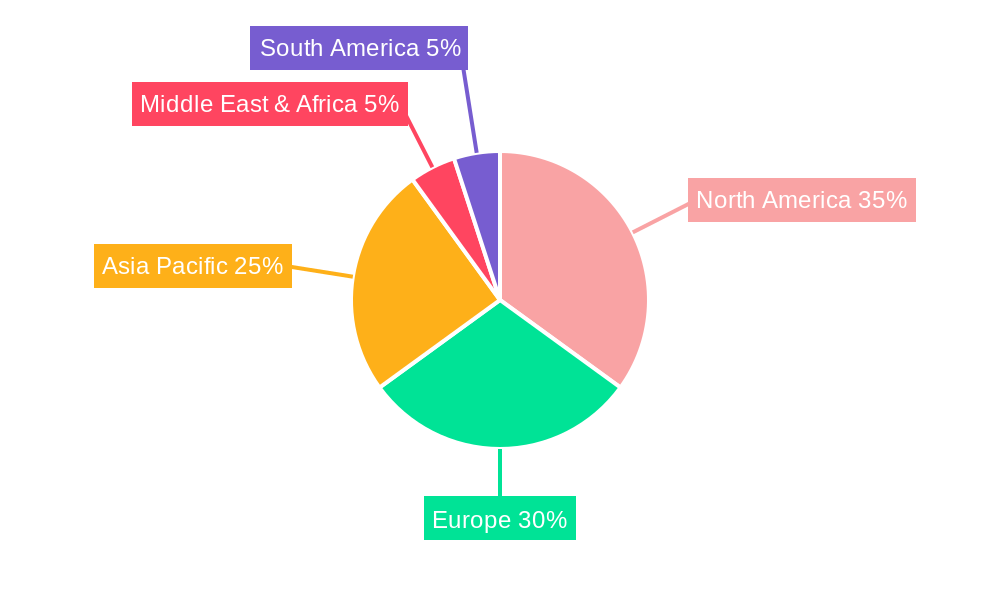
Geographic distribution indicates that North America and Europe currently hold the largest market share, fueled by high levels of yoga participation and disposable income. However, the Asia-Pacific region is projected to witness significant growth in the coming years, driven by rising disposable incomes and increasing adoption of western fitness trends, particularly in countries like India and China. While the market faces potential restraints such as fluctuating raw material prices and intense competition, the overall positive trends in health and wellness suggest that the yoga apparel market is poised for continued, substantial expansion throughout the forecast period. The dominance of online retail is expected to further accelerate this growth by reaching wider customer bases beyond traditional brick-and-mortar stores.
Yoga Apparel Company Market Share
Yoga Apparel Market Report: A $XX Billion Industry Forecast (2019-2033)
This comprehensive report provides an in-depth analysis of the global yoga apparel market, projecting a value of $XX billion by 2033. It delves into market dynamics, leading players, emerging trends, and key opportunities, offering actionable insights for industry stakeholders, investors, and businesses operating within this dynamic sector. The study covers the historical period (2019-2024), the base year (2025), and the forecast period (2025-2033), providing a complete understanding of past performance, current state, and future projections.
Yoga Apparel Market Dynamics & Concentration
The global yoga apparel market is characterized by a moderately concentrated landscape, with key players like Adidas, Nike, and Under Armour holding significant market share. The market's dynamism is driven by continuous product innovation, focusing on sustainable materials and technologically advanced fabrics that enhance performance and comfort. Regulatory frameworks concerning product safety and environmental impact play a crucial role, influencing manufacturing processes and material sourcing. The presence of substitute products, such as athletic wear from other sports, necessitates constant differentiation and value proposition development. Consumer preferences are shifting towards eco-conscious and ethically sourced apparel, impacting brand choices and influencing market strategies. M&A activity within the yoga apparel sector has been moderate, with approximately XX deals recorded between 2019 and 2024, reflecting strategic consolidation and expansion efforts.
- Market Concentration: The top 5 players hold approximately XX% of the market share in 2025.
- Innovation Drivers: Sustainable materials (e.g., recycled fabrics), performance-enhancing technologies (e.g., moisture-wicking), and stylish designs.
- M&A Activity: An estimated XX M&A deals occurred between 2019 and 2024.
- Regulatory Landscape: Compliance with safety and environmental regulations is increasingly important.
- End-User Trends: Growing preference for eco-friendly, ethically sourced, and technologically advanced apparel.
Yoga Apparel Industry Trends & Analysis
The yoga apparel market exhibits a robust growth trajectory, driven by the expanding popularity of yoga and fitness activities globally. The CAGR during the forecast period (2025-2033) is estimated at XX%, reflecting strong consumer demand and industry innovation. Technological disruptions, such as the integration of smart fabrics and wearable technology, are enhancing the functionality and appeal of yoga apparel. Changing consumer preferences towards comfort, style, and performance are influencing product development and marketing strategies. Intense competition necessitates continuous differentiation and brand building efforts. Market penetration is increasing steadily, particularly within online retail channels, reflecting evolving consumer shopping behavior.
Leading Markets & Segments in Yoga Apparel
The North American region dominates the yoga apparel market, driven by high yoga participation rates, disposable income levels, and a strong preference for athletic and fitness apparel. Within application segments, online retail channels exhibit the highest growth rate, fueled by e-commerce expansion and changing consumer preferences. In terms of product types, yoga bottom wear (leggings, pants) constitutes the largest segment, followed by yoga top wear (tanks, shirts).
Key Drivers of North American Dominance: High disposable income, established fitness culture, significant online retail penetration.
Online Retail Growth Drivers: Convenience, wide product selection, competitive pricing, targeted marketing.
Yoga Bottom Wear Dominance: High demand for comfort, versatility, and style.
Application Segment Analysis:
- Online Retail: XX% market share in 2025, projected growth of XX% CAGR.
- Mono Brand Stores: XX% market share in 2025
- Department Stores: XX% market share in 2025
- Others: XX% market share in 2025
Product Type Analysis:
- Yoga Bottom Wear: XX% market share in 2025
- Yoga Top Wear: XX% market share in 2025
- Others: XX% market share in 2025
Yoga Apparel Product Developments
Recent product innovations focus on sustainable materials, enhanced breathability, and moisture-wicking technologies. Brands are incorporating recycled fabrics and eco-friendly manufacturing processes to cater to the growing demand for sustainable apparel. The integration of smart fabrics and wearable technology is emerging as a key area of development, offering features like heart rate monitoring and activity tracking. This trend aligns with consumer preferences for functionality and performance-enhancing features.
Key Drivers of Yoga Apparel Growth
The yoga apparel market is propelled by several factors. The rising popularity of yoga and fitness activities globally is a primary driver. Increasing disposable incomes in developing economies further fuel market expansion. Technological advancements in fabric technology and manufacturing processes enhance product quality and performance. Supportive government policies promoting health and wellness also contribute positively.
Challenges in the Yoga Apparel Market
The yoga apparel market faces challenges including intense competition, fluctuating raw material prices, and evolving consumer preferences. Maintaining supply chain efficiency and managing production costs are significant operational hurdles. Stringent environmental regulations necessitate compliance and potentially higher manufacturing expenses. The constant need for innovation and differentiation in a competitive landscape adds another layer of complexity. The market also faces challenges relating to counterfeiting, which impacts brand reputations and market share. The estimated impact of these challenges on annual revenue is approximately $XX million.
Emerging Opportunities in Yoga Apparel
Significant opportunities exist for long-term growth in the yoga apparel market. Expansion into emerging markets with growing yoga participation represents a key opportunity. Strategic partnerships with fitness studios and influencers can enhance brand visibility and market penetration. Development of innovative products that integrate sustainability, technology, and style promises to unlock considerable market potential. Focus on personalized and customized apparel based on individual needs and preferences presents another area of growth.
Leading Players in the Yoga Apparel Sector
- Adidas
- Manduka
- Nike
- PUMA
- Under Armour
- VF Corporation (VFC)
- Amer Sports
- ASICS America
- Columbia Sportswear
- Eddie Bauer
- Everlast Worldwide
- Hanesbrands
- HuggerMugger
- La Vie Boheme Yoga
- YogaDirect
Key Milestones in Yoga Apparel Industry
- 2020: Increased adoption of sustainable and eco-friendly materials by major brands.
- 2021: Launch of several innovative products integrating smart fabrics and wearable technology.
- 2022: Significant expansion of online retail channels and e-commerce platforms.
- 2023: Growing partnerships between yoga apparel brands and fitness influencers.
- 2024: Increased focus on personalized and customized yoga apparel offerings.
Strategic Outlook for Yoga Apparel Market
The yoga apparel market is poised for continued growth, driven by sustained consumer demand, technological advancements, and increasing market penetration. Strategic initiatives focusing on sustainable practices, technological integration, and effective brand building are key to long-term success. Expansion into emerging markets and strategic collaborations present significant growth opportunities. The development of innovative and personalized products will remain crucial for maintaining competitiveness and securing a strong market position.
Yoga Apparel Segmentation
-
1. Application
- 1.1. Mono Brand Stores
- 1.2. Department Stores
- 1.3. Online Retail
- 1.4. Others
-
2. Types
- 2.1. Yoga Bottom Wear
- 2.2. Yoga Top Wear
- 2.3. Others
Yoga Apparel Segmentation By Geography
-
1. North America
- 1.1. United States
- 1.2. Canada
- 1.3. Mexico
-
2. South America
- 2.1. Brazil
- 2.2. Argentina
- 2.3. Rest of South America
-
3. Europe
- 3.1. United Kingdom
- 3.2. Germany
- 3.3. France
- 3.4. Italy
- 3.5. Spain
- 3.6. Russia
- 3.7. Benelux
- 3.8. Nordics
- 3.9. Rest of Europe
-
4. Middle East & Africa
- 4.1. Turkey
- 4.2. Israel
- 4.3. GCC
- 4.4. North Africa
- 4.5. South Africa
- 4.6. Rest of Middle East & Africa
-
5. Asia Pacific
- 5.1. China
- 5.2. India
- 5.3. Japan
- 5.4. South Korea
- 5.5. ASEAN
- 5.6. Oceania
- 5.7. Rest of Asia Pacific
Yoga Apparel Regional Market Share
Geographic Coverage of Yoga Apparel
Yoga Apparel REPORT HIGHLIGHTS
| Aspects | Details |
|---|---|
| Study Period | 2020-2034 |
| Base Year | 2025 |
| Estimated Year | 2026 |
| Forecast Period | 2026-2034 |
| Historical Period | 2020-2025 |
| Growth Rate | CAGR of 9.7% from 2020-2034 |
| Segmentation |
|
Table of Contents
- 1. Introduction
- 1.1. Research Scope
- 1.2. Market Segmentation
- 1.3. Research Methodology
- 1.4. Definitions and Assumptions
- 2. Executive Summary
- 2.1. Introduction
- 3. Market Dynamics
- 3.1. Introduction
- 3.2. Market Drivers
- 3.3. Market Restrains
- 3.4. Market Trends
- 4. Market Factor Analysis
- 4.1. Porters Five Forces
- 4.2. Supply/Value Chain
- 4.3. PESTEL analysis
- 4.4. Market Entropy
- 4.5. Patent/Trademark Analysis
- 5. Global Yoga Apparel Analysis, Insights and Forecast, 2020-2032
- 5.1. Market Analysis, Insights and Forecast - by Application
- 5.1.1. Mono Brand Stores
- 5.1.2. Department Stores
- 5.1.3. Online Retail
- 5.1.4. Others
- 5.2. Market Analysis, Insights and Forecast - by Types
- 5.2.1. Yoga Bottom Wear
- 5.2.2. Yoga Top Wear
- 5.2.3. Others
- 5.3. Market Analysis, Insights and Forecast - by Region
- 5.3.1. North America
- 5.3.2. South America
- 5.3.3. Europe
- 5.3.4. Middle East & Africa
- 5.3.5. Asia Pacific
- 5.1. Market Analysis, Insights and Forecast - by Application
- 6. North America Yoga Apparel Analysis, Insights and Forecast, 2020-2032
- 6.1. Market Analysis, Insights and Forecast - by Application
- 6.1.1. Mono Brand Stores
- 6.1.2. Department Stores
- 6.1.3. Online Retail
- 6.1.4. Others
- 6.2. Market Analysis, Insights and Forecast - by Types
- 6.2.1. Yoga Bottom Wear
- 6.2.2. Yoga Top Wear
- 6.2.3. Others
- 6.1. Market Analysis, Insights and Forecast - by Application
- 7. South America Yoga Apparel Analysis, Insights and Forecast, 2020-2032
- 7.1. Market Analysis, Insights and Forecast - by Application
- 7.1.1. Mono Brand Stores
- 7.1.2. Department Stores
- 7.1.3. Online Retail
- 7.1.4. Others
- 7.2. Market Analysis, Insights and Forecast - by Types
- 7.2.1. Yoga Bottom Wear
- 7.2.2. Yoga Top Wear
- 7.2.3. Others
- 7.1. Market Analysis, Insights and Forecast - by Application
- 8. Europe Yoga Apparel Analysis, Insights and Forecast, 2020-2032
- 8.1. Market Analysis, Insights and Forecast - by Application
- 8.1.1. Mono Brand Stores
- 8.1.2. Department Stores
- 8.1.3. Online Retail
- 8.1.4. Others
- 8.2. Market Analysis, Insights and Forecast - by Types
- 8.2.1. Yoga Bottom Wear
- 8.2.2. Yoga Top Wear
- 8.2.3. Others
- 8.1. Market Analysis, Insights and Forecast - by Application
- 9. Middle East & Africa Yoga Apparel Analysis, Insights and Forecast, 2020-2032
- 9.1. Market Analysis, Insights and Forecast - by Application
- 9.1.1. Mono Brand Stores
- 9.1.2. Department Stores
- 9.1.3. Online Retail
- 9.1.4. Others
- 9.2. Market Analysis, Insights and Forecast - by Types
- 9.2.1. Yoga Bottom Wear
- 9.2.2. Yoga Top Wear
- 9.2.3. Others
- 9.1. Market Analysis, Insights and Forecast - by Application
- 10. Asia Pacific Yoga Apparel Analysis, Insights and Forecast, 2020-2032
- 10.1. Market Analysis, Insights and Forecast - by Application
- 10.1.1. Mono Brand Stores
- 10.1.2. Department Stores
- 10.1.3. Online Retail
- 10.1.4. Others
- 10.2. Market Analysis, Insights and Forecast - by Types
- 10.2.1. Yoga Bottom Wear
- 10.2.2. Yoga Top Wear
- 10.2.3. Others
- 10.1. Market Analysis, Insights and Forecast - by Application
- 11. Competitive Analysis
- 11.1. Global Market Share Analysis 2025
- 11.2. Company Profiles
- 11.2.1 Adidas
- 11.2.1.1. Overview
- 11.2.1.2. Products
- 11.2.1.3. SWOT Analysis
- 11.2.1.4. Recent Developments
- 11.2.1.5. Financials (Based on Availability)
- 11.2.2 Manduka
- 11.2.2.1. Overview
- 11.2.2.2. Products
- 11.2.2.3. SWOT Analysis
- 11.2.2.4. Recent Developments
- 11.2.2.5. Financials (Based on Availability)
- 11.2.3 Nike
- 11.2.3.1. Overview
- 11.2.3.2. Products
- 11.2.3.3. SWOT Analysis
- 11.2.3.4. Recent Developments
- 11.2.3.5. Financials (Based on Availability)
- 11.2.4 PUMA
- 11.2.4.1. Overview
- 11.2.4.2. Products
- 11.2.4.3. SWOT Analysis
- 11.2.4.4. Recent Developments
- 11.2.4.5. Financials (Based on Availability)
- 11.2.5 Under Armour
- 11.2.5.1. Overview
- 11.2.5.2. Products
- 11.2.5.3. SWOT Analysis
- 11.2.5.4. Recent Developments
- 11.2.5.5. Financials (Based on Availability)
- 11.2.6 VF Corporation (VFC)
- 11.2.6.1. Overview
- 11.2.6.2. Products
- 11.2.6.3. SWOT Analysis
- 11.2.6.4. Recent Developments
- 11.2.6.5. Financials (Based on Availability)
- 11.2.7 Amer Sports
- 11.2.7.1. Overview
- 11.2.7.2. Products
- 11.2.7.3. SWOT Analysis
- 11.2.7.4. Recent Developments
- 11.2.7.5. Financials (Based on Availability)
- 11.2.8 ASICS America
- 11.2.8.1. Overview
- 11.2.8.2. Products
- 11.2.8.3. SWOT Analysis
- 11.2.8.4. Recent Developments
- 11.2.8.5. Financials (Based on Availability)
- 11.2.9 Columbia Sportswear
- 11.2.9.1. Overview
- 11.2.9.2. Products
- 11.2.9.3. SWOT Analysis
- 11.2.9.4. Recent Developments
- 11.2.9.5. Financials (Based on Availability)
- 11.2.10 Eddie Bauer
- 11.2.10.1. Overview
- 11.2.10.2. Products
- 11.2.10.3. SWOT Analysis
- 11.2.10.4. Recent Developments
- 11.2.10.5. Financials (Based on Availability)
- 11.2.11 Everlast Worldwide
- 11.2.11.1. Overview
- 11.2.11.2. Products
- 11.2.11.3. SWOT Analysis
- 11.2.11.4. Recent Developments
- 11.2.11.5. Financials (Based on Availability)
- 11.2.12 Hanesbrands
- 11.2.12.1. Overview
- 11.2.12.2. Products
- 11.2.12.3. SWOT Analysis
- 11.2.12.4. Recent Developments
- 11.2.12.5. Financials (Based on Availability)
- 11.2.13 HuggerMugger
- 11.2.13.1. Overview
- 11.2.13.2. Products
- 11.2.13.3. SWOT Analysis
- 11.2.13.4. Recent Developments
- 11.2.13.5. Financials (Based on Availability)
- 11.2.14 La Vie Boheme Yoga
- 11.2.14.1. Overview
- 11.2.14.2. Products
- 11.2.14.3. SWOT Analysis
- 11.2.14.4. Recent Developments
- 11.2.14.5. Financials (Based on Availability)
- 11.2.15 YogaDirect
- 11.2.15.1. Overview
- 11.2.15.2. Products
- 11.2.15.3. SWOT Analysis
- 11.2.15.4. Recent Developments
- 11.2.15.5. Financials (Based on Availability)
- 11.2.1 Adidas
List of Figures
- Figure 1: Global Yoga Apparel Revenue Breakdown (undefined, %) by Region 2025 & 2033
- Figure 2: Global Yoga Apparel Volume Breakdown (K, %) by Region 2025 & 2033
- Figure 3: North America Yoga Apparel Revenue (undefined), by Application 2025 & 2033
- Figure 4: North America Yoga Apparel Volume (K), by Application 2025 & 2033
- Figure 5: North America Yoga Apparel Revenue Share (%), by Application 2025 & 2033
- Figure 6: North America Yoga Apparel Volume Share (%), by Application 2025 & 2033
- Figure 7: North America Yoga Apparel Revenue (undefined), by Types 2025 & 2033
- Figure 8: North America Yoga Apparel Volume (K), by Types 2025 & 2033
- Figure 9: North America Yoga Apparel Revenue Share (%), by Types 2025 & 2033
- Figure 10: North America Yoga Apparel Volume Share (%), by Types 2025 & 2033
- Figure 11: North America Yoga Apparel Revenue (undefined), by Country 2025 & 2033
- Figure 12: North America Yoga Apparel Volume (K), by Country 2025 & 2033
- Figure 13: North America Yoga Apparel Revenue Share (%), by Country 2025 & 2033
- Figure 14: North America Yoga Apparel Volume Share (%), by Country 2025 & 2033
- Figure 15: South America Yoga Apparel Revenue (undefined), by Application 2025 & 2033
- Figure 16: South America Yoga Apparel Volume (K), by Application 2025 & 2033
- Figure 17: South America Yoga Apparel Revenue Share (%), by Application 2025 & 2033
- Figure 18: South America Yoga Apparel Volume Share (%), by Application 2025 & 2033
- Figure 19: South America Yoga Apparel Revenue (undefined), by Types 2025 & 2033
- Figure 20: South America Yoga Apparel Volume (K), by Types 2025 & 2033
- Figure 21: South America Yoga Apparel Revenue Share (%), by Types 2025 & 2033
- Figure 22: South America Yoga Apparel Volume Share (%), by Types 2025 & 2033
- Figure 23: South America Yoga Apparel Revenue (undefined), by Country 2025 & 2033
- Figure 24: South America Yoga Apparel Volume (K), by Country 2025 & 2033
- Figure 25: South America Yoga Apparel Revenue Share (%), by Country 2025 & 2033
- Figure 26: South America Yoga Apparel Volume Share (%), by Country 2025 & 2033
- Figure 27: Europe Yoga Apparel Revenue (undefined), by Application 2025 & 2033
- Figure 28: Europe Yoga Apparel Volume (K), by Application 2025 & 2033
- Figure 29: Europe Yoga Apparel Revenue Share (%), by Application 2025 & 2033
- Figure 30: Europe Yoga Apparel Volume Share (%), by Application 2025 & 2033
- Figure 31: Europe Yoga Apparel Revenue (undefined), by Types 2025 & 2033
- Figure 32: Europe Yoga Apparel Volume (K), by Types 2025 & 2033
- Figure 33: Europe Yoga Apparel Revenue Share (%), by Types 2025 & 2033
- Figure 34: Europe Yoga Apparel Volume Share (%), by Types 2025 & 2033
- Figure 35: Europe Yoga Apparel Revenue (undefined), by Country 2025 & 2033
- Figure 36: Europe Yoga Apparel Volume (K), by Country 2025 & 2033
- Figure 37: Europe Yoga Apparel Revenue Share (%), by Country 2025 & 2033
- Figure 38: Europe Yoga Apparel Volume Share (%), by Country 2025 & 2033
- Figure 39: Middle East & Africa Yoga Apparel Revenue (undefined), by Application 2025 & 2033
- Figure 40: Middle East & Africa Yoga Apparel Volume (K), by Application 2025 & 2033
- Figure 41: Middle East & Africa Yoga Apparel Revenue Share (%), by Application 2025 & 2033
- Figure 42: Middle East & Africa Yoga Apparel Volume Share (%), by Application 2025 & 2033
- Figure 43: Middle East & Africa Yoga Apparel Revenue (undefined), by Types 2025 & 2033
- Figure 44: Middle East & Africa Yoga Apparel Volume (K), by Types 2025 & 2033
- Figure 45: Middle East & Africa Yoga Apparel Revenue Share (%), by Types 2025 & 2033
- Figure 46: Middle East & Africa Yoga Apparel Volume Share (%), by Types 2025 & 2033
- Figure 47: Middle East & Africa Yoga Apparel Revenue (undefined), by Country 2025 & 2033
- Figure 48: Middle East & Africa Yoga Apparel Volume (K), by Country 2025 & 2033
- Figure 49: Middle East & Africa Yoga Apparel Revenue Share (%), by Country 2025 & 2033
- Figure 50: Middle East & Africa Yoga Apparel Volume Share (%), by Country 2025 & 2033
- Figure 51: Asia Pacific Yoga Apparel Revenue (undefined), by Application 2025 & 2033
- Figure 52: Asia Pacific Yoga Apparel Volume (K), by Application 2025 & 2033
- Figure 53: Asia Pacific Yoga Apparel Revenue Share (%), by Application 2025 & 2033
- Figure 54: Asia Pacific Yoga Apparel Volume Share (%), by Application 2025 & 2033
- Figure 55: Asia Pacific Yoga Apparel Revenue (undefined), by Types 2025 & 2033
- Figure 56: Asia Pacific Yoga Apparel Volume (K), by Types 2025 & 2033
- Figure 57: Asia Pacific Yoga Apparel Revenue Share (%), by Types 2025 & 2033
- Figure 58: Asia Pacific Yoga Apparel Volume Share (%), by Types 2025 & 2033
- Figure 59: Asia Pacific Yoga Apparel Revenue (undefined), by Country 2025 & 2033
- Figure 60: Asia Pacific Yoga Apparel Volume (K), by Country 2025 & 2033
- Figure 61: Asia Pacific Yoga Apparel Revenue Share (%), by Country 2025 & 2033
- Figure 62: Asia Pacific Yoga Apparel Volume Share (%), by Country 2025 & 2033
List of Tables
- Table 1: Global Yoga Apparel Revenue undefined Forecast, by Application 2020 & 2033
- Table 2: Global Yoga Apparel Volume K Forecast, by Application 2020 & 2033
- Table 3: Global Yoga Apparel Revenue undefined Forecast, by Types 2020 & 2033
- Table 4: Global Yoga Apparel Volume K Forecast, by Types 2020 & 2033
- Table 5: Global Yoga Apparel Revenue undefined Forecast, by Region 2020 & 2033
- Table 6: Global Yoga Apparel Volume K Forecast, by Region 2020 & 2033
- Table 7: Global Yoga Apparel Revenue undefined Forecast, by Application 2020 & 2033
- Table 8: Global Yoga Apparel Volume K Forecast, by Application 2020 & 2033
- Table 9: Global Yoga Apparel Revenue undefined Forecast, by Types 2020 & 2033
- Table 10: Global Yoga Apparel Volume K Forecast, by Types 2020 & 2033
- Table 11: Global Yoga Apparel Revenue undefined Forecast, by Country 2020 & 2033
- Table 12: Global Yoga Apparel Volume K Forecast, by Country 2020 & 2033
- Table 13: United States Yoga Apparel Revenue (undefined) Forecast, by Application 2020 & 2033
- Table 14: United States Yoga Apparel Volume (K) Forecast, by Application 2020 & 2033
- Table 15: Canada Yoga Apparel Revenue (undefined) Forecast, by Application 2020 & 2033
- Table 16: Canada Yoga Apparel Volume (K) Forecast, by Application 2020 & 2033
- Table 17: Mexico Yoga Apparel Revenue (undefined) Forecast, by Application 2020 & 2033
- Table 18: Mexico Yoga Apparel Volume (K) Forecast, by Application 2020 & 2033
- Table 19: Global Yoga Apparel Revenue undefined Forecast, by Application 2020 & 2033
- Table 20: Global Yoga Apparel Volume K Forecast, by Application 2020 & 2033
- Table 21: Global Yoga Apparel Revenue undefined Forecast, by Types 2020 & 2033
- Table 22: Global Yoga Apparel Volume K Forecast, by Types 2020 & 2033
- Table 23: Global Yoga Apparel Revenue undefined Forecast, by Country 2020 & 2033
- Table 24: Global Yoga Apparel Volume K Forecast, by Country 2020 & 2033
- Table 25: Brazil Yoga Apparel Revenue (undefined) Forecast, by Application 2020 & 2033
- Table 26: Brazil Yoga Apparel Volume (K) Forecast, by Application 2020 & 2033
- Table 27: Argentina Yoga Apparel Revenue (undefined) Forecast, by Application 2020 & 2033
- Table 28: Argentina Yoga Apparel Volume (K) Forecast, by Application 2020 & 2033
- Table 29: Rest of South America Yoga Apparel Revenue (undefined) Forecast, by Application 2020 & 2033
- Table 30: Rest of South America Yoga Apparel Volume (K) Forecast, by Application 2020 & 2033
- Table 31: Global Yoga Apparel Revenue undefined Forecast, by Application 2020 & 2033
- Table 32: Global Yoga Apparel Volume K Forecast, by Application 2020 & 2033
- Table 33: Global Yoga Apparel Revenue undefined Forecast, by Types 2020 & 2033
- Table 34: Global Yoga Apparel Volume K Forecast, by Types 2020 & 2033
- Table 35: Global Yoga Apparel Revenue undefined Forecast, by Country 2020 & 2033
- Table 36: Global Yoga Apparel Volume K Forecast, by Country 2020 & 2033
- Table 37: United Kingdom Yoga Apparel Revenue (undefined) Forecast, by Application 2020 & 2033
- Table 38: United Kingdom Yoga Apparel Volume (K) Forecast, by Application 2020 & 2033
- Table 39: Germany Yoga Apparel Revenue (undefined) Forecast, by Application 2020 & 2033
- Table 40: Germany Yoga Apparel Volume (K) Forecast, by Application 2020 & 2033
- Table 41: France Yoga Apparel Revenue (undefined) Forecast, by Application 2020 & 2033
- Table 42: France Yoga Apparel Volume (K) Forecast, by Application 2020 & 2033
- Table 43: Italy Yoga Apparel Revenue (undefined) Forecast, by Application 2020 & 2033
- Table 44: Italy Yoga Apparel Volume (K) Forecast, by Application 2020 & 2033
- Table 45: Spain Yoga Apparel Revenue (undefined) Forecast, by Application 2020 & 2033
- Table 46: Spain Yoga Apparel Volume (K) Forecast, by Application 2020 & 2033
- Table 47: Russia Yoga Apparel Revenue (undefined) Forecast, by Application 2020 & 2033
- Table 48: Russia Yoga Apparel Volume (K) Forecast, by Application 2020 & 2033
- Table 49: Benelux Yoga Apparel Revenue (undefined) Forecast, by Application 2020 & 2033
- Table 50: Benelux Yoga Apparel Volume (K) Forecast, by Application 2020 & 2033
- Table 51: Nordics Yoga Apparel Revenue (undefined) Forecast, by Application 2020 & 2033
- Table 52: Nordics Yoga Apparel Volume (K) Forecast, by Application 2020 & 2033
- Table 53: Rest of Europe Yoga Apparel Revenue (undefined) Forecast, by Application 2020 & 2033
- Table 54: Rest of Europe Yoga Apparel Volume (K) Forecast, by Application 2020 & 2033
- Table 55: Global Yoga Apparel Revenue undefined Forecast, by Application 2020 & 2033
- Table 56: Global Yoga Apparel Volume K Forecast, by Application 2020 & 2033
- Table 57: Global Yoga Apparel Revenue undefined Forecast, by Types 2020 & 2033
- Table 58: Global Yoga Apparel Volume K Forecast, by Types 2020 & 2033
- Table 59: Global Yoga Apparel Revenue undefined Forecast, by Country 2020 & 2033
- Table 60: Global Yoga Apparel Volume K Forecast, by Country 2020 & 2033
- Table 61: Turkey Yoga Apparel Revenue (undefined) Forecast, by Application 2020 & 2033
- Table 62: Turkey Yoga Apparel Volume (K) Forecast, by Application 2020 & 2033
- Table 63: Israel Yoga Apparel Revenue (undefined) Forecast, by Application 2020 & 2033
- Table 64: Israel Yoga Apparel Volume (K) Forecast, by Application 2020 & 2033
- Table 65: GCC Yoga Apparel Revenue (undefined) Forecast, by Application 2020 & 2033
- Table 66: GCC Yoga Apparel Volume (K) Forecast, by Application 2020 & 2033
- Table 67: North Africa Yoga Apparel Revenue (undefined) Forecast, by Application 2020 & 2033
- Table 68: North Africa Yoga Apparel Volume (K) Forecast, by Application 2020 & 2033
- Table 69: South Africa Yoga Apparel Revenue (undefined) Forecast, by Application 2020 & 2033
- Table 70: South Africa Yoga Apparel Volume (K) Forecast, by Application 2020 & 2033
- Table 71: Rest of Middle East & Africa Yoga Apparel Revenue (undefined) Forecast, by Application 2020 & 2033
- Table 72: Rest of Middle East & Africa Yoga Apparel Volume (K) Forecast, by Application 2020 & 2033
- Table 73: Global Yoga Apparel Revenue undefined Forecast, by Application 2020 & 2033
- Table 74: Global Yoga Apparel Volume K Forecast, by Application 2020 & 2033
- Table 75: Global Yoga Apparel Revenue undefined Forecast, by Types 2020 & 2033
- Table 76: Global Yoga Apparel Volume K Forecast, by Types 2020 & 2033
- Table 77: Global Yoga Apparel Revenue undefined Forecast, by Country 2020 & 2033
- Table 78: Global Yoga Apparel Volume K Forecast, by Country 2020 & 2033
- Table 79: China Yoga Apparel Revenue (undefined) Forecast, by Application 2020 & 2033
- Table 80: China Yoga Apparel Volume (K) Forecast, by Application 2020 & 2033
- Table 81: India Yoga Apparel Revenue (undefined) Forecast, by Application 2020 & 2033
- Table 82: India Yoga Apparel Volume (K) Forecast, by Application 2020 & 2033
- Table 83: Japan Yoga Apparel Revenue (undefined) Forecast, by Application 2020 & 2033
- Table 84: Japan Yoga Apparel Volume (K) Forecast, by Application 2020 & 2033
- Table 85: South Korea Yoga Apparel Revenue (undefined) Forecast, by Application 2020 & 2033
- Table 86: South Korea Yoga Apparel Volume (K) Forecast, by Application 2020 & 2033
- Table 87: ASEAN Yoga Apparel Revenue (undefined) Forecast, by Application 2020 & 2033
- Table 88: ASEAN Yoga Apparel Volume (K) Forecast, by Application 2020 & 2033
- Table 89: Oceania Yoga Apparel Revenue (undefined) Forecast, by Application 2020 & 2033
- Table 90: Oceania Yoga Apparel Volume (K) Forecast, by Application 2020 & 2033
- Table 91: Rest of Asia Pacific Yoga Apparel Revenue (undefined) Forecast, by Application 2020 & 2033
- Table 92: Rest of Asia Pacific Yoga Apparel Volume (K) Forecast, by Application 2020 & 2033
Frequently Asked Questions
1. What is the projected Compound Annual Growth Rate (CAGR) of the Yoga Apparel?
The projected CAGR is approximately 9.7%.
2. Which companies are prominent players in the Yoga Apparel?
Key companies in the market include Adidas, Manduka, Nike, PUMA, Under Armour, VF Corporation (VFC), Amer Sports, ASICS America, Columbia Sportswear, Eddie Bauer, Everlast Worldwide, Hanesbrands, HuggerMugger, La Vie Boheme Yoga, YogaDirect.
3. What are the main segments of the Yoga Apparel?
The market segments include Application, Types.
4. Can you provide details about the market size?
The market size is estimated to be USD XXX N/A as of 2022.
5. What are some drivers contributing to market growth?
N/A
6. What are the notable trends driving market growth?
N/A
7. Are there any restraints impacting market growth?
N/A
8. Can you provide examples of recent developments in the market?
N/A
9. What pricing options are available for accessing the report?
Pricing options include single-user, multi-user, and enterprise licenses priced at USD 3350.00, USD 5025.00, and USD 6700.00 respectively.
10. Is the market size provided in terms of value or volume?
The market size is provided in terms of value, measured in N/A and volume, measured in K.
11. Are there any specific market keywords associated with the report?
Yes, the market keyword associated with the report is "Yoga Apparel," which aids in identifying and referencing the specific market segment covered.
12. How do I determine which pricing option suits my needs best?
The pricing options vary based on user requirements and access needs. Individual users may opt for single-user licenses, while businesses requiring broader access may choose multi-user or enterprise licenses for cost-effective access to the report.
13. Are there any additional resources or data provided in the Yoga Apparel report?
While the report offers comprehensive insights, it's advisable to review the specific contents or supplementary materials provided to ascertain if additional resources or data are available.
14. How can I stay updated on further developments or reports in the Yoga Apparel?
To stay informed about further developments, trends, and reports in the Yoga Apparel, consider subscribing to industry newsletters, following relevant companies and organizations, or regularly checking reputable industry news sources and publications.
Methodology
Step 1 - Identification of Relevant Samples Size from Population Database


Step 2 - Approaches for Defining Global Market Size (Value, Volume* & Price*)

Note*: In applicable scenarios
Step 3 - Data Sources
Primary Research
- Web Analytics
- Survey Reports
- Research Institute
- Latest Research Reports
- Opinion Leaders
Secondary Research
- Annual Reports
- White Paper
- Latest Press Release
- Industry Association
- Paid Database
- Investor Presentations

Step 4 - Data Triangulation
Involves using different sources of information in order to increase the validity of a study
These sources are likely to be stakeholders in a program - participants, other researchers, program staff, other community members, and so on.
Then we put all data in single framework & apply various statistical tools to find out the dynamic on the market.
During the analysis stage, feedback from the stakeholder groups would be compared to determine areas of agreement as well as areas of divergence