

Key Insights
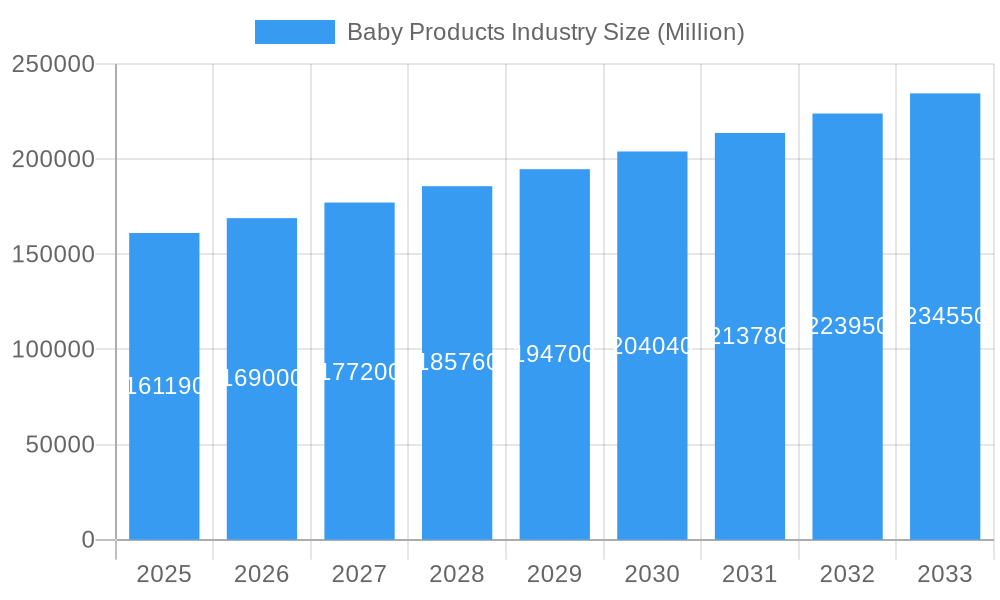
The global baby products market, valued at $161.19 billion in 2025, is projected to experience robust growth, driven by several key factors. Rising disposable incomes in developing economies, coupled with an increasing awareness of the importance of early childhood development and premium baby care, are significantly fueling market expansion. The shift towards smaller family sizes in many regions also contributes to increased spending per child on high-quality products. Furthermore, the burgeoning online retail sector offers unparalleled convenience and access to a wider range of products, accelerating market growth. The market is segmented by distribution channel (supermarkets/hypermarkets, convenience stores, pharmacies/drug stores, online retail stores, other channels) and product type (baby skin care, baby hair care, baby toiletries, baby diapers and wipes, baby food and beverages). The dominance of major players like Unicharm, Abbott, Unilever, and Johnson & Johnson highlights the industry's consolidation, while the presence of regional brands indicates opportunities for niche market penetration. Growth within specific segments, such as organic and eco-friendly baby products, is particularly noteworthy, driven by increasing consumer preference for sustainable and healthier options. While supply chain disruptions and fluctuations in raw material prices pose potential challenges, the overall market outlook remains positive, anticipating consistent growth throughout the forecast period.
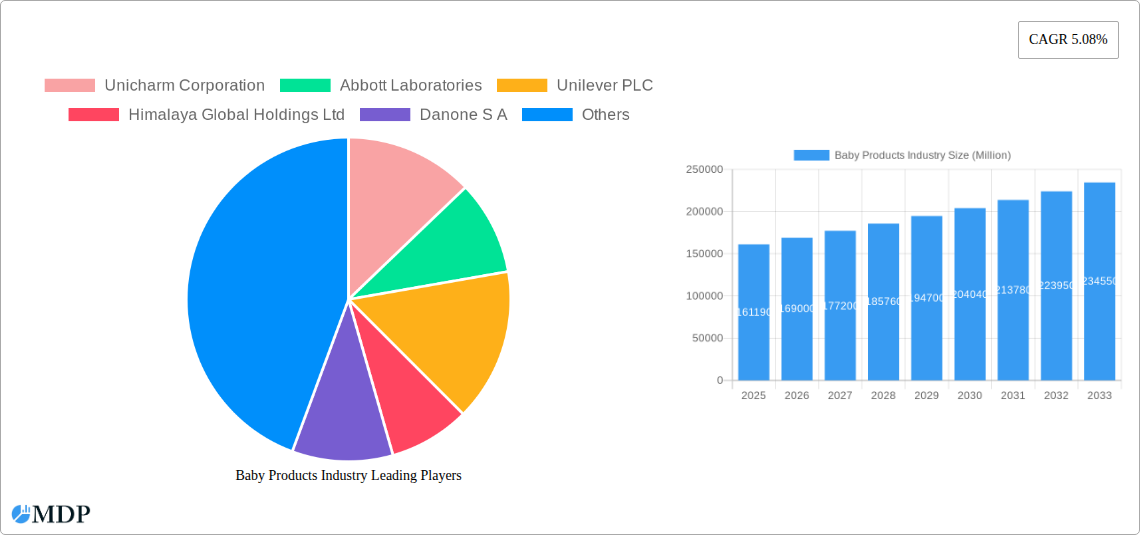
Baby Products Industry Market Size (In Billion)
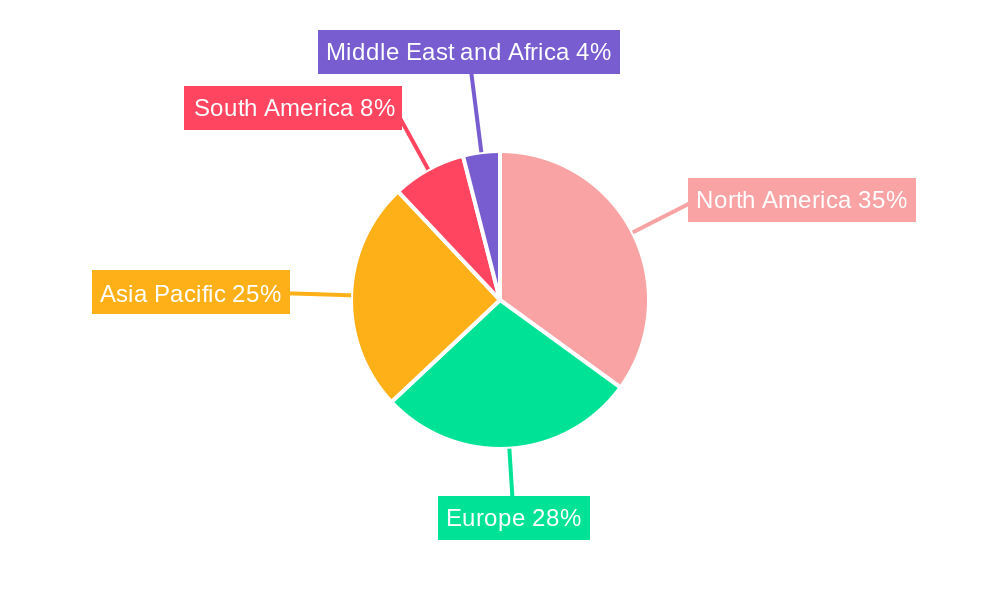
The geographical distribution of the baby products market reveals significant regional variations. North America and Europe currently hold substantial market share, benefiting from high per capita income and established retail infrastructure. However, the Asia-Pacific region, particularly India and China, demonstrates exceptional growth potential due to its large and expanding population base. This region's rising middle class and increasing birth rates are major contributing factors to this potential. South America and the Middle East & Africa also present opportunities for growth, albeit at varying paces, depending on economic development and infrastructure improvements. Competitive strategies will increasingly focus on localization, catering to specific regional needs and preferences, particularly in terms of product formulations and marketing approaches. Brands successfully adapting to evolving consumer demands and leveraging e-commerce platforms will secure a competitive edge in this dynamic market landscape.
Baby Products Industry Company Market Share
Baby Products Industry Report: 2019-2033 Forecast
This comprehensive report provides an in-depth analysis of the global baby products industry, encompassing market dynamics, leading players, emerging trends, and future growth prospects. Valued at $XX Million in 2024, the market is projected to reach $XX Million by 2033, exhibiting a robust CAGR of XX% during the forecast period (2025-2033). This report is essential for industry stakeholders, investors, and businesses seeking to navigate this dynamic sector.
Baby Products Industry Market Dynamics & Concentration
The global baby products market is characterized by a moderately concentrated landscape, with key players like Procter & Gamble, Johnson & Johnson, and Unilever holding significant market share. However, the market also accommodates a multitude of smaller, specialized brands, particularly in niche segments like organic baby food and eco-friendly diapers. Innovation is a crucial driver, with continuous advancements in material science, product design, and sustainability impacting product offerings. Stringent regulatory frameworks governing product safety and labeling vary across regions, influencing market access and competitiveness. The industry witnesses significant M&A activity, with larger companies acquiring smaller players to expand their product portfolios and geographical reach. Substitute products, such as cloth diapers and homemade baby food, pose a competitive threat, particularly among environmentally conscious consumers. Finally, changing end-user trends, including increasing demand for premium and specialized products, influence market growth.
- Market Concentration: High (Top 5 players account for approximately XX% of the market).
- M&A Deal Count (2019-2024): xx deals.
- Innovation Drivers: Sustainable materials, advanced absorbency technologies, personalized nutrition.
- Regulatory Frameworks: Vary significantly by region; compliance requirements influence market entry.
Baby Products Industry Industry Trends & Analysis
The baby products market is experiencing significant growth fueled by several key trends. Rising disposable incomes in developing economies, coupled with increasing awareness of infant health and nutrition, drive demand for premium and specialized products. Technological advancements lead to innovative product features, such as improved diaper absorbency and smart baby monitors. Consumer preferences are shifting towards natural, organic, and eco-friendly options, creating opportunities for brands that prioritize sustainability. The competitive landscape is highly dynamic, with established players facing challenges from smaller, agile brands focusing on specific niches. Market penetration of online retail channels is rapidly increasing, transforming distribution networks and consumer purchasing behavior.
- Market Growth Drivers: Rising disposable incomes, increasing awareness of infant health & nutrition, technological advancements.
- CAGR (2019-2024): XX%
- Market Penetration of Online Retail (2024): XX%
- Technological Disruptions: Smart baby monitors, personalized nutrition solutions, AI-powered feeding systems.
Leading Markets & Segments in Baby Products Industry
The Asia-Pacific region dominates the baby products market, driven by a large and growing population, rising birth rates, and increasing disposable incomes. Within this region, countries like China and India are particularly important. The baby diaper and wipes segment constitutes the largest product category, owing to its essential nature and high frequency of consumption. Supermarkets/hypermarkets represent the primary distribution channel, benefiting from extensive reach and established customer base. However, online retail is rapidly gaining traction, offering convenience and diverse product choices.
- Dominant Region: Asia-Pacific
- Dominant Segment (Product Type): Baby Diapers and Wipes
- Dominant Segment (Distribution Channel): Supermarkets/Hypermarkets
Key Drivers (Asia-Pacific):
- Rapid urbanization and changing lifestyles.
- Increased adoption of Western parenting practices.
- Growing middle class with higher disposable income.
- Government initiatives to promote child health and welfare.
Dominance Analysis: The dominance of Asia-Pacific reflects the region's demographic trends and economic growth. High birth rates and increasing disposable incomes fuel demand for a wider range of baby products, whereas supermarkets and hypermarkets are well-established channels benefiting from significant reach and brand recognition.
Baby Products Industry Product Developments
Recent product innovations have focused on enhanced absorbency, improved comfort, and eco-friendly materials. Companies are incorporating advanced technologies, such as breathable fabrics and hypoallergenic materials, to cater to the needs of sensitive baby skin. Product differentiation is increasingly crucial, with brands focusing on unique features and value propositions to stand out in a competitive marketplace. The trend towards sustainability is driving the development of biodegradable and recyclable products. New product applications also involve integration with smart technologies, offering data-driven insights into infant health and well-being.
Key Drivers of Baby Products Industry Growth
Several factors are driving the growth of the baby products industry. Technological advancements lead to innovative product features, enhancing convenience and safety. Economic growth in emerging markets increases purchasing power, driving up demand for baby products. Favorable government policies, such as those promoting child health and welfare, also contribute to the industry’s growth.
Challenges in the Baby Products Industry Market
The baby products market faces several challenges. Stringent regulatory requirements regarding product safety and labeling can increase compliance costs. Fluctuations in raw material prices can impact profitability. Intense competition among established and emerging brands puts pressure on pricing and margins. Supply chain disruptions can lead to shortages and delays, affecting customer satisfaction and market share.
Emerging Opportunities in Baby Products Industry
The baby products industry presents significant long-term growth opportunities. The rise of e-commerce expands distribution channels, offering global reach and personalized customer experiences. Strategic partnerships among manufacturers, retailers, and healthcare providers create integrated solutions for parents. The development of innovative products catering to specific needs, such as organic baby food and hypoallergenic diapers, targets growing market segments.
Leading Players in the Baby Products Industry Sector
Key Milestones in Baby Products Industry Industry
- January 2024: Pampers launched a new Pampers Premium Care Diaper – a 360-degree coverage all-in-one diaper.
- January 2024: Procter & Gamble Korea launched Pampers Baby-Dry Pants, a diaper designed for improved absorbency.
- February 2024: MamyPoko Pants launched Extra Absorb Pants with 30+ patented technologies, claiming up to 60% increased absorbency.
Strategic Outlook for Baby Products Industry Market
The future of the baby products market is bright, driven by continuous innovation, evolving consumer preferences, and expanding market access. Strategic partnerships and technological advancements will play crucial roles in shaping market dynamics and driving long-term growth. Companies that adapt to changing consumer needs and embrace sustainable practices will be best positioned for success.
Baby Products Industry Segmentation
-
1. Product Type
- 1.1. Baby Skin Care
- 1.2. Baby Hair Care
-
1.3. Baby Toiletries
- 1.3.1. Baby Bath Products and Fragrances
- 1.3.2. Baby Diapers and Wipes
- 1.4. Baby Food and Beverages
-
2. Distribution Channel
- 2.1. Supermarkets/Hypermarkets
- 2.2. Convenience Stores
- 2.3. Pharmacies/Drug Stores
- 2.4. Online Retail Stores
- 2.5. Other Distribution Channels
Baby Products Industry Segmentation By Geography
-
1. North America
- 1.1. United States
- 1.2. Canada
- 1.3. Mexico
- 1.4. Rest of North America
-
2. Europe
- 2.1. United Kingdom
- 2.2. Germany
- 2.3. Spain
- 2.4. France
- 2.5. Italy
- 2.6. Russia
- 2.7. Rest of Europe
-
3. Asia Pacific
- 3.1. China
- 3.2. Japan
- 3.3. India
- 3.4. Australia
- 3.5. Rest of Asia Pacific
-
4. South America
- 4.1. Brazil
- 4.2. Argentina
- 4.3. Rest of South America
-
5. Middle East and Africa
- 5.1. South Africa
- 5.2. Saudi Arabia
- 5.3. Rest of Middle East and Africa
Baby Products Industry Regional Market Share
Geographic Coverage of Baby Products Industry
Baby Products Industry REPORT HIGHLIGHTS
| Aspects | Details |
|---|---|
| Study Period | 2020-2034 |
| Base Year | 2025 |
| Estimated Year | 2026 |
| Forecast Period | 2026-2034 |
| Historical Period | 2020-2025 |
| Growth Rate | CAGR of 5.08% from 2020-2034 |
| Segmentation |
|
Table of Contents
- 1. Introduction
- 1.1. Research Scope
- 1.2. Market Segmentation
- 1.3. Research Objective
- 1.4. Definitions and Assumptions
- 2. Executive Summary
- 2.1. Market Snapshot
- 3. Market Dynamics
- 3.1. Market Drivers
- 3.2. Market Restrains
- 3.3. Market Trends
- 3.4. Market Opportunities
- 4. Market Factor Analysis
- 4.1. Porters Five Forces
- 4.1.1. Bargaining Power of Suppliers
- 4.1.2. Bargaining Power of Buyers
- 4.1.3. Threat of New Entrants
- 4.1.4. Threat of Substitutes
- 4.1.5. Competitive Rivalry
- 4.2. PESTEL analysis
- 4.3. BCG Analysis
- 4.3.1. Stars (High Growth, High Market Share)
- 4.3.2. Cash Cows (Low Growth, High Market Share)
- 4.3.3. Question Mark (High Growth, Low Market Share)
- 4.3.4. Dogs (Low Growth, Low Market Share)
- 4.4. Ansoff Matrix Analysis
- 4.5. Supply Chain Analysis
- 4.6. Regulatory Landscape
- 4.7. Current Market Potential and Opportunity Assessment (TAM–SAM–SOM Framework)
- 4.8. MDP Analyst Note
- 4.1. Porters Five Forces
- 5. Market Analysis, Insights and Forecast 2021-2033
- 5.1. Market Analysis, Insights and Forecast - by Product Type
- 5.1.1. Baby Skin Care
- 5.1.2. Baby Hair Care
- 5.1.3. Baby Toiletries
- 5.1.3.1. Baby Bath Products and Fragrances
- 5.1.3.2. Baby Diapers and Wipes
- 5.1.4. Baby Food and Beverages
- 5.2. Market Analysis, Insights and Forecast - by Distribution Channel
- 5.2.1. Supermarkets/Hypermarkets
- 5.2.2. Convenience Stores
- 5.2.3. Pharmacies/Drug Stores
- 5.2.4. Online Retail Stores
- 5.2.5. Other Distribution Channels
- 5.3. Market Analysis, Insights and Forecast - by Region
- 5.3.1. North America
- 5.3.2. Europe
- 5.3.3. Asia Pacific
- 5.3.4. South America
- 5.3.5. Middle East and Africa
- 5.1. Market Analysis, Insights and Forecast - by Product Type
- 6. Global Baby Products Industry Analysis, Insights and Forecast, 2021-2033
- 6.1. Market Analysis, Insights and Forecast - by Product Type
- 6.1.1. Baby Skin Care
- 6.1.2. Baby Hair Care
- 6.1.3. Baby Toiletries
- 6.1.3.1. Baby Bath Products and Fragrances
- 6.1.3.2. Baby Diapers and Wipes
- 6.1.4. Baby Food and Beverages
- 6.2. Market Analysis, Insights and Forecast - by Distribution Channel
- 6.2.1. Supermarkets/Hypermarkets
- 6.2.2. Convenience Stores
- 6.2.3. Pharmacies/Drug Stores
- 6.2.4. Online Retail Stores
- 6.2.5. Other Distribution Channels
- 6.1. Market Analysis, Insights and Forecast - by Product Type
- 7. North America Baby Products Industry Analysis, Insights and Forecast, 2020-2032
- 7.1. Market Analysis, Insights and Forecast - by Product Type
- 7.1.1. Baby Skin Care
- 7.1.2. Baby Hair Care
- 7.1.3. Baby Toiletries
- 7.1.3.1. Baby Bath Products and Fragrances
- 7.1.3.2. Baby Diapers and Wipes
- 7.1.4. Baby Food and Beverages
- 7.2. Market Analysis, Insights and Forecast - by Distribution Channel
- 7.2.1. Supermarkets/Hypermarkets
- 7.2.2. Convenience Stores
- 7.2.3. Pharmacies/Drug Stores
- 7.2.4. Online Retail Stores
- 7.2.5. Other Distribution Channels
- 7.1. Market Analysis, Insights and Forecast - by Product Type
- 8. Europe Baby Products Industry Analysis, Insights and Forecast, 2020-2032
- 8.1. Market Analysis, Insights and Forecast - by Product Type
- 8.1.1. Baby Skin Care
- 8.1.2. Baby Hair Care
- 8.1.3. Baby Toiletries
- 8.1.3.1. Baby Bath Products and Fragrances
- 8.1.3.2. Baby Diapers and Wipes
- 8.1.4. Baby Food and Beverages
- 8.2. Market Analysis, Insights and Forecast - by Distribution Channel
- 8.2.1. Supermarkets/Hypermarkets
- 8.2.2. Convenience Stores
- 8.2.3. Pharmacies/Drug Stores
- 8.2.4. Online Retail Stores
- 8.2.5. Other Distribution Channels
- 8.1. Market Analysis, Insights and Forecast - by Product Type
- 9. Asia Pacific Baby Products Industry Analysis, Insights and Forecast, 2020-2032
- 9.1. Market Analysis, Insights and Forecast - by Product Type
- 9.1.1. Baby Skin Care
- 9.1.2. Baby Hair Care
- 9.1.3. Baby Toiletries
- 9.1.3.1. Baby Bath Products and Fragrances
- 9.1.3.2. Baby Diapers and Wipes
- 9.1.4. Baby Food and Beverages
- 9.2. Market Analysis, Insights and Forecast - by Distribution Channel
- 9.2.1. Supermarkets/Hypermarkets
- 9.2.2. Convenience Stores
- 9.2.3. Pharmacies/Drug Stores
- 9.2.4. Online Retail Stores
- 9.2.5. Other Distribution Channels
- 9.1. Market Analysis, Insights and Forecast - by Product Type
- 10. South America Baby Products Industry Analysis, Insights and Forecast, 2020-2032
- 10.1. Market Analysis, Insights and Forecast - by Product Type
- 10.1.1. Baby Skin Care
- 10.1.2. Baby Hair Care
- 10.1.3. Baby Toiletries
- 10.1.3.1. Baby Bath Products and Fragrances
- 10.1.3.2. Baby Diapers and Wipes
- 10.1.4. Baby Food and Beverages
- 10.2. Market Analysis, Insights and Forecast - by Distribution Channel
- 10.2.1. Supermarkets/Hypermarkets
- 10.2.2. Convenience Stores
- 10.2.3. Pharmacies/Drug Stores
- 10.2.4. Online Retail Stores
- 10.2.5. Other Distribution Channels
- 10.1. Market Analysis, Insights and Forecast - by Product Type
- 11. Middle East and Africa Baby Products Industry Analysis, Insights and Forecast, 2020-2032
- 11.1. Market Analysis, Insights and Forecast - by Product Type
- 11.1.1. Baby Skin Care
- 11.1.2. Baby Hair Care
- 11.1.3. Baby Toiletries
- 11.1.3.1. Baby Bath Products and Fragrances
- 11.1.3.2. Baby Diapers and Wipes
- 11.1.4. Baby Food and Beverages
- 11.2. Market Analysis, Insights and Forecast - by Distribution Channel
- 11.2.1. Supermarkets/Hypermarkets
- 11.2.2. Convenience Stores
- 11.2.3. Pharmacies/Drug Stores
- 11.2.4. Online Retail Stores
- 11.2.5. Other Distribution Channels
- 11.1. Market Analysis, Insights and Forecast - by Product Type
- 12. Competitive Analysis
- 12.1. Company Profiles
- 12.1.1 Unicharm Corporation
- 12.1.1.1. Company Overview
- 12.1.1.2. Products
- 12.1.1.3. Company Financials
- 12.1.1.4. SWOT Analysis
- 12.1.2 Abbott Laboratories
- 12.1.2.1. Company Overview
- 12.1.2.2. Products
- 12.1.2.3. Company Financials
- 12.1.2.4. SWOT Analysis
- 12.1.3 Unilever PLC
- 12.1.3.1. Company Overview
- 12.1.3.2. Products
- 12.1.3.3. Company Financials
- 12.1.3.4. SWOT Analysis
- 12.1.4 Himalaya Global Holdings Ltd
- 12.1.4.1. Company Overview
- 12.1.4.2. Products
- 12.1.4.3. Company Financials
- 12.1.4.4. SWOT Analysis
- 12.1.5 Danone S A
- 12.1.5.1. Company Overview
- 12.1.5.2. Products
- 12.1.5.3. Company Financials
- 12.1.5.4. SWOT Analysis
- 12.1.6 Kimberly-Clark Corporation
- 12.1.6.1. Company Overview
- 12.1.6.2. Products
- 12.1.6.3. Company Financials
- 12.1.6.4. SWOT Analysis
- 12.1.7 Johnson & Johnson
- 12.1.7.1. Company Overview
- 12.1.7.2. Products
- 12.1.7.3. Company Financials
- 12.1.7.4. SWOT Analysis
- 12.1.8 Procter & Gamble Company
- 12.1.8.1. Company Overview
- 12.1.8.2. Products
- 12.1.8.3. Company Financials
- 12.1.8.4. SWOT Analysis
- 12.1.9 Royal Frieslandcampina N V *List Not Exhaustive
- 12.1.9.1. Company Overview
- 12.1.9.2. Products
- 12.1.9.3. Company Financials
- 12.1.9.4. SWOT Analysis
- 12.1.10 Nestlé S A
- 12.1.10.1. Company Overview
- 12.1.10.2. Products
- 12.1.10.3. Company Financials
- 12.1.10.4. SWOT Analysis
- 12.1.1 Unicharm Corporation
- 12.2. Market Entropy
- 12.2.1 Company's Key Areas Served
- 12.2.2 Recent Developments
- 12.3. Company Market Share Analysis 2025
- 12.3.1 Top 5 Companies Market Share Analysis
- 12.3.2 Top 3 Companies Market Share Analysis
- 12.4. List of Potential Customers
- 13. Research Methodology
List of Figures
- Figure 1: Global Baby Products Industry Revenue Breakdown (Million, %) by Region 2025 & 2033
- Figure 2: Global Baby Products Industry Volume Breakdown (K Units, %) by Region 2025 & 2033
- Figure 3: North America Baby Products Industry Revenue (Million), by Product Type 2025 & 2033
- Figure 4: North America Baby Products Industry Volume (K Units), by Product Type 2025 & 2033
- Figure 5: North America Baby Products Industry Revenue Share (%), by Product Type 2025 & 2033
- Figure 6: North America Baby Products Industry Volume Share (%), by Product Type 2025 & 2033
- Figure 7: North America Baby Products Industry Revenue (Million), by Distribution Channel 2025 & 2033
- Figure 8: North America Baby Products Industry Volume (K Units), by Distribution Channel 2025 & 2033
- Figure 9: North America Baby Products Industry Revenue Share (%), by Distribution Channel 2025 & 2033
- Figure 10: North America Baby Products Industry Volume Share (%), by Distribution Channel 2025 & 2033
- Figure 11: North America Baby Products Industry Revenue (Million), by Country 2025 & 2033
- Figure 12: North America Baby Products Industry Volume (K Units), by Country 2025 & 2033
- Figure 13: North America Baby Products Industry Revenue Share (%), by Country 2025 & 2033
- Figure 14: North America Baby Products Industry Volume Share (%), by Country 2025 & 2033
- Figure 15: Europe Baby Products Industry Revenue (Million), by Product Type 2025 & 2033
- Figure 16: Europe Baby Products Industry Volume (K Units), by Product Type 2025 & 2033
- Figure 17: Europe Baby Products Industry Revenue Share (%), by Product Type 2025 & 2033
- Figure 18: Europe Baby Products Industry Volume Share (%), by Product Type 2025 & 2033
- Figure 19: Europe Baby Products Industry Revenue (Million), by Distribution Channel 2025 & 2033
- Figure 20: Europe Baby Products Industry Volume (K Units), by Distribution Channel 2025 & 2033
- Figure 21: Europe Baby Products Industry Revenue Share (%), by Distribution Channel 2025 & 2033
- Figure 22: Europe Baby Products Industry Volume Share (%), by Distribution Channel 2025 & 2033
- Figure 23: Europe Baby Products Industry Revenue (Million), by Country 2025 & 2033
- Figure 24: Europe Baby Products Industry Volume (K Units), by Country 2025 & 2033
- Figure 25: Europe Baby Products Industry Revenue Share (%), by Country 2025 & 2033
- Figure 26: Europe Baby Products Industry Volume Share (%), by Country 2025 & 2033
- Figure 27: Asia Pacific Baby Products Industry Revenue (Million), by Product Type 2025 & 2033
- Figure 28: Asia Pacific Baby Products Industry Volume (K Units), by Product Type 2025 & 2033
- Figure 29: Asia Pacific Baby Products Industry Revenue Share (%), by Product Type 2025 & 2033
- Figure 30: Asia Pacific Baby Products Industry Volume Share (%), by Product Type 2025 & 2033
- Figure 31: Asia Pacific Baby Products Industry Revenue (Million), by Distribution Channel 2025 & 2033
- Figure 32: Asia Pacific Baby Products Industry Volume (K Units), by Distribution Channel 2025 & 2033
- Figure 33: Asia Pacific Baby Products Industry Revenue Share (%), by Distribution Channel 2025 & 2033
- Figure 34: Asia Pacific Baby Products Industry Volume Share (%), by Distribution Channel 2025 & 2033
- Figure 35: Asia Pacific Baby Products Industry Revenue (Million), by Country 2025 & 2033
- Figure 36: Asia Pacific Baby Products Industry Volume (K Units), by Country 2025 & 2033
- Figure 37: Asia Pacific Baby Products Industry Revenue Share (%), by Country 2025 & 2033
- Figure 38: Asia Pacific Baby Products Industry Volume Share (%), by Country 2025 & 2033
- Figure 39: South America Baby Products Industry Revenue (Million), by Product Type 2025 & 2033
- Figure 40: South America Baby Products Industry Volume (K Units), by Product Type 2025 & 2033
- Figure 41: South America Baby Products Industry Revenue Share (%), by Product Type 2025 & 2033
- Figure 42: South America Baby Products Industry Volume Share (%), by Product Type 2025 & 2033
- Figure 43: South America Baby Products Industry Revenue (Million), by Distribution Channel 2025 & 2033
- Figure 44: South America Baby Products Industry Volume (K Units), by Distribution Channel 2025 & 2033
- Figure 45: South America Baby Products Industry Revenue Share (%), by Distribution Channel 2025 & 2033
- Figure 46: South America Baby Products Industry Volume Share (%), by Distribution Channel 2025 & 2033
- Figure 47: South America Baby Products Industry Revenue (Million), by Country 2025 & 2033
- Figure 48: South America Baby Products Industry Volume (K Units), by Country 2025 & 2033
- Figure 49: South America Baby Products Industry Revenue Share (%), by Country 2025 & 2033
- Figure 50: South America Baby Products Industry Volume Share (%), by Country 2025 & 2033
- Figure 51: Middle East and Africa Baby Products Industry Revenue (Million), by Product Type 2025 & 2033
- Figure 52: Middle East and Africa Baby Products Industry Volume (K Units), by Product Type 2025 & 2033
- Figure 53: Middle East and Africa Baby Products Industry Revenue Share (%), by Product Type 2025 & 2033
- Figure 54: Middle East and Africa Baby Products Industry Volume Share (%), by Product Type 2025 & 2033
- Figure 55: Middle East and Africa Baby Products Industry Revenue (Million), by Distribution Channel 2025 & 2033
- Figure 56: Middle East and Africa Baby Products Industry Volume (K Units), by Distribution Channel 2025 & 2033
- Figure 57: Middle East and Africa Baby Products Industry Revenue Share (%), by Distribution Channel 2025 & 2033
- Figure 58: Middle East and Africa Baby Products Industry Volume Share (%), by Distribution Channel 2025 & 2033
- Figure 59: Middle East and Africa Baby Products Industry Revenue (Million), by Country 2025 & 2033
- Figure 60: Middle East and Africa Baby Products Industry Volume (K Units), by Country 2025 & 2033
- Figure 61: Middle East and Africa Baby Products Industry Revenue Share (%), by Country 2025 & 2033
- Figure 62: Middle East and Africa Baby Products Industry Volume Share (%), by Country 2025 & 2033
List of Tables
- Table 1: Global Baby Products Industry Revenue Million Forecast, by Product Type 2020 & 2033
- Table 2: Global Baby Products Industry Volume K Units Forecast, by Product Type 2020 & 2033
- Table 3: Global Baby Products Industry Revenue Million Forecast, by Distribution Channel 2020 & 2033
- Table 4: Global Baby Products Industry Volume K Units Forecast, by Distribution Channel 2020 & 2033
- Table 5: Global Baby Products Industry Revenue Million Forecast, by Region 2020 & 2033
- Table 6: Global Baby Products Industry Volume K Units Forecast, by Region 2020 & 2033
- Table 7: Global Baby Products Industry Revenue Million Forecast, by Product Type 2020 & 2033
- Table 8: Global Baby Products Industry Volume K Units Forecast, by Product Type 2020 & 2033
- Table 9: Global Baby Products Industry Revenue Million Forecast, by Distribution Channel 2020 & 2033
- Table 10: Global Baby Products Industry Volume K Units Forecast, by Distribution Channel 2020 & 2033
- Table 11: Global Baby Products Industry Revenue Million Forecast, by Country 2020 & 2033
- Table 12: Global Baby Products Industry Volume K Units Forecast, by Country 2020 & 2033
- Table 13: United States Baby Products Industry Revenue (Million) Forecast, by Application 2020 & 2033
- Table 14: United States Baby Products Industry Volume (K Units) Forecast, by Application 2020 & 2033
- Table 15: Canada Baby Products Industry Revenue (Million) Forecast, by Application 2020 & 2033
- Table 16: Canada Baby Products Industry Volume (K Units) Forecast, by Application 2020 & 2033
- Table 17: Mexico Baby Products Industry Revenue (Million) Forecast, by Application 2020 & 2033
- Table 18: Mexico Baby Products Industry Volume (K Units) Forecast, by Application 2020 & 2033
- Table 19: Rest of North America Baby Products Industry Revenue (Million) Forecast, by Application 2020 & 2033
- Table 20: Rest of North America Baby Products Industry Volume (K Units) Forecast, by Application 2020 & 2033
- Table 21: Global Baby Products Industry Revenue Million Forecast, by Product Type 2020 & 2033
- Table 22: Global Baby Products Industry Volume K Units Forecast, by Product Type 2020 & 2033
- Table 23: Global Baby Products Industry Revenue Million Forecast, by Distribution Channel 2020 & 2033
- Table 24: Global Baby Products Industry Volume K Units Forecast, by Distribution Channel 2020 & 2033
- Table 25: Global Baby Products Industry Revenue Million Forecast, by Country 2020 & 2033
- Table 26: Global Baby Products Industry Volume K Units Forecast, by Country 2020 & 2033
- Table 27: United Kingdom Baby Products Industry Revenue (Million) Forecast, by Application 2020 & 2033
- Table 28: United Kingdom Baby Products Industry Volume (K Units) Forecast, by Application 2020 & 2033
- Table 29: Germany Baby Products Industry Revenue (Million) Forecast, by Application 2020 & 2033
- Table 30: Germany Baby Products Industry Volume (K Units) Forecast, by Application 2020 & 2033
- Table 31: Spain Baby Products Industry Revenue (Million) Forecast, by Application 2020 & 2033
- Table 32: Spain Baby Products Industry Volume (K Units) Forecast, by Application 2020 & 2033
- Table 33: France Baby Products Industry Revenue (Million) Forecast, by Application 2020 & 2033
- Table 34: France Baby Products Industry Volume (K Units) Forecast, by Application 2020 & 2033
- Table 35: Italy Baby Products Industry Revenue (Million) Forecast, by Application 2020 & 2033
- Table 36: Italy Baby Products Industry Volume (K Units) Forecast, by Application 2020 & 2033
- Table 37: Russia Baby Products Industry Revenue (Million) Forecast, by Application 2020 & 2033
- Table 38: Russia Baby Products Industry Volume (K Units) Forecast, by Application 2020 & 2033
- Table 39: Rest of Europe Baby Products Industry Revenue (Million) Forecast, by Application 2020 & 2033
- Table 40: Rest of Europe Baby Products Industry Volume (K Units) Forecast, by Application 2020 & 2033
- Table 41: Global Baby Products Industry Revenue Million Forecast, by Product Type 2020 & 2033
- Table 42: Global Baby Products Industry Volume K Units Forecast, by Product Type 2020 & 2033
- Table 43: Global Baby Products Industry Revenue Million Forecast, by Distribution Channel 2020 & 2033
- Table 44: Global Baby Products Industry Volume K Units Forecast, by Distribution Channel 2020 & 2033
- Table 45: Global Baby Products Industry Revenue Million Forecast, by Country 2020 & 2033
- Table 46: Global Baby Products Industry Volume K Units Forecast, by Country 2020 & 2033
- Table 47: China Baby Products Industry Revenue (Million) Forecast, by Application 2020 & 2033
- Table 48: China Baby Products Industry Volume (K Units) Forecast, by Application 2020 & 2033
- Table 49: Japan Baby Products Industry Revenue (Million) Forecast, by Application 2020 & 2033
- Table 50: Japan Baby Products Industry Volume (K Units) Forecast, by Application 2020 & 2033
- Table 51: India Baby Products Industry Revenue (Million) Forecast, by Application 2020 & 2033
- Table 52: India Baby Products Industry Volume (K Units) Forecast, by Application 2020 & 2033
- Table 53: Australia Baby Products Industry Revenue (Million) Forecast, by Application 2020 & 2033
- Table 54: Australia Baby Products Industry Volume (K Units) Forecast, by Application 2020 & 2033
- Table 55: Rest of Asia Pacific Baby Products Industry Revenue (Million) Forecast, by Application 2020 & 2033
- Table 56: Rest of Asia Pacific Baby Products Industry Volume (K Units) Forecast, by Application 2020 & 2033
- Table 57: Global Baby Products Industry Revenue Million Forecast, by Product Type 2020 & 2033
- Table 58: Global Baby Products Industry Volume K Units Forecast, by Product Type 2020 & 2033
- Table 59: Global Baby Products Industry Revenue Million Forecast, by Distribution Channel 2020 & 2033
- Table 60: Global Baby Products Industry Volume K Units Forecast, by Distribution Channel 2020 & 2033
- Table 61: Global Baby Products Industry Revenue Million Forecast, by Country 2020 & 2033
- Table 62: Global Baby Products Industry Volume K Units Forecast, by Country 2020 & 2033
- Table 63: Brazil Baby Products Industry Revenue (Million) Forecast, by Application 2020 & 2033
- Table 64: Brazil Baby Products Industry Volume (K Units) Forecast, by Application 2020 & 2033
- Table 65: Argentina Baby Products Industry Revenue (Million) Forecast, by Application 2020 & 2033
- Table 66: Argentina Baby Products Industry Volume (K Units) Forecast, by Application 2020 & 2033
- Table 67: Rest of South America Baby Products Industry Revenue (Million) Forecast, by Application 2020 & 2033
- Table 68: Rest of South America Baby Products Industry Volume (K Units) Forecast, by Application 2020 & 2033
- Table 69: Global Baby Products Industry Revenue Million Forecast, by Product Type 2020 & 2033
- Table 70: Global Baby Products Industry Volume K Units Forecast, by Product Type 2020 & 2033
- Table 71: Global Baby Products Industry Revenue Million Forecast, by Distribution Channel 2020 & 2033
- Table 72: Global Baby Products Industry Volume K Units Forecast, by Distribution Channel 2020 & 2033
- Table 73: Global Baby Products Industry Revenue Million Forecast, by Country 2020 & 2033
- Table 74: Global Baby Products Industry Volume K Units Forecast, by Country 2020 & 2033
- Table 75: South Africa Baby Products Industry Revenue (Million) Forecast, by Application 2020 & 2033
- Table 76: South Africa Baby Products Industry Volume (K Units) Forecast, by Application 2020 & 2033
- Table 77: Saudi Arabia Baby Products Industry Revenue (Million) Forecast, by Application 2020 & 2033
- Table 78: Saudi Arabia Baby Products Industry Volume (K Units) Forecast, by Application 2020 & 2033
- Table 79: Rest of Middle East and Africa Baby Products Industry Revenue (Million) Forecast, by Application 2020 & 2033
- Table 80: Rest of Middle East and Africa Baby Products Industry Volume (K Units) Forecast, by Application 2020 & 2033
Frequently Asked Questions
1. What is the projected Compound Annual Growth Rate (CAGR) of the Baby Products Industry?
The projected CAGR is approximately 5.08%.
2. Which companies are prominent players in the Baby Products Industry?
Key companies in the market include Unicharm Corporation, Abbott Laboratories, Unilever PLC, Himalaya Global Holdings Ltd, Danone S A, Kimberly-Clark Corporation, Johnson & Johnson, Procter & Gamble Company, Royal Frieslandcampina N V *List Not Exhaustive, Nestlé S A.
3. What are the main segments of the Baby Products Industry?
The market segments include Product Type, Distribution Channel.
4. Can you provide details about the market size?
The market size is estimated to be USD 161.19 Million as of 2022.
5. What are some drivers contributing to market growth?
Concerns Among Parents Toward Baby Personal Care and Hygiene; Influence of Endorsements and Aggressive Marketing.
6. What are the notable trends driving market growth?
Increasing Preference for Fortified Baby Food.
7. Are there any restraints impacting market growth?
Presence of Counterfeit Products.
8. Can you provide examples of recent developments in the market?
February 2024: MamyPoko Pants launched Extra Absorb Pants with 30+ patented technologies. The diapers are claimed to be up to 60% absorbent.
9. What pricing options are available for accessing the report?
Pricing options include single-user, multi-user, and enterprise licenses priced at USD 4750, USD 5250, and USD 8750 respectively.
10. Is the market size provided in terms of value or volume?
The market size is provided in terms of value, measured in Million and volume, measured in K Units.
11. Are there any specific market keywords associated with the report?
Yes, the market keyword associated with the report is "Baby Products Industry," which aids in identifying and referencing the specific market segment covered.
12. How do I determine which pricing option suits my needs best?
The pricing options vary based on user requirements and access needs. Individual users may opt for single-user licenses, while businesses requiring broader access may choose multi-user or enterprise licenses for cost-effective access to the report.
13. Are there any additional resources or data provided in the Baby Products Industry report?
While the report offers comprehensive insights, it's advisable to review the specific contents or supplementary materials provided to ascertain if additional resources or data are available.
14. How can I stay updated on further developments or reports in the Baby Products Industry?
To stay informed about further developments, trends, and reports in the Baby Products Industry, consider subscribing to industry newsletters, following relevant companies and organizations, or regularly checking reputable industry news sources and publications.
Methodology
Step 1 - Identification of Relevant Samples Size from Population Database


Step 2 - Approaches for Defining Global Market Size (Value, Volume* & Price*)

Note*: In applicable scenarios
Step 3 - Data Sources
Primary Research
- Web Analytics
- Survey Reports
- Research Institute
- Latest Research Reports
- Opinion Leaders
Secondary Research
- Annual Reports
- White Paper
- Latest Press Release
- Industry Association
- Paid Database
- Investor Presentations

Step 4 - Data Triangulation
Involves using different sources of information in order to increase the validity of a study
These sources are likely to be stakeholders in a program - participants, other researchers, program staff, other community members, and so on.
Then we put all data in single framework & apply various statistical tools to find out the dynamic on the market.
During the analysis stage, feedback from the stakeholder groups would be compared to determine areas of agreement as well as areas of divergence