

Key Insights
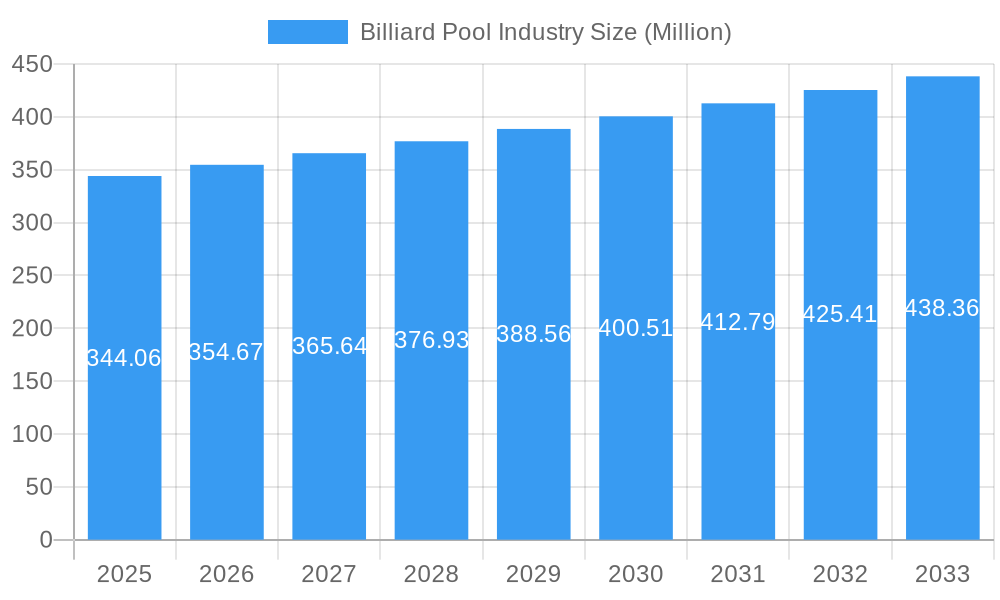
The global billiard pool market, valued at $344.06 million in 2025, is projected to experience steady growth, driven by several key factors. Rising disposable incomes in developing economies, coupled with increased leisure time and a growing interest in recreational activities, are fueling demand for billiard tables and equipment. The increasing popularity of professional billiard tournaments and the rise of online gaming communities further contribute to market expansion. While the market is segmented by game type (carom, pool, snooker), equipment (tables, balls, cues, other accessories), and distribution channels (offline and online retail), the strongest growth is expected in the online retail segment due to its convenience and wider reach. Furthermore, the introduction of innovative table designs, technologically advanced cues, and virtual reality gaming experiences are shaping market trends. However, the relatively high cost of equipment and the space requirements for billiard tables might pose challenges, potentially restraining market growth in certain regions. Despite these constraints, the market's inherent appeal and the ongoing development of new products and gaming experiences are expected to ensure continued growth in the coming years.
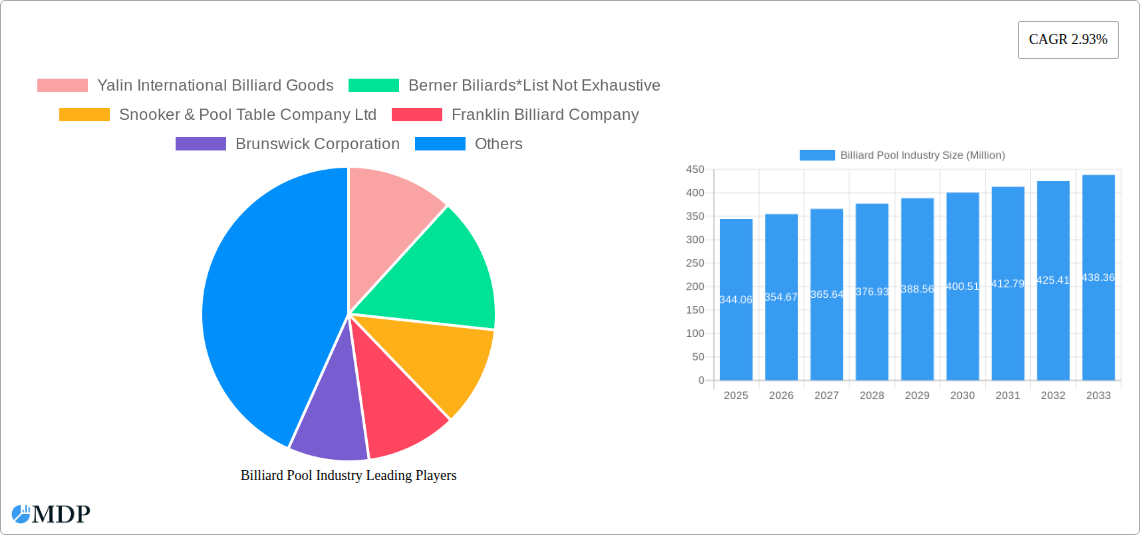
Billiard Pool Industry Market Size (In Million)
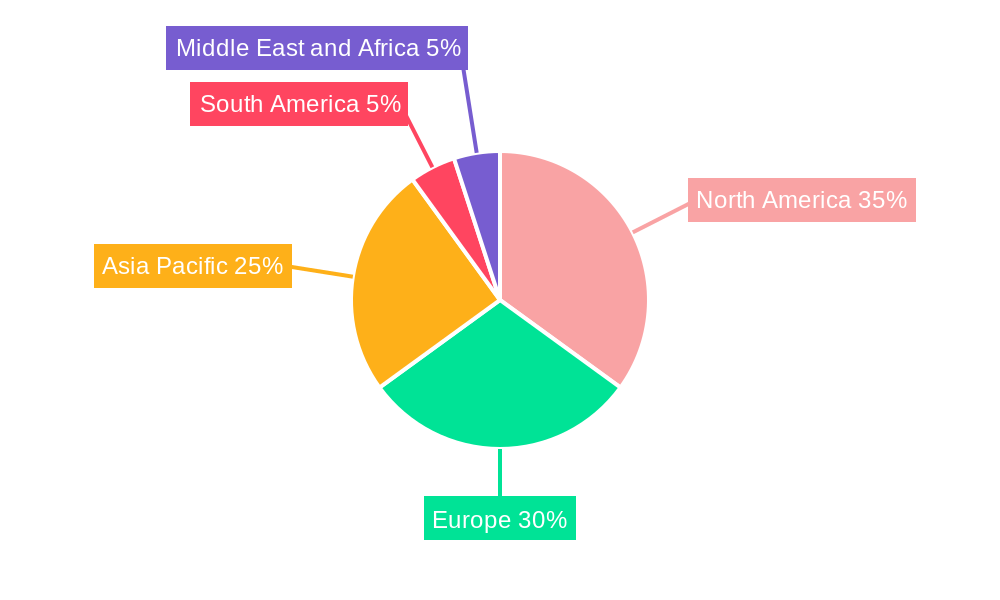
The regional distribution of the market displays variations in growth potential. North America and Europe currently hold significant market shares, owing to established infrastructure and a strong sporting culture. However, the Asia-Pacific region, particularly countries like China and India, presents substantial growth opportunities due to a burgeoning middle class and increased adoption of recreational activities. South America and the Middle East and Africa are anticipated to exhibit modest growth, driven by localized market development and the expansion of sporting goods retail channels. Key players in the market, such as Yalin International Billiard Goods, Berner Billiards, and Brunswick Corporation, are focusing on product innovation, strategic partnerships, and geographic expansion to capitalize on the expanding market. Competition is expected to intensify, leading to further innovation and price adjustments to cater to diverse consumer preferences.
Billiard Pool Industry Company Market Share
Billiard Pool Industry Market Report: 2019-2033
This comprehensive report provides a detailed analysis of the Billiard Pool industry, covering market dynamics, trends, leading players, and future outlook. With a study period spanning 2019-2033, a base year of 2025, and a forecast period of 2025-2033, this report is an essential resource for industry stakeholders seeking actionable insights and strategic guidance. The global Billiard Pool market is projected to reach xx Million by 2033, exhibiting a CAGR of xx% during the forecast period.
Billiard Pool Industry Market Dynamics & Concentration
The Billiard Pool industry exhibits a moderately concentrated market structure, with several key players commanding significant market share. Yalin International Billiard Goods, Berner Billiards, Snooker & Pool Table Company Ltd, Franklin Billiard Company, Brunswick Corporation, H Betti Industries Inc, Imperial International, Diamond Billiard Products Inc, Kaldera Billiards, and Birmingham Billiards Ltd are some of the prominent players. However, the presence of numerous smaller, regional players contributes to a dynamic competitive landscape.
Market concentration is influenced by factors including brand recognition, product innovation, distribution networks, and economies of scale. The industry's growth is driven by innovation in table design, cue technology, and game accessories. Regulatory frameworks, while generally minimal, vary by region and impact product safety and standards. Product substitutes, such as video games and other recreational activities, pose a competitive challenge. End-user trends indicate a growing interest in premium, high-quality products and personalized experiences. M&A activity in the industry has been moderate, with xx deals recorded during the historical period (2019-2024), primarily focused on expanding market reach and product portfolios. Market share data for individual companies is currently unavailable (xx).
Billiard Pool Industry Industry Trends & Analysis
The Billiard Pool industry has witnessed consistent growth fueled by several key trends. Rising disposable incomes in emerging markets and a growing interest in leisure activities are primary drivers. Technological advancements such as smart tables with integrated scoring systems and enhanced cue designs are disrupting the traditional market. Consumer preferences are shifting towards aesthetically appealing, high-quality tables, reflecting a lifestyle trend emphasizing sophisticated home entertainment. The competitive landscape is marked by ongoing innovation, strategic partnerships, and a focus on premium product offerings. The market is expected to experience a CAGR of xx% from 2025 to 2033, with significant market penetration anticipated in emerging economies. The shift towards online retail channels also represents a significant trend, influencing both sales and customer engagement strategies.
Leading Markets & Segments in Billiard Pool Industry
The North American market currently holds the leading position in the Billiard Pool industry, driven by high consumer spending and a strong culture of recreational games. Within the product segments, Pool tables represent the largest segment, capturing xx% of the market share followed by cues (xx%) and balls (xx%). Online retail stores are gaining traction, with a xx% market share, although offline retail stores remain dominant (xx%).
Key Drivers of North American Dominance:
- Strong established Billiards culture
- High disposable incomes
- Extensive retail infrastructure
Key Drivers of Online Retail Growth:
- Convenience and accessibility
- Wider product selection
- Competitive pricing
Billiard Pool Industry Product Developments
Recent years have witnessed significant product innovations, including smart tables with integrated technology, high-performance cues with advanced shaft designs, and aesthetically appealing tables tailored to modern home décor. These developments highlight the industry’s focus on enhancing the gaming experience through technology and design. The market is increasingly witnessing a focus on premium products with enhanced features and customizability. Companies are leveraging technology to improve product quality, durability, and overall user experience.
Key Drivers of Billiard Pool Industry Growth
Several factors contribute to the ongoing growth of the Billiard Pool industry. Technological advancements enhance gameplay and user experience; economic growth in developing nations increases disposable income, fueling demand for leisure activities; and supportive government policies in some regions foster industry development. The increasing popularity of Billiards as a social activity also contributes to market expansion.
Challenges in the Billiard Pool Industry Market
The Billiard Pool industry faces challenges such as intense competition, fluctuating raw material costs, and the rising popularity of alternative leisure activities. Supply chain disruptions and economic downturns can significantly impact market growth, particularly for smaller companies. The increasing cost of manufacturing and shipping, coupled with maintaining competitive pricing, presents a significant operational challenge.
Emerging Opportunities in Billiard Pool Industry
Several factors present exciting opportunities for the Billiard Pool industry. Technological innovation, such as virtual reality integration, augmented reality, and interactive gaming features for billiard tables, presents enormous potential for market expansion. Strategic partnerships with game developers and entertainment companies could further enhance the appeal of the game and expand the market. Expansion into untapped global markets and targeted marketing campaigns are crucial for long-term sustainable growth.
Leading Players in the Billiard Pool Industry Sector
- Yalin International Billiard Goods
- Berner Billiards
- Snooker & Pool Table Company Ltd
- Franklin Billiard Company
- Brunswick Corporation
- H Betti Industries Inc
- Imperial International
- Diamond Billiard Products Inc
- Kaldera Billiards
- Birmingham Billiards Ltd
Key Milestones in Billiard Pool Industry Industry
- May 2021: Bugatti launched a USD 300,000 pool table with gyroscopic self-leveling, showcasing luxury and technological innovation.
- May 2022: FCI Billiards opened a new showroom, expanding its retail presence and accessibility.
- October 2022: Sawyer Twain launched the Nixon Billiards line, introducing new designs and styles to the North American market.
Strategic Outlook for Billiard Pool Industry Market
The Billiard Pool industry is poised for continued growth, driven by technological advancements, shifting consumer preferences, and expansion into new markets. Strategic investments in research and development, targeted marketing campaigns, and the development of innovative products will be crucial for securing a strong position in this dynamic market. The industry's future hinges on adapting to changing consumer needs and leveraging technological progress to create engaging and immersive gaming experiences.
Billiard Pool Industry Segmentation
-
1. Type
- 1.1. Carom
- 1.2. Pool
- 1.3. Snooker
-
2. Equipment
- 2.1. Table
- 2.2. Ball
- 2.3. Cue
- 2.4. Other Equipment
-
3. Distribution Channel
- 3.1. Offline Retail Stores
- 3.2. Online Retail Stores
Billiard Pool Industry Segmentation By Geography
-
1. North America
- 1.1. United States
- 1.2. Canada
- 1.3. Mexico
- 1.4. Rest of North America
-
2. Europe
- 2.1. Spain
- 2.2. United Kingdom
- 2.3. Germany
- 2.4. France
- 2.5. Italy
- 2.6. Belgium
- 2.7. Rest of Europe
-
3. Asia Pacific
- 3.1. China
- 3.2. Japan
- 3.3. India
- 3.4. Australia
- 3.5. Rest of Asia Pacific
-
4. South America
- 4.1. Brazil
- 4.2. Argentina
- 4.3. Rest of South America
-
5. Middle East and Africa
- 5.1. South Africa
- 5.2. United Arab Emirates
- 5.3. Rest of Middle East and Africa
Billiard Pool Industry Regional Market Share
Geographic Coverage of Billiard Pool Industry
Billiard Pool Industry REPORT HIGHLIGHTS
| Aspects | Details |
|---|---|
| Study Period | 2020-2034 |
| Base Year | 2025 |
| Estimated Year | 2026 |
| Forecast Period | 2026-2034 |
| Historical Period | 2020-2025 |
| Growth Rate | CAGR of 2.93% from 2020-2034 |
| Segmentation |
|
Table of Contents
- 1. Introduction
- 1.1. Research Scope
- 1.2. Market Segmentation
- 1.3. Research Objective
- 1.4. Definitions and Assumptions
- 2. Executive Summary
- 2.1. Market Snapshot
- 3. Market Dynamics
- 3.1. Market Drivers
- 3.2. Market Restrains
- 3.3. Market Trends
- 3.4. Market Opportunities
- 4. Market Factor Analysis
- 4.1. Porters Five Forces
- 4.1.1. Bargaining Power of Suppliers
- 4.1.2. Bargaining Power of Buyers
- 4.1.3. Threat of New Entrants
- 4.1.4. Threat of Substitutes
- 4.1.5. Competitive Rivalry
- 4.2. PESTEL analysis
- 4.3. BCG Analysis
- 4.3.1. Stars (High Growth, High Market Share)
- 4.3.2. Cash Cows (Low Growth, High Market Share)
- 4.3.3. Question Mark (High Growth, Low Market Share)
- 4.3.4. Dogs (Low Growth, Low Market Share)
- 4.4. Ansoff Matrix Analysis
- 4.5. Supply Chain Analysis
- 4.6. Regulatory Landscape
- 4.7. Current Market Potential and Opportunity Assessment (TAM–SAM–SOM Framework)
- 4.8. MDP Analyst Note
- 4.1. Porters Five Forces
- 5. Market Analysis, Insights and Forecast 2021-2033
- 5.1. Market Analysis, Insights and Forecast - by Type
- 5.1.1. Carom
- 5.1.2. Pool
- 5.1.3. Snooker
- 5.2. Market Analysis, Insights and Forecast - by Equipment
- 5.2.1. Table
- 5.2.2. Ball
- 5.2.3. Cue
- 5.2.4. Other Equipment
- 5.3. Market Analysis, Insights and Forecast - by Distribution Channel
- 5.3.1. Offline Retail Stores
- 5.3.2. Online Retail Stores
- 5.4. Market Analysis, Insights and Forecast - by Region
- 5.4.1. North America
- 5.4.2. Europe
- 5.4.3. Asia Pacific
- 5.4.4. South America
- 5.4.5. Middle East and Africa
- 5.1. Market Analysis, Insights and Forecast - by Type
- 6. Global Billiard Pool Industry Analysis, Insights and Forecast, 2021-2033
- 6.1. Market Analysis, Insights and Forecast - by Type
- 6.1.1. Carom
- 6.1.2. Pool
- 6.1.3. Snooker
- 6.2. Market Analysis, Insights and Forecast - by Equipment
- 6.2.1. Table
- 6.2.2. Ball
- 6.2.3. Cue
- 6.2.4. Other Equipment
- 6.3. Market Analysis, Insights and Forecast - by Distribution Channel
- 6.3.1. Offline Retail Stores
- 6.3.2. Online Retail Stores
- 6.1. Market Analysis, Insights and Forecast - by Type
- 7. North America Billiard Pool Industry Analysis, Insights and Forecast, 2020-2032
- 7.1. Market Analysis, Insights and Forecast - by Type
- 7.1.1. Carom
- 7.1.2. Pool
- 7.1.3. Snooker
- 7.2. Market Analysis, Insights and Forecast - by Equipment
- 7.2.1. Table
- 7.2.2. Ball
- 7.2.3. Cue
- 7.2.4. Other Equipment
- 7.3. Market Analysis, Insights and Forecast - by Distribution Channel
- 7.3.1. Offline Retail Stores
- 7.3.2. Online Retail Stores
- 7.1. Market Analysis, Insights and Forecast - by Type
- 8. Europe Billiard Pool Industry Analysis, Insights and Forecast, 2020-2032
- 8.1. Market Analysis, Insights and Forecast - by Type
- 8.1.1. Carom
- 8.1.2. Pool
- 8.1.3. Snooker
- 8.2. Market Analysis, Insights and Forecast - by Equipment
- 8.2.1. Table
- 8.2.2. Ball
- 8.2.3. Cue
- 8.2.4. Other Equipment
- 8.3. Market Analysis, Insights and Forecast - by Distribution Channel
- 8.3.1. Offline Retail Stores
- 8.3.2. Online Retail Stores
- 8.1. Market Analysis, Insights and Forecast - by Type
- 9. Asia Pacific Billiard Pool Industry Analysis, Insights and Forecast, 2020-2032
- 9.1. Market Analysis, Insights and Forecast - by Type
- 9.1.1. Carom
- 9.1.2. Pool
- 9.1.3. Snooker
- 9.2. Market Analysis, Insights and Forecast - by Equipment
- 9.2.1. Table
- 9.2.2. Ball
- 9.2.3. Cue
- 9.2.4. Other Equipment
- 9.3. Market Analysis, Insights and Forecast - by Distribution Channel
- 9.3.1. Offline Retail Stores
- 9.3.2. Online Retail Stores
- 9.1. Market Analysis, Insights and Forecast - by Type
- 10. South America Billiard Pool Industry Analysis, Insights and Forecast, 2020-2032
- 10.1. Market Analysis, Insights and Forecast - by Type
- 10.1.1. Carom
- 10.1.2. Pool
- 10.1.3. Snooker
- 10.2. Market Analysis, Insights and Forecast - by Equipment
- 10.2.1. Table
- 10.2.2. Ball
- 10.2.3. Cue
- 10.2.4. Other Equipment
- 10.3. Market Analysis, Insights and Forecast - by Distribution Channel
- 10.3.1. Offline Retail Stores
- 10.3.2. Online Retail Stores
- 10.1. Market Analysis, Insights and Forecast - by Type
- 11. Middle East and Africa Billiard Pool Industry Analysis, Insights and Forecast, 2020-2032
- 11.1. Market Analysis, Insights and Forecast - by Type
- 11.1.1. Carom
- 11.1.2. Pool
- 11.1.3. Snooker
- 11.2. Market Analysis, Insights and Forecast - by Equipment
- 11.2.1. Table
- 11.2.2. Ball
- 11.2.3. Cue
- 11.2.4. Other Equipment
- 11.3. Market Analysis, Insights and Forecast - by Distribution Channel
- 11.3.1. Offline Retail Stores
- 11.3.2. Online Retail Stores
- 11.1. Market Analysis, Insights and Forecast - by Type
- 12. Competitive Analysis
- 12.1. Company Profiles
- 12.1.1 Yalin International Billiard Goods
- 12.1.1.1. Company Overview
- 12.1.1.2. Products
- 12.1.1.3. Company Financials
- 12.1.1.4. SWOT Analysis
- 12.1.2 Berner Biliards*List Not Exhaustive
- 12.1.2.1. Company Overview
- 12.1.2.2. Products
- 12.1.2.3. Company Financials
- 12.1.2.4. SWOT Analysis
- 12.1.3 Snooker & Pool Table Company Ltd
- 12.1.3.1. Company Overview
- 12.1.3.2. Products
- 12.1.3.3. Company Financials
- 12.1.3.4. SWOT Analysis
- 12.1.4 Franklin Billiard Company
- 12.1.4.1. Company Overview
- 12.1.4.2. Products
- 12.1.4.3. Company Financials
- 12.1.4.4. SWOT Analysis
- 12.1.5 Brunswick Corporation
- 12.1.5.1. Company Overview
- 12.1.5.2. Products
- 12.1.5.3. Company Financials
- 12.1.5.4. SWOT Analysis
- 12.1.6 H Betti Industries Inc
- 12.1.6.1. Company Overview
- 12.1.6.2. Products
- 12.1.6.3. Company Financials
- 12.1.6.4. SWOT Analysis
- 12.1.7 Imperial International
- 12.1.7.1. Company Overview
- 12.1.7.2. Products
- 12.1.7.3. Company Financials
- 12.1.7.4. SWOT Analysis
- 12.1.8 Diamond Billiard Products Inc
- 12.1.8.1. Company Overview
- 12.1.8.2. Products
- 12.1.8.3. Company Financials
- 12.1.8.4. SWOT Analysis
- 12.1.9 Kaldera Billiards
- 12.1.9.1. Company Overview
- 12.1.9.2. Products
- 12.1.9.3. Company Financials
- 12.1.9.4. SWOT Analysis
- 12.1.10 Birmingham Billiards Ltd
- 12.1.10.1. Company Overview
- 12.1.10.2. Products
- 12.1.10.3. Company Financials
- 12.1.10.4. SWOT Analysis
- 12.1.1 Yalin International Billiard Goods
- 12.2. Market Entropy
- 12.2.1 Company's Key Areas Served
- 12.2.2 Recent Developments
- 12.3. Company Market Share Analysis 2025
- 12.3.1 Top 5 Companies Market Share Analysis
- 12.3.2 Top 3 Companies Market Share Analysis
- 12.4. List of Potential Customers
- 13. Research Methodology
List of Figures
- Figure 1: Global Billiard Pool Industry Revenue Breakdown (Million, %) by Region 2025 & 2033
- Figure 2: North America Billiard Pool Industry Revenue (Million), by Type 2025 & 2033
- Figure 3: North America Billiard Pool Industry Revenue Share (%), by Type 2025 & 2033
- Figure 4: North America Billiard Pool Industry Revenue (Million), by Equipment 2025 & 2033
- Figure 5: North America Billiard Pool Industry Revenue Share (%), by Equipment 2025 & 2033
- Figure 6: North America Billiard Pool Industry Revenue (Million), by Distribution Channel 2025 & 2033
- Figure 7: North America Billiard Pool Industry Revenue Share (%), by Distribution Channel 2025 & 2033
- Figure 8: North America Billiard Pool Industry Revenue (Million), by Country 2025 & 2033
- Figure 9: North America Billiard Pool Industry Revenue Share (%), by Country 2025 & 2033
- Figure 10: Europe Billiard Pool Industry Revenue (Million), by Type 2025 & 2033
- Figure 11: Europe Billiard Pool Industry Revenue Share (%), by Type 2025 & 2033
- Figure 12: Europe Billiard Pool Industry Revenue (Million), by Equipment 2025 & 2033
- Figure 13: Europe Billiard Pool Industry Revenue Share (%), by Equipment 2025 & 2033
- Figure 14: Europe Billiard Pool Industry Revenue (Million), by Distribution Channel 2025 & 2033
- Figure 15: Europe Billiard Pool Industry Revenue Share (%), by Distribution Channel 2025 & 2033
- Figure 16: Europe Billiard Pool Industry Revenue (Million), by Country 2025 & 2033
- Figure 17: Europe Billiard Pool Industry Revenue Share (%), by Country 2025 & 2033
- Figure 18: Asia Pacific Billiard Pool Industry Revenue (Million), by Type 2025 & 2033
- Figure 19: Asia Pacific Billiard Pool Industry Revenue Share (%), by Type 2025 & 2033
- Figure 20: Asia Pacific Billiard Pool Industry Revenue (Million), by Equipment 2025 & 2033
- Figure 21: Asia Pacific Billiard Pool Industry Revenue Share (%), by Equipment 2025 & 2033
- Figure 22: Asia Pacific Billiard Pool Industry Revenue (Million), by Distribution Channel 2025 & 2033
- Figure 23: Asia Pacific Billiard Pool Industry Revenue Share (%), by Distribution Channel 2025 & 2033
- Figure 24: Asia Pacific Billiard Pool Industry Revenue (Million), by Country 2025 & 2033
- Figure 25: Asia Pacific Billiard Pool Industry Revenue Share (%), by Country 2025 & 2033
- Figure 26: South America Billiard Pool Industry Revenue (Million), by Type 2025 & 2033
- Figure 27: South America Billiard Pool Industry Revenue Share (%), by Type 2025 & 2033
- Figure 28: South America Billiard Pool Industry Revenue (Million), by Equipment 2025 & 2033
- Figure 29: South America Billiard Pool Industry Revenue Share (%), by Equipment 2025 & 2033
- Figure 30: South America Billiard Pool Industry Revenue (Million), by Distribution Channel 2025 & 2033
- Figure 31: South America Billiard Pool Industry Revenue Share (%), by Distribution Channel 2025 & 2033
- Figure 32: South America Billiard Pool Industry Revenue (Million), by Country 2025 & 2033
- Figure 33: South America Billiard Pool Industry Revenue Share (%), by Country 2025 & 2033
- Figure 34: Middle East and Africa Billiard Pool Industry Revenue (Million), by Type 2025 & 2033
- Figure 35: Middle East and Africa Billiard Pool Industry Revenue Share (%), by Type 2025 & 2033
- Figure 36: Middle East and Africa Billiard Pool Industry Revenue (Million), by Equipment 2025 & 2033
- Figure 37: Middle East and Africa Billiard Pool Industry Revenue Share (%), by Equipment 2025 & 2033
- Figure 38: Middle East and Africa Billiard Pool Industry Revenue (Million), by Distribution Channel 2025 & 2033
- Figure 39: Middle East and Africa Billiard Pool Industry Revenue Share (%), by Distribution Channel 2025 & 2033
- Figure 40: Middle East and Africa Billiard Pool Industry Revenue (Million), by Country 2025 & 2033
- Figure 41: Middle East and Africa Billiard Pool Industry Revenue Share (%), by Country 2025 & 2033
List of Tables
- Table 1: Global Billiard Pool Industry Revenue Million Forecast, by Type 2020 & 2033
- Table 2: Global Billiard Pool Industry Revenue Million Forecast, by Equipment 2020 & 2033
- Table 3: Global Billiard Pool Industry Revenue Million Forecast, by Distribution Channel 2020 & 2033
- Table 4: Global Billiard Pool Industry Revenue Million Forecast, by Region 2020 & 2033
- Table 5: Global Billiard Pool Industry Revenue Million Forecast, by Type 2020 & 2033
- Table 6: Global Billiard Pool Industry Revenue Million Forecast, by Equipment 2020 & 2033
- Table 7: Global Billiard Pool Industry Revenue Million Forecast, by Distribution Channel 2020 & 2033
- Table 8: Global Billiard Pool Industry Revenue Million Forecast, by Country 2020 & 2033
- Table 9: United States Billiard Pool Industry Revenue (Million) Forecast, by Application 2020 & 2033
- Table 10: Canada Billiard Pool Industry Revenue (Million) Forecast, by Application 2020 & 2033
- Table 11: Mexico Billiard Pool Industry Revenue (Million) Forecast, by Application 2020 & 2033
- Table 12: Rest of North America Billiard Pool Industry Revenue (Million) Forecast, by Application 2020 & 2033
- Table 13: Global Billiard Pool Industry Revenue Million Forecast, by Type 2020 & 2033
- Table 14: Global Billiard Pool Industry Revenue Million Forecast, by Equipment 2020 & 2033
- Table 15: Global Billiard Pool Industry Revenue Million Forecast, by Distribution Channel 2020 & 2033
- Table 16: Global Billiard Pool Industry Revenue Million Forecast, by Country 2020 & 2033
- Table 17: Spain Billiard Pool Industry Revenue (Million) Forecast, by Application 2020 & 2033
- Table 18: United Kingdom Billiard Pool Industry Revenue (Million) Forecast, by Application 2020 & 2033
- Table 19: Germany Billiard Pool Industry Revenue (Million) Forecast, by Application 2020 & 2033
- Table 20: France Billiard Pool Industry Revenue (Million) Forecast, by Application 2020 & 2033
- Table 21: Italy Billiard Pool Industry Revenue (Million) Forecast, by Application 2020 & 2033
- Table 22: Belgium Billiard Pool Industry Revenue (Million) Forecast, by Application 2020 & 2033
- Table 23: Rest of Europe Billiard Pool Industry Revenue (Million) Forecast, by Application 2020 & 2033
- Table 24: Global Billiard Pool Industry Revenue Million Forecast, by Type 2020 & 2033
- Table 25: Global Billiard Pool Industry Revenue Million Forecast, by Equipment 2020 & 2033
- Table 26: Global Billiard Pool Industry Revenue Million Forecast, by Distribution Channel 2020 & 2033
- Table 27: Global Billiard Pool Industry Revenue Million Forecast, by Country 2020 & 2033
- Table 28: China Billiard Pool Industry Revenue (Million) Forecast, by Application 2020 & 2033
- Table 29: Japan Billiard Pool Industry Revenue (Million) Forecast, by Application 2020 & 2033
- Table 30: India Billiard Pool Industry Revenue (Million) Forecast, by Application 2020 & 2033
- Table 31: Australia Billiard Pool Industry Revenue (Million) Forecast, by Application 2020 & 2033
- Table 32: Rest of Asia Pacific Billiard Pool Industry Revenue (Million) Forecast, by Application 2020 & 2033
- Table 33: Global Billiard Pool Industry Revenue Million Forecast, by Type 2020 & 2033
- Table 34: Global Billiard Pool Industry Revenue Million Forecast, by Equipment 2020 & 2033
- Table 35: Global Billiard Pool Industry Revenue Million Forecast, by Distribution Channel 2020 & 2033
- Table 36: Global Billiard Pool Industry Revenue Million Forecast, by Country 2020 & 2033
- Table 37: Brazil Billiard Pool Industry Revenue (Million) Forecast, by Application 2020 & 2033
- Table 38: Argentina Billiard Pool Industry Revenue (Million) Forecast, by Application 2020 & 2033
- Table 39: Rest of South America Billiard Pool Industry Revenue (Million) Forecast, by Application 2020 & 2033
- Table 40: Global Billiard Pool Industry Revenue Million Forecast, by Type 2020 & 2033
- Table 41: Global Billiard Pool Industry Revenue Million Forecast, by Equipment 2020 & 2033
- Table 42: Global Billiard Pool Industry Revenue Million Forecast, by Distribution Channel 2020 & 2033
- Table 43: Global Billiard Pool Industry Revenue Million Forecast, by Country 2020 & 2033
- Table 44: South Africa Billiard Pool Industry Revenue (Million) Forecast, by Application 2020 & 2033
- Table 45: United Arab Emirates Billiard Pool Industry Revenue (Million) Forecast, by Application 2020 & 2033
- Table 46: Rest of Middle East and Africa Billiard Pool Industry Revenue (Million) Forecast, by Application 2020 & 2033
Frequently Asked Questions
1. What is the projected Compound Annual Growth Rate (CAGR) of the Billiard Pool Industry?
The projected CAGR is approximately 2.93%.
2. Which companies are prominent players in the Billiard Pool Industry?
Key companies in the market include Yalin International Billiard Goods, Berner Biliards*List Not Exhaustive, Snooker & Pool Table Company Ltd, Franklin Billiard Company, Brunswick Corporation, H Betti Industries Inc, Imperial International, Diamond Billiard Products Inc, Kaldera Billiards, Birmingham Billiards Ltd.
3. What are the main segments of the Billiard Pool Industry?
The market segments include Type, Equipment, Distribution Channel.
4. Can you provide details about the market size?
The market size is estimated to be USD 344.06 Million as of 2022.
5. What are some drivers contributing to market growth?
Aggressive Social Media Marketing; Lower-risk Factor Associated with the Use of E-Cigarettes Compared to Conventional/Combustible Cigarettes.
6. What are the notable trends driving market growth?
Increased Sports Participation Propelling the Billiards and Pools Equipment Sales.
7. Are there any restraints impacting market growth?
Government Initiatives to Ban Disposable E-Cigarettes.
8. Can you provide examples of recent developments in the market?
In October 2022, Sawyer Twain launched a new line of Nixon Billiards to the North American market. Featured in the Nixon Billiards line are the Desyn, a mid-century modern table; the prominent Kai table; and the Birdy, a contemporary chic billiards table with a carefully crafted refectory design that stands alone in being the first of its kind with modern tapered rails.
9. What pricing options are available for accessing the report?
Pricing options include single-user, multi-user, and enterprise licenses priced at USD 4750, USD 5250, and USD 8750 respectively.
10. Is the market size provided in terms of value or volume?
The market size is provided in terms of value, measured in Million.
11. Are there any specific market keywords associated with the report?
Yes, the market keyword associated with the report is "Billiard Pool Industry," which aids in identifying and referencing the specific market segment covered.
12. How do I determine which pricing option suits my needs best?
The pricing options vary based on user requirements and access needs. Individual users may opt for single-user licenses, while businesses requiring broader access may choose multi-user or enterprise licenses for cost-effective access to the report.
13. Are there any additional resources or data provided in the Billiard Pool Industry report?
While the report offers comprehensive insights, it's advisable to review the specific contents or supplementary materials provided to ascertain if additional resources or data are available.
14. How can I stay updated on further developments or reports in the Billiard Pool Industry?
To stay informed about further developments, trends, and reports in the Billiard Pool Industry, consider subscribing to industry newsletters, following relevant companies and organizations, or regularly checking reputable industry news sources and publications.
Methodology
Step 1 - Identification of Relevant Samples Size from Population Database


Step 2 - Approaches for Defining Global Market Size (Value, Volume* & Price*)

Note*: In applicable scenarios
Step 3 - Data Sources
Primary Research
- Web Analytics
- Survey Reports
- Research Institute
- Latest Research Reports
- Opinion Leaders
Secondary Research
- Annual Reports
- White Paper
- Latest Press Release
- Industry Association
- Paid Database
- Investor Presentations

Step 4 - Data Triangulation
Involves using different sources of information in order to increase the validity of a study
These sources are likely to be stakeholders in a program - participants, other researchers, program staff, other community members, and so on.
Then we put all data in single framework & apply various statistical tools to find out the dynamic on the market.
During the analysis stage, feedback from the stakeholder groups would be compared to determine areas of agreement as well as areas of divergence