

Key Insights
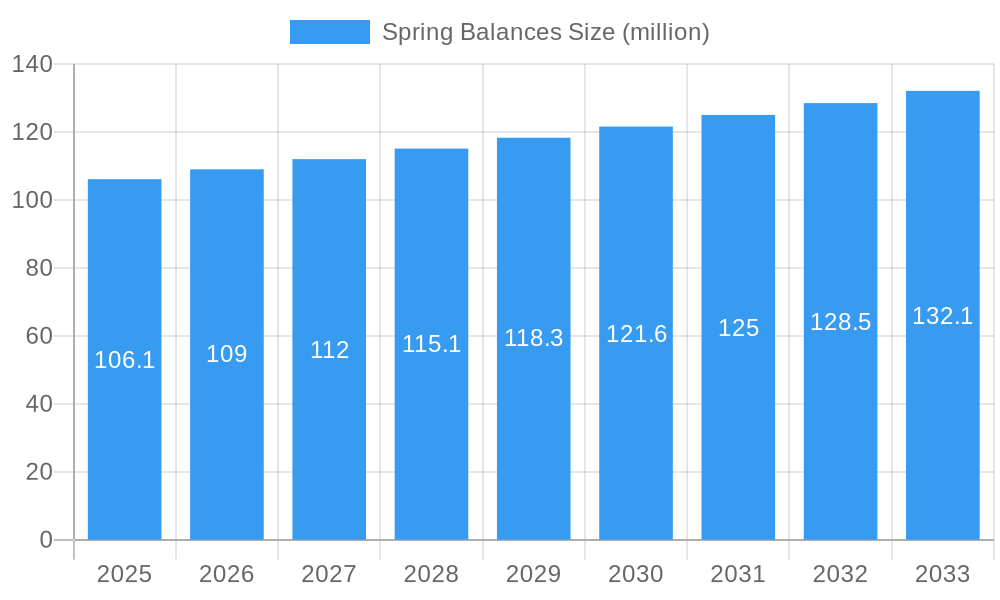
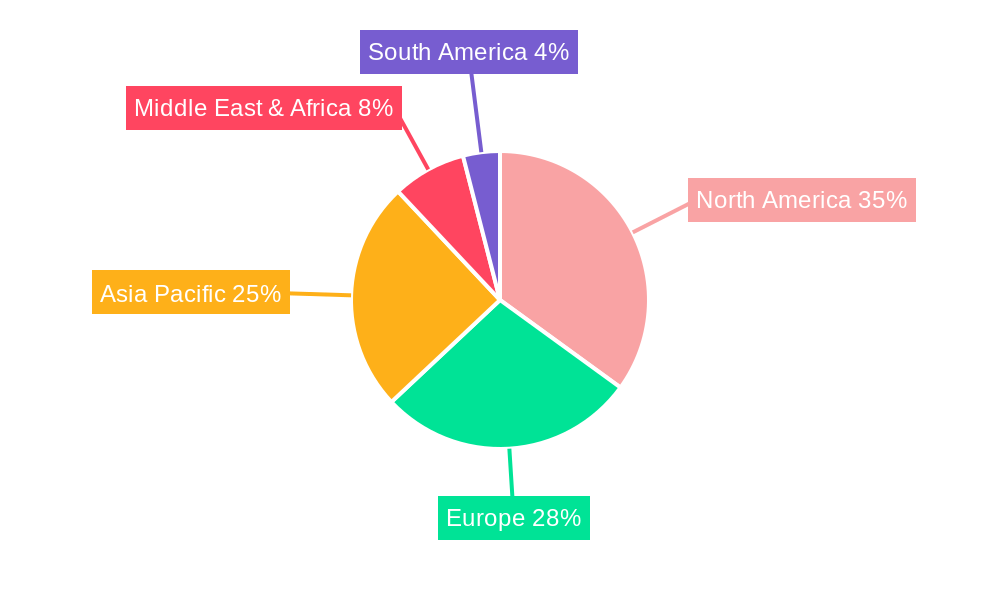
The global spring balance market, valued at $106.1 million in 2025, is projected to experience steady growth, driven by increasing demand across diverse sectors. The Compound Annual Growth Rate (CAGR) of 2.7% from 2025 to 2033 reflects a consistent, albeit moderate, expansion. Key drivers include the rising adoption of spring balances in domestic settings for everyday weighing needs, coupled with continued demand from commercial applications like retail, food processing, and logistics. The market segmentation reveals a significant contribution from digital spring balances, reflecting the ongoing shift towards technologically advanced and precise measurement tools. Mechanical scales, while still holding a share, are gradually being replaced by their digital counterparts due to enhanced accuracy and ease of use. Geographic analysis suggests robust growth in North America and Asia Pacific, driven by industrial expansion and growing consumer spending in these regions. However, price sensitivity in certain emerging markets may pose a restraint, influencing the adoption of higher-priced digital scales. Furthermore, the ongoing development of more sophisticated and integrated weighing solutions, incorporating features such as data logging and connectivity, is expected to shape future market dynamics.
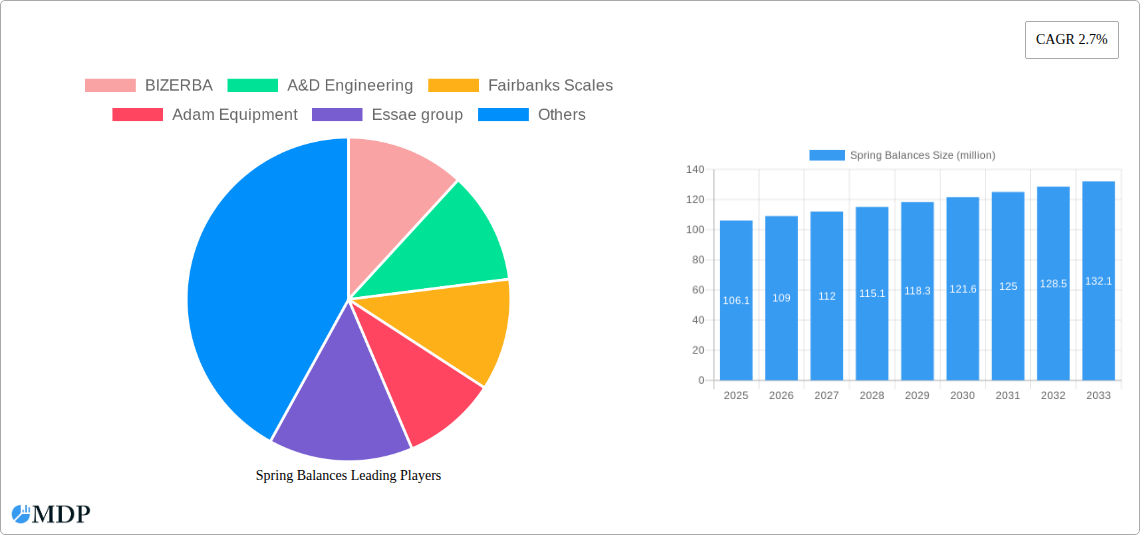
Spring Balances Market Size (In Million)
The competitive landscape is marked by a mix of established players and smaller niche companies. Major players like BIZERBA, A&D Engineering, and Mettler Toledo dominate the market with their extensive product portfolios and global reach. However, smaller regional players cater to specific market needs, leading to a somewhat fragmented market structure. Future growth will likely be influenced by technological advancements, such as improved sensor technology and the integration of smart functionalities. The market will also be influenced by regulatory changes concerning weighing accuracy and safety standards. Companies are likely to focus on product innovation, strategic partnerships, and geographic expansion to capture market share and sustain growth within this evolving landscape.
Spring Balances Company Market Share
Spring Balances Market Report: A Comprehensive Analysis of a $XX Million Industry (2019-2033)
This comprehensive report provides an in-depth analysis of the global spring balances market, projecting a value of $XX million by 2033. It offers invaluable insights for industry stakeholders, investors, and businesses seeking to navigate this dynamic sector. The report covers the period from 2019 to 2033, with a base year of 2025 and a forecast period of 2025-2033. Key players analyzed include BIZERBA, A&D Engineering, Fairbanks Scales, Adam Equipment, Essae group, KERN & SOHN GmbH, Mettler Toledo, Contech Instruments Ltd., Avery Weigh Tronix LLC, Rice Lake Weighing Systems, Cardinal Scale Manufacturing Company, Doran Scales, Inc., Italiana Macchi, KERN & SOHN, Ohaus, TorRey, and Universal Scales. The report segments the market by application (Domestic Scales, Commercial Scales, Other) and type (Mechanical Scales, Digital Scales).
Spring Balances Market Dynamics & Concentration
This section analyzes the competitive landscape of the spring balances market, focusing on market concentration, innovation, regulatory aspects, and market dynamics. The global spring balance market is moderately fragmented, with no single company holding a dominant market share exceeding xx%. However, companies like BIZERBA, Mettler Toledo, and Ohaus hold significant market share due to their established brand reputation, extensive product portfolios, and global reach.
- Market Concentration: The Herfindahl-Hirschman Index (HHI) for the spring balance market is estimated to be xx in 2025, indicating a moderately concentrated market.
- Innovation Drivers: Technological advancements in sensor technology, material science, and miniaturization are driving innovation in spring balances, leading to improved accuracy, durability, and functionality.
- Regulatory Frameworks: Compliance with international weighing standards and regulations significantly impacts market dynamics. Stringent regulations in certain regions may increase production costs but enhance consumer trust.
- Product Substitutes: Digital scales and electronic weighing systems represent significant substitutes for spring balances, particularly in commercial and industrial applications. The market share of digital scales is gradually increasing.
- End-User Trends: The growing demand for accurate and reliable weighing solutions across various sectors like retail, food processing, and healthcare drives the market.
- M&A Activities: The number of mergers and acquisitions in the spring balance industry during the historical period (2019-2024) averaged xx deals per year, primarily driven by strategic expansion and technological integration.
Spring Balances Industry Trends & Analysis
The global spring balances market is expected to witness a Compound Annual Growth Rate (CAGR) of xx% during the forecast period (2025-2033). This growth is propelled by several factors: increasing demand from emerging economies, rising adoption in various industries, and ongoing technological advancements that improve accuracy, durability, and user-friendliness. The market penetration of digital spring balances is increasing steadily, while mechanical spring balances are gradually declining due to the limitations in accuracy and technological advancements. This shift is most pronounced in commercial and industrial sectors. Consumer preferences are shifting towards digital scales due to their ease of use, higher accuracy, and digital interface for data logging and integration. The competitive landscape is characterized by both established players and emerging companies, leading to continuous innovation and price competition.
Leading Markets & Segments in Spring Balances
The Asia-Pacific region is projected to dominate the spring balances market during the forecast period, driven by rapid industrialization, urbanization, and rising disposable incomes in developing economies. Within this region, China and India are expected to be the key growth drivers.
Key Drivers for Dominance:
- Economic Growth: Rapid economic expansion in the Asia-Pacific region has increased demand for weighing solutions in various sectors.
- Infrastructure Development: Investment in infrastructure projects creates demand for construction materials and scales.
Dominance Analysis:
The commercial scales segment holds the largest market share, followed by domestic scales, with the "other" segment representing a smaller niche. Digital scales are experiencing the highest growth rate, surpassing the traditional mechanical spring balances market. The shift from mechanical to digital scales is attributed to the benefits of higher accuracy, digital interfaces, ease of use and data logging capabilities.
Spring Balances Product Developments
Recent product innovations focus on incorporating advanced sensor technologies, improving durability, and integrating digital features. Manufacturers are developing compact, lightweight, and portable spring balances for various applications. The incorporation of digital displays and data logging capabilities is a significant advancement, improving accuracy and user-friendliness. These innovations enhance the competitive advantage of manufacturers by catering to the increasing demand for precise and efficient weighing solutions.
Key Drivers of Spring Balances Growth
The growth of the spring balances market is primarily driven by factors like increasing demand from various industries (food processing, retail, healthcare), advancements in sensor technology improving accuracy and reliability, and growing demand in emerging economies. Favorable government regulations and supportive policies further stimulate market growth.
Challenges in the Spring Balances Market
The spring balance market faces challenges such as intense competition from digital scales, fluctuations in raw material prices impacting manufacturing costs, and stringent regulatory requirements increasing compliance costs. Supply chain disruptions and the increasing adoption of advanced weighing systems also pose a threat to the market growth of traditional spring balances.
Emerging Opportunities in Spring Balances
Emerging opportunities lie in integrating advanced technologies like IoT sensors and cloud connectivity into spring balances. Strategic partnerships and collaborations with technology companies can unlock new market segments and create innovative weighing solutions. Expanding into new markets, particularly in developing economies, presents substantial growth potential.
Leading Players in the Spring Balances Sector
- BIZERBA
- A&D Engineering
- Fairbanks Scales
- Adam Equipment
- Essae group
- KERN & SOHN GmbH
- Mettler Toledo
- Contech Instruments Ltd.
- Avery Weigh Tronix LLC
- Rice Lake Weighing Systems
- Cardinal Scale Manufacturing Company
- Doran Scales, Inc.
- Italiana Macchi
- KERN & SOHN
- Ohaus
- TorRey
- Universal Scales
Key Milestones in Spring Balances Industry
- 2020: Introduction of a new spring balance model with improved accuracy by Ohaus.
- 2022: Mettler Toledo acquires a smaller spring balance manufacturer, expanding its product portfolio.
- 2023: Launch of a smart spring balance with IoT capabilities by a leading manufacturer.
Strategic Outlook for Spring Balances Market
The future of the spring balances market hinges on technological advancements, strategic partnerships, and expansion into new markets. Manufacturers must focus on innovation, developing compact, accurate, and user-friendly products to maintain competitiveness. Collaborations and acquisitions will play a significant role in shaping the market landscape, driving growth and consolidation in the coming years. The market holds immense potential for growth, driven by diverse applications and the increasing demand for reliable weighing solutions across various sectors.
Spring Balances Segmentation
-
1. Application
- 1.1. DomesticScales
- 1.2. Commercial Scales
- 1.3. Other
-
2. Types
- 2.1. Mechanical Scales
- 2.2. Digital Scales
Spring Balances Segmentation By Geography
-
1. North America
- 1.1. United States
- 1.2. Canada
- 1.3. Mexico
-
2. South America
- 2.1. Brazil
- 2.2. Argentina
- 2.3. Rest of South America
-
3. Europe
- 3.1. United Kingdom
- 3.2. Germany
- 3.3. France
- 3.4. Italy
- 3.5. Spain
- 3.6. Russia
- 3.7. Benelux
- 3.8. Nordics
- 3.9. Rest of Europe
-
4. Middle East & Africa
- 4.1. Turkey
- 4.2. Israel
- 4.3. GCC
- 4.4. North Africa
- 4.5. South Africa
- 4.6. Rest of Middle East & Africa
-
5. Asia Pacific
- 5.1. China
- 5.2. India
- 5.3. Japan
- 5.4. South Korea
- 5.5. ASEAN
- 5.6. Oceania
- 5.7. Rest of Asia Pacific
Spring Balances Regional Market Share
Geographic Coverage of Spring Balances
Spring Balances REPORT HIGHLIGHTS
| Aspects | Details |
|---|---|
| Study Period | 2020-2034 |
| Base Year | 2025 |
| Estimated Year | 2026 |
| Forecast Period | 2026-2034 |
| Historical Period | 2020-2025 |
| Growth Rate | CAGR of 2.7% from 2020-2034 |
| Segmentation |
|
Table of Contents
- 1. Introduction
- 1.1. Research Scope
- 1.2. Market Segmentation
- 1.3. Research Methodology
- 1.4. Definitions and Assumptions
- 2. Executive Summary
- 2.1. Introduction
- 3. Market Dynamics
- 3.1. Introduction
- 3.2. Market Drivers
- 3.3. Market Restrains
- 3.4. Market Trends
- 4. Market Factor Analysis
- 4.1. Porters Five Forces
- 4.2. Supply/Value Chain
- 4.3. PESTEL analysis
- 4.4. Market Entropy
- 4.5. Patent/Trademark Analysis
- 5. Global Spring Balances Analysis, Insights and Forecast, 2020-2032
- 5.1. Market Analysis, Insights and Forecast - by Application
- 5.1.1. DomesticScales
- 5.1.2. Commercial Scales
- 5.1.3. Other
- 5.2. Market Analysis, Insights and Forecast - by Types
- 5.2.1. Mechanical Scales
- 5.2.2. Digital Scales
- 5.3. Market Analysis, Insights and Forecast - by Region
- 5.3.1. North America
- 5.3.2. South America
- 5.3.3. Europe
- 5.3.4. Middle East & Africa
- 5.3.5. Asia Pacific
- 5.1. Market Analysis, Insights and Forecast - by Application
- 6. North America Spring Balances Analysis, Insights and Forecast, 2020-2032
- 6.1. Market Analysis, Insights and Forecast - by Application
- 6.1.1. DomesticScales
- 6.1.2. Commercial Scales
- 6.1.3. Other
- 6.2. Market Analysis, Insights and Forecast - by Types
- 6.2.1. Mechanical Scales
- 6.2.2. Digital Scales
- 6.1. Market Analysis, Insights and Forecast - by Application
- 7. South America Spring Balances Analysis, Insights and Forecast, 2020-2032
- 7.1. Market Analysis, Insights and Forecast - by Application
- 7.1.1. DomesticScales
- 7.1.2. Commercial Scales
- 7.1.3. Other
- 7.2. Market Analysis, Insights and Forecast - by Types
- 7.2.1. Mechanical Scales
- 7.2.2. Digital Scales
- 7.1. Market Analysis, Insights and Forecast - by Application
- 8. Europe Spring Balances Analysis, Insights and Forecast, 2020-2032
- 8.1. Market Analysis, Insights and Forecast - by Application
- 8.1.1. DomesticScales
- 8.1.2. Commercial Scales
- 8.1.3. Other
- 8.2. Market Analysis, Insights and Forecast - by Types
- 8.2.1. Mechanical Scales
- 8.2.2. Digital Scales
- 8.1. Market Analysis, Insights and Forecast - by Application
- 9. Middle East & Africa Spring Balances Analysis, Insights and Forecast, 2020-2032
- 9.1. Market Analysis, Insights and Forecast - by Application
- 9.1.1. DomesticScales
- 9.1.2. Commercial Scales
- 9.1.3. Other
- 9.2. Market Analysis, Insights and Forecast - by Types
- 9.2.1. Mechanical Scales
- 9.2.2. Digital Scales
- 9.1. Market Analysis, Insights and Forecast - by Application
- 10. Asia Pacific Spring Balances Analysis, Insights and Forecast, 2020-2032
- 10.1. Market Analysis, Insights and Forecast - by Application
- 10.1.1. DomesticScales
- 10.1.2. Commercial Scales
- 10.1.3. Other
- 10.2. Market Analysis, Insights and Forecast - by Types
- 10.2.1. Mechanical Scales
- 10.2.2. Digital Scales
- 10.1. Market Analysis, Insights and Forecast - by Application
- 11. Competitive Analysis
- 11.1. Global Market Share Analysis 2025
- 11.2. Company Profiles
- 11.2.1 BIZERBA
- 11.2.1.1. Overview
- 11.2.1.2. Products
- 11.2.1.3. SWOT Analysis
- 11.2.1.4. Recent Developments
- 11.2.1.5. Financials (Based on Availability)
- 11.2.2 A&D Engineering
- 11.2.2.1. Overview
- 11.2.2.2. Products
- 11.2.2.3. SWOT Analysis
- 11.2.2.4. Recent Developments
- 11.2.2.5. Financials (Based on Availability)
- 11.2.3 Fairbanks Scales
- 11.2.3.1. Overview
- 11.2.3.2. Products
- 11.2.3.3. SWOT Analysis
- 11.2.3.4. Recent Developments
- 11.2.3.5. Financials (Based on Availability)
- 11.2.4 Adam Equipment
- 11.2.4.1. Overview
- 11.2.4.2. Products
- 11.2.4.3. SWOT Analysis
- 11.2.4.4. Recent Developments
- 11.2.4.5. Financials (Based on Availability)
- 11.2.5 Essae group
- 11.2.5.1. Overview
- 11.2.5.2. Products
- 11.2.5.3. SWOT Analysis
- 11.2.5.4. Recent Developments
- 11.2.5.5. Financials (Based on Availability)
- 11.2.6 KERN & SOHN GmbH
- 11.2.6.1. Overview
- 11.2.6.2. Products
- 11.2.6.3. SWOT Analysis
- 11.2.6.4. Recent Developments
- 11.2.6.5. Financials (Based on Availability)
- 11.2.7 Mettler Toredo
- 11.2.7.1. Overview
- 11.2.7.2. Products
- 11.2.7.3. SWOT Analysis
- 11.2.7.4. Recent Developments
- 11.2.7.5. Financials (Based on Availability)
- 11.2.8 Contech Instruments Ltd.
- 11.2.8.1. Overview
- 11.2.8.2. Products
- 11.2.8.3. SWOT Analysis
- 11.2.8.4. Recent Developments
- 11.2.8.5. Financials (Based on Availability)
- 11.2.9 Avery Weigh Tronix LLC
- 11.2.9.1. Overview
- 11.2.9.2. Products
- 11.2.9.3. SWOT Analysis
- 11.2.9.4. Recent Developments
- 11.2.9.5. Financials (Based on Availability)
- 11.2.10 Rice Lake Weighing Systems
- 11.2.10.1. Overview
- 11.2.10.2. Products
- 11.2.10.3. SWOT Analysis
- 11.2.10.4. Recent Developments
- 11.2.10.5. Financials (Based on Availability)
- 11.2.11 Cardinal Scale Manufacturing Company
- 11.2.11.1. Overview
- 11.2.11.2. Products
- 11.2.11.3. SWOT Analysis
- 11.2.11.4. Recent Developments
- 11.2.11.5. Financials (Based on Availability)
- 11.2.12 Doran Scales
- 11.2.12.1. Overview
- 11.2.12.2. Products
- 11.2.12.3. SWOT Analysis
- 11.2.12.4. Recent Developments
- 11.2.12.5. Financials (Based on Availability)
- 11.2.13 Inc.
- 11.2.13.1. Overview
- 11.2.13.2. Products
- 11.2.13.3. SWOT Analysis
- 11.2.13.4. Recent Developments
- 11.2.13.5. Financials (Based on Availability)
- 11.2.14 Italiana Macchi
- 11.2.14.1. Overview
- 11.2.14.2. Products
- 11.2.14.3. SWOT Analysis
- 11.2.14.4. Recent Developments
- 11.2.14.5. Financials (Based on Availability)
- 11.2.15 KERN & SOHN
- 11.2.15.1. Overview
- 11.2.15.2. Products
- 11.2.15.3. SWOT Analysis
- 11.2.15.4. Recent Developments
- 11.2.15.5. Financials (Based on Availability)
- 11.2.16 Ohaus
- 11.2.16.1. Overview
- 11.2.16.2. Products
- 11.2.16.3. SWOT Analysis
- 11.2.16.4. Recent Developments
- 11.2.16.5. Financials (Based on Availability)
- 11.2.17 TorRey
- 11.2.17.1. Overview
- 11.2.17.2. Products
- 11.2.17.3. SWOT Analysis
- 11.2.17.4. Recent Developments
- 11.2.17.5. Financials (Based on Availability)
- 11.2.18 Universal Scales
- 11.2.18.1. Overview
- 11.2.18.2. Products
- 11.2.18.3. SWOT Analysis
- 11.2.18.4. Recent Developments
- 11.2.18.5. Financials (Based on Availability)
- 11.2.1 BIZERBA
List of Figures
- Figure 1: Global Spring Balances Revenue Breakdown (million, %) by Region 2025 & 2033
- Figure 2: North America Spring Balances Revenue (million), by Application 2025 & 2033
- Figure 3: North America Spring Balances Revenue Share (%), by Application 2025 & 2033
- Figure 4: North America Spring Balances Revenue (million), by Types 2025 & 2033
- Figure 5: North America Spring Balances Revenue Share (%), by Types 2025 & 2033
- Figure 6: North America Spring Balances Revenue (million), by Country 2025 & 2033
- Figure 7: North America Spring Balances Revenue Share (%), by Country 2025 & 2033
- Figure 8: South America Spring Balances Revenue (million), by Application 2025 & 2033
- Figure 9: South America Spring Balances Revenue Share (%), by Application 2025 & 2033
- Figure 10: South America Spring Balances Revenue (million), by Types 2025 & 2033
- Figure 11: South America Spring Balances Revenue Share (%), by Types 2025 & 2033
- Figure 12: South America Spring Balances Revenue (million), by Country 2025 & 2033
- Figure 13: South America Spring Balances Revenue Share (%), by Country 2025 & 2033
- Figure 14: Europe Spring Balances Revenue (million), by Application 2025 & 2033
- Figure 15: Europe Spring Balances Revenue Share (%), by Application 2025 & 2033
- Figure 16: Europe Spring Balances Revenue (million), by Types 2025 & 2033
- Figure 17: Europe Spring Balances Revenue Share (%), by Types 2025 & 2033
- Figure 18: Europe Spring Balances Revenue (million), by Country 2025 & 2033
- Figure 19: Europe Spring Balances Revenue Share (%), by Country 2025 & 2033
- Figure 20: Middle East & Africa Spring Balances Revenue (million), by Application 2025 & 2033
- Figure 21: Middle East & Africa Spring Balances Revenue Share (%), by Application 2025 & 2033
- Figure 22: Middle East & Africa Spring Balances Revenue (million), by Types 2025 & 2033
- Figure 23: Middle East & Africa Spring Balances Revenue Share (%), by Types 2025 & 2033
- Figure 24: Middle East & Africa Spring Balances Revenue (million), by Country 2025 & 2033
- Figure 25: Middle East & Africa Spring Balances Revenue Share (%), by Country 2025 & 2033
- Figure 26: Asia Pacific Spring Balances Revenue (million), by Application 2025 & 2033
- Figure 27: Asia Pacific Spring Balances Revenue Share (%), by Application 2025 & 2033
- Figure 28: Asia Pacific Spring Balances Revenue (million), by Types 2025 & 2033
- Figure 29: Asia Pacific Spring Balances Revenue Share (%), by Types 2025 & 2033
- Figure 30: Asia Pacific Spring Balances Revenue (million), by Country 2025 & 2033
- Figure 31: Asia Pacific Spring Balances Revenue Share (%), by Country 2025 & 2033
List of Tables
- Table 1: Global Spring Balances Revenue million Forecast, by Application 2020 & 2033
- Table 2: Global Spring Balances Revenue million Forecast, by Types 2020 & 2033
- Table 3: Global Spring Balances Revenue million Forecast, by Region 2020 & 2033
- Table 4: Global Spring Balances Revenue million Forecast, by Application 2020 & 2033
- Table 5: Global Spring Balances Revenue million Forecast, by Types 2020 & 2033
- Table 6: Global Spring Balances Revenue million Forecast, by Country 2020 & 2033
- Table 7: United States Spring Balances Revenue (million) Forecast, by Application 2020 & 2033
- Table 8: Canada Spring Balances Revenue (million) Forecast, by Application 2020 & 2033
- Table 9: Mexico Spring Balances Revenue (million) Forecast, by Application 2020 & 2033
- Table 10: Global Spring Balances Revenue million Forecast, by Application 2020 & 2033
- Table 11: Global Spring Balances Revenue million Forecast, by Types 2020 & 2033
- Table 12: Global Spring Balances Revenue million Forecast, by Country 2020 & 2033
- Table 13: Brazil Spring Balances Revenue (million) Forecast, by Application 2020 & 2033
- Table 14: Argentina Spring Balances Revenue (million) Forecast, by Application 2020 & 2033
- Table 15: Rest of South America Spring Balances Revenue (million) Forecast, by Application 2020 & 2033
- Table 16: Global Spring Balances Revenue million Forecast, by Application 2020 & 2033
- Table 17: Global Spring Balances Revenue million Forecast, by Types 2020 & 2033
- Table 18: Global Spring Balances Revenue million Forecast, by Country 2020 & 2033
- Table 19: United Kingdom Spring Balances Revenue (million) Forecast, by Application 2020 & 2033
- Table 20: Germany Spring Balances Revenue (million) Forecast, by Application 2020 & 2033
- Table 21: France Spring Balances Revenue (million) Forecast, by Application 2020 & 2033
- Table 22: Italy Spring Balances Revenue (million) Forecast, by Application 2020 & 2033
- Table 23: Spain Spring Balances Revenue (million) Forecast, by Application 2020 & 2033
- Table 24: Russia Spring Balances Revenue (million) Forecast, by Application 2020 & 2033
- Table 25: Benelux Spring Balances Revenue (million) Forecast, by Application 2020 & 2033
- Table 26: Nordics Spring Balances Revenue (million) Forecast, by Application 2020 & 2033
- Table 27: Rest of Europe Spring Balances Revenue (million) Forecast, by Application 2020 & 2033
- Table 28: Global Spring Balances Revenue million Forecast, by Application 2020 & 2033
- Table 29: Global Spring Balances Revenue million Forecast, by Types 2020 & 2033
- Table 30: Global Spring Balances Revenue million Forecast, by Country 2020 & 2033
- Table 31: Turkey Spring Balances Revenue (million) Forecast, by Application 2020 & 2033
- Table 32: Israel Spring Balances Revenue (million) Forecast, by Application 2020 & 2033
- Table 33: GCC Spring Balances Revenue (million) Forecast, by Application 2020 & 2033
- Table 34: North Africa Spring Balances Revenue (million) Forecast, by Application 2020 & 2033
- Table 35: South Africa Spring Balances Revenue (million) Forecast, by Application 2020 & 2033
- Table 36: Rest of Middle East & Africa Spring Balances Revenue (million) Forecast, by Application 2020 & 2033
- Table 37: Global Spring Balances Revenue million Forecast, by Application 2020 & 2033
- Table 38: Global Spring Balances Revenue million Forecast, by Types 2020 & 2033
- Table 39: Global Spring Balances Revenue million Forecast, by Country 2020 & 2033
- Table 40: China Spring Balances Revenue (million) Forecast, by Application 2020 & 2033
- Table 41: India Spring Balances Revenue (million) Forecast, by Application 2020 & 2033
- Table 42: Japan Spring Balances Revenue (million) Forecast, by Application 2020 & 2033
- Table 43: South Korea Spring Balances Revenue (million) Forecast, by Application 2020 & 2033
- Table 44: ASEAN Spring Balances Revenue (million) Forecast, by Application 2020 & 2033
- Table 45: Oceania Spring Balances Revenue (million) Forecast, by Application 2020 & 2033
- Table 46: Rest of Asia Pacific Spring Balances Revenue (million) Forecast, by Application 2020 & 2033
Frequently Asked Questions
1. What is the projected Compound Annual Growth Rate (CAGR) of the Spring Balances?
The projected CAGR is approximately 2.7%.
2. Which companies are prominent players in the Spring Balances?
Key companies in the market include BIZERBA, A&D Engineering, Fairbanks Scales, Adam Equipment, Essae group, KERN & SOHN GmbH, Mettler Toredo, Contech Instruments Ltd., Avery Weigh Tronix LLC, Rice Lake Weighing Systems, Cardinal Scale Manufacturing Company, Doran Scales, Inc., Italiana Macchi, KERN & SOHN, Ohaus, TorRey, Universal Scales.
3. What are the main segments of the Spring Balances?
The market segments include Application, Types.
4. Can you provide details about the market size?
The market size is estimated to be USD 106.1 million as of 2022.
5. What are some drivers contributing to market growth?
N/A
6. What are the notable trends driving market growth?
N/A
7. Are there any restraints impacting market growth?
N/A
8. Can you provide examples of recent developments in the market?
N/A
9. What pricing options are available for accessing the report?
Pricing options include single-user, multi-user, and enterprise licenses priced at USD 2900.00, USD 4350.00, and USD 5800.00 respectively.
10. Is the market size provided in terms of value or volume?
The market size is provided in terms of value, measured in million.
11. Are there any specific market keywords associated with the report?
Yes, the market keyword associated with the report is "Spring Balances," which aids in identifying and referencing the specific market segment covered.
12. How do I determine which pricing option suits my needs best?
The pricing options vary based on user requirements and access needs. Individual users may opt for single-user licenses, while businesses requiring broader access may choose multi-user or enterprise licenses for cost-effective access to the report.
13. Are there any additional resources or data provided in the Spring Balances report?
While the report offers comprehensive insights, it's advisable to review the specific contents or supplementary materials provided to ascertain if additional resources or data are available.
14. How can I stay updated on further developments or reports in the Spring Balances?
To stay informed about further developments, trends, and reports in the Spring Balances, consider subscribing to industry newsletters, following relevant companies and organizations, or regularly checking reputable industry news sources and publications.
Methodology
Step 1 - Identification of Relevant Samples Size from Population Database


Step 2 - Approaches for Defining Global Market Size (Value, Volume* & Price*)

Note*: In applicable scenarios
Step 3 - Data Sources
Primary Research
- Web Analytics
- Survey Reports
- Research Institute
- Latest Research Reports
- Opinion Leaders
Secondary Research
- Annual Reports
- White Paper
- Latest Press Release
- Industry Association
- Paid Database
- Investor Presentations

Step 4 - Data Triangulation
Involves using different sources of information in order to increase the validity of a study
These sources are likely to be stakeholders in a program - participants, other researchers, program staff, other community members, and so on.
Then we put all data in single framework & apply various statistical tools to find out the dynamic on the market.
During the analysis stage, feedback from the stakeholder groups would be compared to determine areas of agreement as well as areas of divergence