

Key Insights
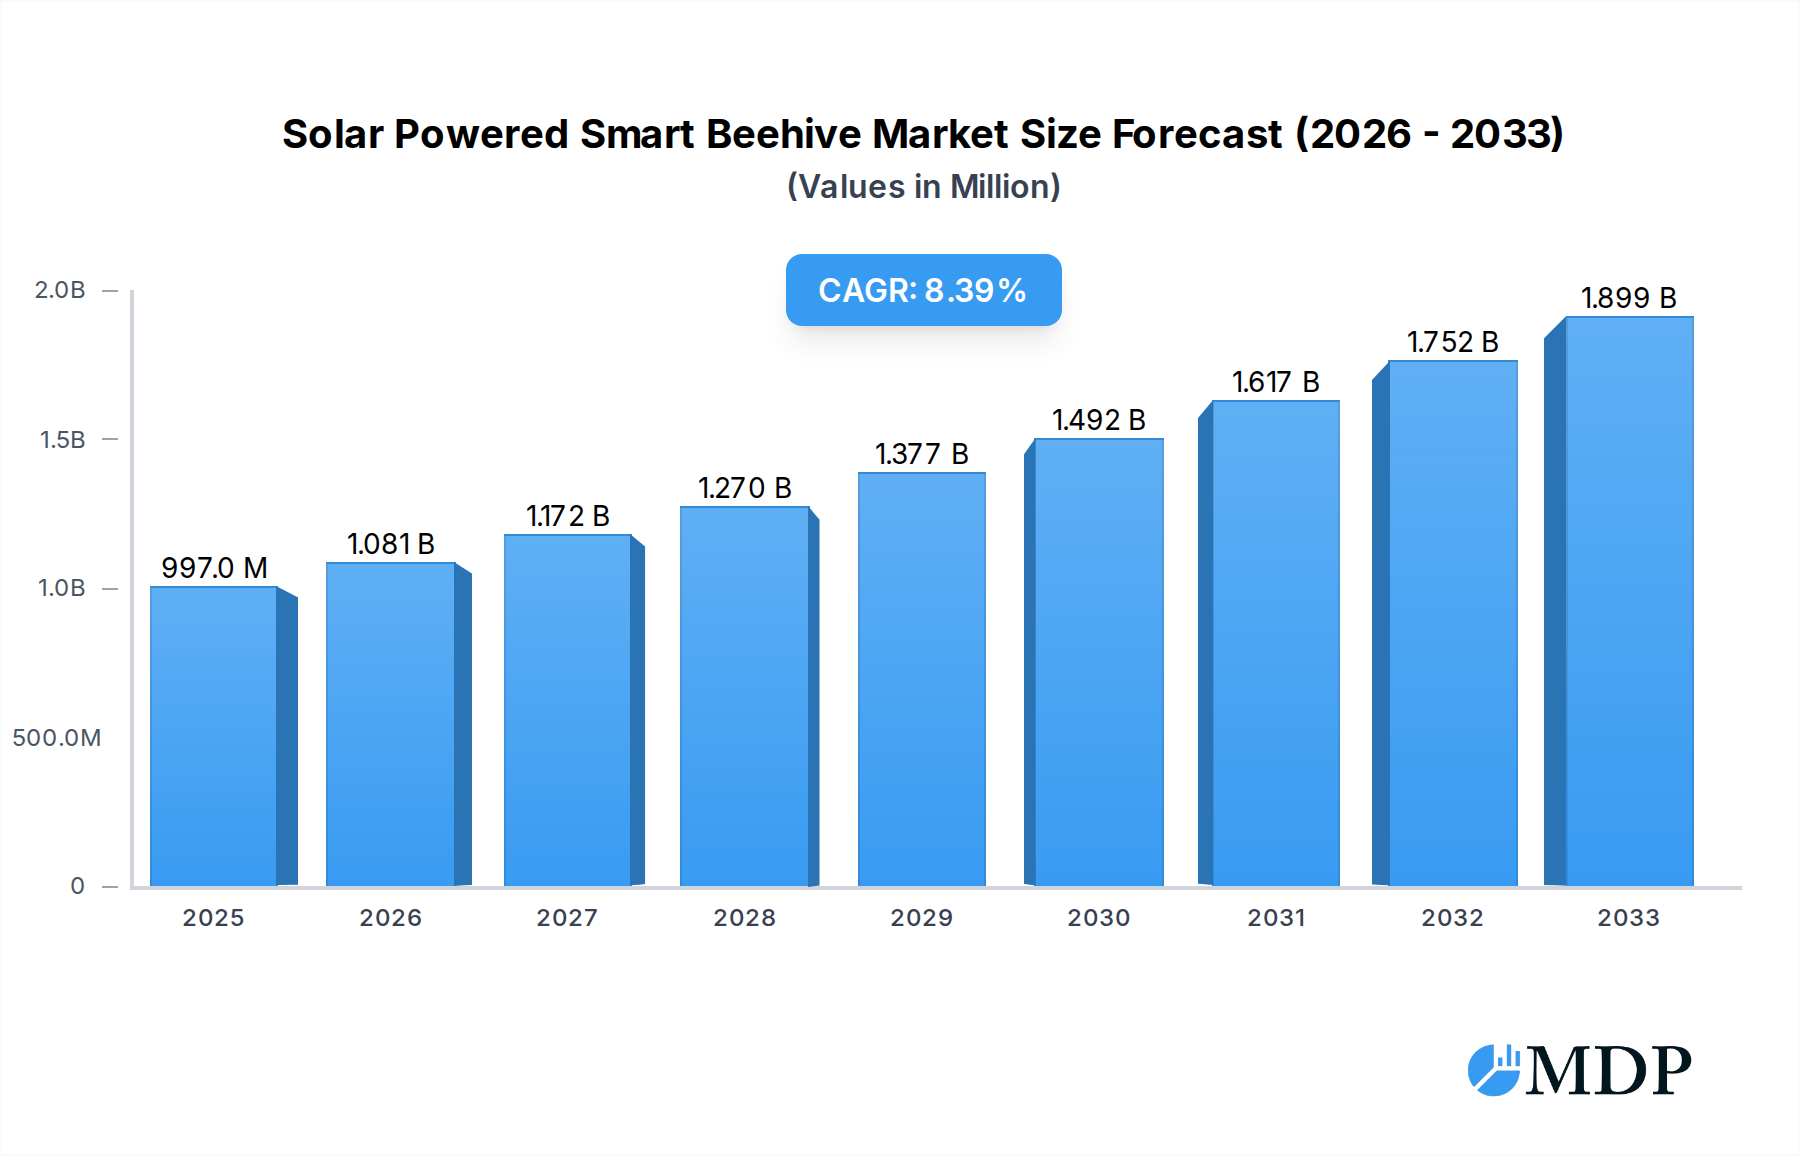
The global Solar Powered Smart Beehive market is projected to experience robust growth, reaching an estimated $997 million by 2025. This expansion is fueled by an impressive Compound Annual Growth Rate (CAGR) of 8.6%, indicating a significant and sustained increase in market value. The adoption of smart beehives, particularly those powered by solar energy, is driven by the increasing need for enhanced beekeeping efficiency, improved colony health monitoring, and proactive disease management. The agriculture sector represents a primary application, where these intelligent hives contribute to better crop pollination and yield optimization. Furthermore, scientific research benefits immensely from the granular data provided by smart beehives, enabling deeper understanding of bee behavior and environmental impacts. The market is segmented into independent and cluster smart beehive types, with independent units offering flexibility and cluster solutions providing scalability for larger operations. Key players like Beewise, ApisProtect, and BeeHero are at the forefront, innovating with advanced sensor technologies, data analytics, and remote monitoring capabilities.

Solar Powered Smart Beehive Market Size (In Million)
The market's upward trajectory is further supported by several key trends, including the integration of AI and machine learning for predictive analysis of hive health, the development of IoT-enabled sensors for real-time data collection on temperature, humidity, and bee activity, and the increasing awareness of the crucial role of pollinators in food security. Regional analysis indicates that North America, particularly the United States and Canada, holds a substantial market share due to advanced agricultural practices and a strong focus on technological integration. Europe, with its commitment to sustainable farming and stringent regulations on pesticide use, also presents significant opportunities. Asia Pacific, led by China and India, is emerging as a high-growth region, driven by a burgeoning agricultural sector and increasing investment in smart farming technologies. Restraints, such as the initial cost of smart beehive systems and the need for technical expertise among beekeepers, are gradually being addressed through technological advancements and increased market penetration, paving the way for continued expansion.
Solar Powered Smart Beehive Company Market Share
Solar Powered Smart Beehive Market: A Comprehensive Analysis (2019–2033)
This in-depth report delves into the dynamic and rapidly evolving solar powered smart beehive market. With a study period spanning from 2019 to 2033, and a base year of 2025, this analysis provides unparalleled insights into the forces shaping this critical industry. We forecast significant growth from 2025 to 2033, building upon historical data from 2019 to 2024. This report is essential for understanding the technological advancements, market penetration, and strategic imperatives for stakeholders in smart beekeeping technology, IoT in agriculture, and sustainable apiary management.
Solar Powered Smart Beehive Market Dynamics & Concentration
The solar powered smart beehive market is characterized by a moderate concentration of key players, with Beewise and BeeHero holding substantial market shares, estimated at around 18% and 15% respectively. Innovation drivers are primarily centered around enhanced sensor technology for real-time hive monitoring, predictive analytics for disease detection, and improved energy efficiency of solar power systems. Regulatory frameworks are gradually evolving, with a growing emphasis on sustainable agriculture practices and data privacy for beekeepers. Product substitutes, such as traditional beekeeping methods and non-solar powered smart beehives, are present but are increasingly being overshadowed by the convenience and data-driven insights offered by solar-powered solutions. End-user trends reveal a growing adoption by commercial beekeepers seeking to optimize hive health and honey production, alongside an increasing interest from scientific research institutions for invaluable data collection on bee populations. Mergers and acquisitions (M&A) activities are on the rise, with an estimated count of 7 major deals in the historical period (2019-2024), indicating consolidation and strategic expansion. Hive Haven and ApisProtect have been active participants in recent M&A discussions, reflecting the competitive landscape and the pursuit of synergistic growth. The overall market is witnessing a transition towards data-centric beekeeping, driven by the inherent benefits of solar powered intelligent systems.
Solar Powered Smart Beehive Industry Trends & Analysis
The solar powered smart beehive market is poised for robust expansion, driven by a projected Compound Annual Growth Rate (CAGR) of approximately 22% during the forecast period (2025–2033). This significant growth is fueled by a confluence of technological advancements and increasing global awareness of the crucial role of bees in pollination and food security. Technological disruptions are at the forefront, with continuous innovations in sensor miniaturization, AI-powered data analytics for early disease detection, and refined solar energy harvesting and storage solutions. These advancements are leading to more sophisticated and cost-effective smart beehive solutions. Consumer preferences are shifting towards data-driven insights and automation, enabling beekeepers to remotely monitor hive health, temperature, humidity, and bee activity without constant physical intervention. This trend is particularly pronounced in the agriculture segment, where optimized pollination directly impacts crop yields, making smart beehives a valuable tool for farmers. Competitive dynamics are intensifying, with established players investing heavily in R&D to differentiate their offerings. Companies are focusing on developing user-friendly interfaces, comprehensive data reporting, and robust integration capabilities with existing farm management systems. Market penetration is expected to accelerate as the economic benefits of increased honey production, reduced hive losses, and improved pollination services become more widely recognized. Furthermore, the growing demand for sustainable and eco-friendly farming practices is a significant catalyst, positioning solar powered smart beehives as an environmentally conscious choice. The integration of the Internet of Things (IoT) into apiculture is transforming traditional beekeeping into a technologically advanced and data-intensive practice. The market penetration is estimated to reach around 35% by 2033, a substantial increase from an estimated 12% in the base year of 2025.
Leading Markets & Segments in Solar Powered Smart Beehive
The agriculture application segment is the undisputed leader in the solar powered smart beehive market, driven by its direct impact on crop yields and the increasing adoption of precision agriculture techniques. Within this segment, the independent smart beehive type is currently dominating, accounting for an estimated 65% of market share. This dominance is attributed to its flexibility and suitability for a wide range of farm sizes and operational complexities.
- Dominance in Agriculture: The economic policies promoting sustainable farming and the direct correlation between effective pollination and increased agricultural output are key drivers for the agriculture segment. Governments worldwide are incentivizing beekeeping initiatives, further boosting demand for smart beehive solutions that enhance productivity and sustainability. The estimated market size for agriculture applications is projected to reach over $800 million by 2033.
- Independent Smart Beehive Dominance: The ease of deployment, scalability, and individual hive management capabilities make independent smart beehives the preferred choice for many agricultural operations. Their modular design allows for customization to specific needs, from small family farms to large commercial agricultural enterprises.
- Scientific Research Segment Growth: The scientific research segment, while smaller, is exhibiting significant growth. This is driven by the urgent need to understand bee health, colony collapse disorder, and the impact of environmental factors on bee populations. Smart beehives provide invaluable, granular data for researchers, contributing to a deeper understanding of these critical ecological issues. The market for scientific research is expected to grow at a CAGR of approximately 25%, reaching an estimated $250 million by 2033.
- Emerging Other Applications: The others application segment, encompassing applications beyond direct agriculture and pure research, is also showing promising growth. This includes areas like urban beekeeping, educational initiatives, and even specialized applications for pest control monitoring.
Solar Powered Smart Beehive Product Developments
Recent product developments in the solar powered smart beehive market are focused on enhancing real-time data analytics and improving the energy efficiency of the solar power systems. Innovations include advanced acoustic sensors for detecting subtle changes in bee behavior indicative of stress or disease, and AI algorithms capable of predicting swarm events and potential colony loss with high accuracy. Companies are also integrating machine learning models to provide personalized beekeeping advice based on hive-specific data. Competitive advantages are being derived from longer battery life, robust weatherproofing for all-season operation, and seamless connectivity through multiple communication protocols. The market is witnessing a trend towards more integrated solutions that offer not just monitoring but also automated climate control and feeding mechanisms, further reducing the manual labor required for beekeeping.
Key Drivers of Solar Powered Smart Beehive Growth
The growth of the solar powered smart beehive market is primarily propelled by several key factors. Firstly, the escalating global demand for honey and pollination-dependent crops necessitates efficient and sustainable beekeeping practices, making smart beehives indispensable. Secondly, rapid advancements in IoT technology, sensor miniaturization, and data analytics are continuously enhancing the capabilities and affordability of these solutions. Thirdly, increasing government initiatives and subsidies promoting sustainable agriculture and beekeeping are creating a favorable market environment. Finally, a growing awareness among beekeepers regarding the economic benefits of reduced hive losses and increased honey yields through precise monitoring and intervention is a significant driver.
Challenges in the Solar Powered Smart Beehive Market
Despite the promising growth, the solar powered smart beehive market faces several challenges. Regulatory hurdles related to data privacy and standardized reporting protocols can slow down adoption. Supply chain disruptions for electronic components and the fluctuating cost of raw materials can impact production and pricing. Moreover, the initial investment cost for smart beehive systems can be a barrier for smaller beekeepers, despite the long-term economic benefits. Competitive pressures from existing traditional beekeeping methods and the need for extensive technical training for some users also pose challenges to market penetration.
Emerging Opportunities in Solar Powered Smart Beehive
Emerging opportunities in the solar powered smart beehive market are diverse and significant. Technological breakthroughs in AI and machine learning are enabling more sophisticated predictive analytics for disease prevention and swarm management, offering unprecedented levels of hive control. Strategic partnerships between technology providers and agricultural cooperatives are crucial for expanding market reach and providing tailored solutions to diverse farming needs. Furthermore, the expanding market for sustainable and traceable food products presents a significant opportunity for smart beehive data to authenticate the origin and quality of honey. Exploring niche markets such as urban beekeeping and scientific research grants for bee health studies will unlock further growth avenues.
Leading Players in the Solar Powered Smart Beehive Sector
- Beewise
- ApisProtect
- BeeHero
- HiveTracks
- BeeScanning
- Hive Haven
- SmartHive
- Apiterra
- HiveMind
Key Milestones in Solar Powered Smart Beehive Industry
- 2019: Introduction of advanced sensor arrays for detailed hive environment monitoring.
- 2020: Development of AI-powered algorithms for early disease detection in bee colonies.
- 2021: Increased adoption of IoT connectivity for remote hive management by commercial beekeepers.
- 2022: Launch of enhanced solar power management systems for extended operational life.
- 2023: Strategic partnerships formed between technology companies and agricultural research institutions.
- 2024: Significant investment rounds for key players to scale production and R&D.
Strategic Outlook for Solar Powered Smart Beehive Market
The strategic outlook for the solar powered smart beehive market is exceptionally positive, driven by an increasing global reliance on bees for pollination and food security. Future growth accelerators will include the development of more integrated and automated hive management systems, leveraging advancements in robotics and AI. The market will witness further consolidation through M&A activities, leading to more comprehensive solution offerings. Expansion into emerging economies and a focus on providing accessible, data-driven solutions for smallholder farmers will be critical for sustained growth. The increasing demand for transparency and sustainability in the food supply chain will further solidify the position of solar powered smart beehives as a vital tool for modern beekeeping.
Solar Powered Smart Beehive Segmentation
-
1. Application
- 1.1. Agriculture
- 1.2. Scientific Research
- 1.3. Others
-
2. Type
- 2.1. Independent Smart Beehive
- 2.2. Cluster Smart Beehive
Solar Powered Smart Beehive Segmentation By Geography
-
1. North America
- 1.1. United States
- 1.2. Canada
- 1.3. Mexico
-
2. South America
- 2.1. Brazil
- 2.2. Argentina
- 2.3. Rest of South America
-
3. Europe
- 3.1. United Kingdom
- 3.2. Germany
- 3.3. France
- 3.4. Italy
- 3.5. Spain
- 3.6. Russia
- 3.7. Benelux
- 3.8. Nordics
- 3.9. Rest of Europe
-
4. Middle East & Africa
- 4.1. Turkey
- 4.2. Israel
- 4.3. GCC
- 4.4. North Africa
- 4.5. South Africa
- 4.6. Rest of Middle East & Africa
-
5. Asia Pacific
- 5.1. China
- 5.2. India
- 5.3. Japan
- 5.4. South Korea
- 5.5. ASEAN
- 5.6. Oceania
- 5.7. Rest of Asia Pacific
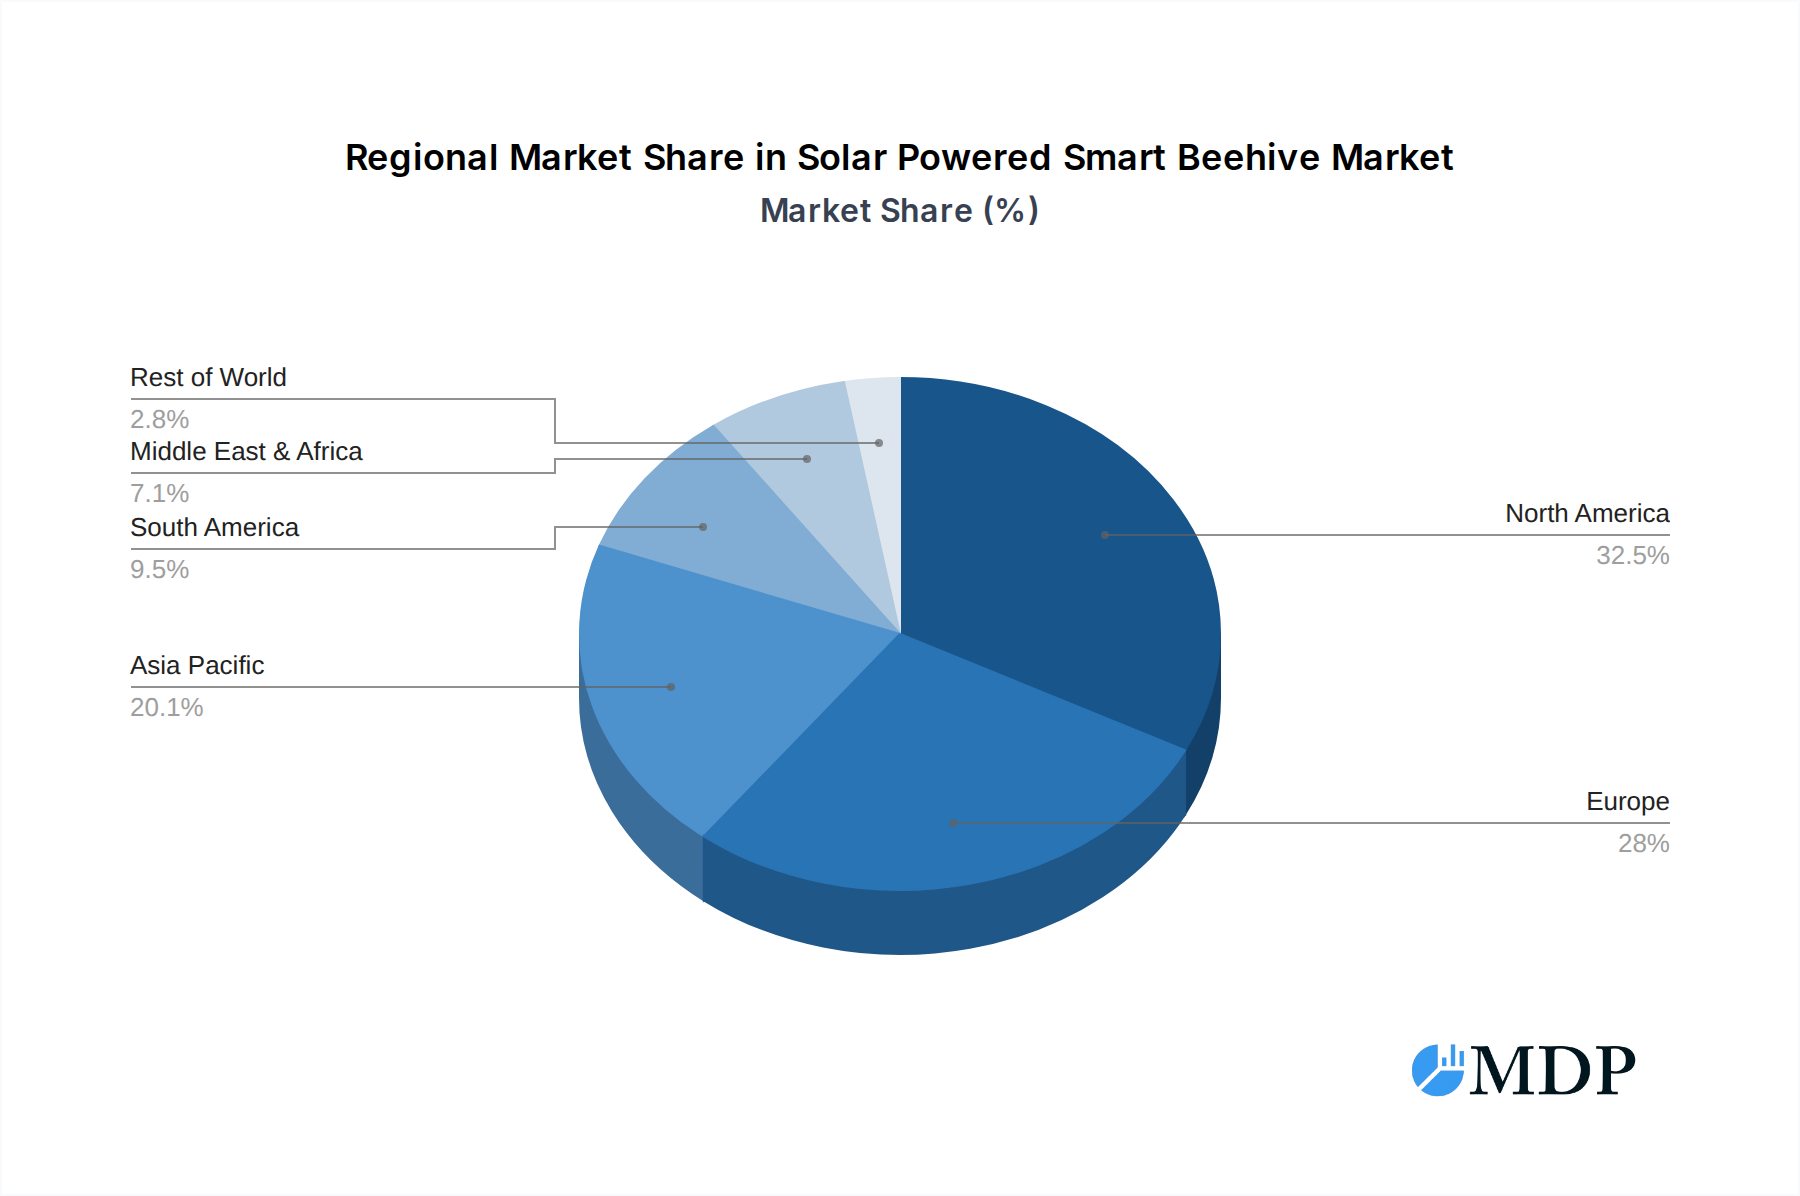
Solar Powered Smart Beehive Regional Market Share
Geographic Coverage of Solar Powered Smart Beehive
Solar Powered Smart Beehive REPORT HIGHLIGHTS
| Aspects | Details |
|---|---|
| Study Period | 2020-2034 |
| Base Year | 2025 |
| Estimated Year | 2026 |
| Forecast Period | 2026-2034 |
| Historical Period | 2020-2025 |
| Growth Rate | CAGR of 8.6% from 2020-2034 |
| Segmentation |
|
Table of Contents
- 1. Introduction
- 1.1. Research Scope
- 1.2. Market Segmentation
- 1.3. Research Methodology
- 1.4. Definitions and Assumptions
- 2. Executive Summary
- 2.1. Introduction
- 3. Market Dynamics
- 3.1. Introduction
- 3.2. Market Drivers
- 3.3. Market Restrains
- 3.4. Market Trends
- 4. Market Factor Analysis
- 4.1. Porters Five Forces
- 4.2. Supply/Value Chain
- 4.3. PESTEL analysis
- 4.4. Market Entropy
- 4.5. Patent/Trademark Analysis
- 5. Global Solar Powered Smart Beehive Analysis, Insights and Forecast, 2020-2032
- 5.1. Market Analysis, Insights and Forecast - by Application
- 5.1.1. Agriculture
- 5.1.2. Scientific Research
- 5.1.3. Others
- 5.2. Market Analysis, Insights and Forecast - by Type
- 5.2.1. Independent Smart Beehive
- 5.2.2. Cluster Smart Beehive
- 5.3. Market Analysis, Insights and Forecast - by Region
- 5.3.1. North America
- 5.3.2. South America
- 5.3.3. Europe
- 5.3.4. Middle East & Africa
- 5.3.5. Asia Pacific
- 5.1. Market Analysis, Insights and Forecast - by Application
- 6. North America Solar Powered Smart Beehive Analysis, Insights and Forecast, 2020-2032
- 6.1. Market Analysis, Insights and Forecast - by Application
- 6.1.1. Agriculture
- 6.1.2. Scientific Research
- 6.1.3. Others
- 6.2. Market Analysis, Insights and Forecast - by Type
- 6.2.1. Independent Smart Beehive
- 6.2.2. Cluster Smart Beehive
- 6.1. Market Analysis, Insights and Forecast - by Application
- 7. South America Solar Powered Smart Beehive Analysis, Insights and Forecast, 2020-2032
- 7.1. Market Analysis, Insights and Forecast - by Application
- 7.1.1. Agriculture
- 7.1.2. Scientific Research
- 7.1.3. Others
- 7.2. Market Analysis, Insights and Forecast - by Type
- 7.2.1. Independent Smart Beehive
- 7.2.2. Cluster Smart Beehive
- 7.1. Market Analysis, Insights and Forecast - by Application
- 8. Europe Solar Powered Smart Beehive Analysis, Insights and Forecast, 2020-2032
- 8.1. Market Analysis, Insights and Forecast - by Application
- 8.1.1. Agriculture
- 8.1.2. Scientific Research
- 8.1.3. Others
- 8.2. Market Analysis, Insights and Forecast - by Type
- 8.2.1. Independent Smart Beehive
- 8.2.2. Cluster Smart Beehive
- 8.1. Market Analysis, Insights and Forecast - by Application
- 9. Middle East & Africa Solar Powered Smart Beehive Analysis, Insights and Forecast, 2020-2032
- 9.1. Market Analysis, Insights and Forecast - by Application
- 9.1.1. Agriculture
- 9.1.2. Scientific Research
- 9.1.3. Others
- 9.2. Market Analysis, Insights and Forecast - by Type
- 9.2.1. Independent Smart Beehive
- 9.2.2. Cluster Smart Beehive
- 9.1. Market Analysis, Insights and Forecast - by Application
- 10. Asia Pacific Solar Powered Smart Beehive Analysis, Insights and Forecast, 2020-2032
- 10.1. Market Analysis, Insights and Forecast - by Application
- 10.1.1. Agriculture
- 10.1.2. Scientific Research
- 10.1.3. Others
- 10.2. Market Analysis, Insights and Forecast - by Type
- 10.2.1. Independent Smart Beehive
- 10.2.2. Cluster Smart Beehive
- 10.1. Market Analysis, Insights and Forecast - by Application
- 11. Competitive Analysis
- 11.1. Global Market Share Analysis 2025
- 11.2. Company Profiles
- 11.2.1 Beewise
- 11.2.1.1. Overview
- 11.2.1.2. Products
- 11.2.1.3. SWOT Analysis
- 11.2.1.4. Recent Developments
- 11.2.1.5. Financials (Based on Availability)
- 11.2.2 ApisProtect
- 11.2.2.1. Overview
- 11.2.2.2. Products
- 11.2.2.3. SWOT Analysis
- 11.2.2.4. Recent Developments
- 11.2.2.5. Financials (Based on Availability)
- 11.2.3 BeeHero
- 11.2.3.1. Overview
- 11.2.3.2. Products
- 11.2.3.3. SWOT Analysis
- 11.2.3.4. Recent Developments
- 11.2.3.5. Financials (Based on Availability)
- 11.2.4 HiveTracks
- 11.2.4.1. Overview
- 11.2.4.2. Products
- 11.2.4.3. SWOT Analysis
- 11.2.4.4. Recent Developments
- 11.2.4.5. Financials (Based on Availability)
- 11.2.5 BeeScanning
- 11.2.5.1. Overview
- 11.2.5.2. Products
- 11.2.5.3. SWOT Analysis
- 11.2.5.4. Recent Developments
- 11.2.5.5. Financials (Based on Availability)
- 11.2.6 Hive Haven
- 11.2.6.1. Overview
- 11.2.6.2. Products
- 11.2.6.3. SWOT Analysis
- 11.2.6.4. Recent Developments
- 11.2.6.5. Financials (Based on Availability)
- 11.2.7 SmartHive
- 11.2.7.1. Overview
- 11.2.7.2. Products
- 11.2.7.3. SWOT Analysis
- 11.2.7.4. Recent Developments
- 11.2.7.5. Financials (Based on Availability)
- 11.2.8 Apiterra
- 11.2.8.1. Overview
- 11.2.8.2. Products
- 11.2.8.3. SWOT Analysis
- 11.2.8.4. Recent Developments
- 11.2.8.5. Financials (Based on Availability)
- 11.2.9 HiveMind
- 11.2.9.1. Overview
- 11.2.9.2. Products
- 11.2.9.3. SWOT Analysis
- 11.2.9.4. Recent Developments
- 11.2.9.5. Financials (Based on Availability)
- 11.2.1 Beewise
List of Figures
- Figure 1: Global Solar Powered Smart Beehive Revenue Breakdown (million, %) by Region 2025 & 2033
- Figure 2: North America Solar Powered Smart Beehive Revenue (million), by Application 2025 & 2033
- Figure 3: North America Solar Powered Smart Beehive Revenue Share (%), by Application 2025 & 2033
- Figure 4: North America Solar Powered Smart Beehive Revenue (million), by Type 2025 & 2033
- Figure 5: North America Solar Powered Smart Beehive Revenue Share (%), by Type 2025 & 2033
- Figure 6: North America Solar Powered Smart Beehive Revenue (million), by Country 2025 & 2033
- Figure 7: North America Solar Powered Smart Beehive Revenue Share (%), by Country 2025 & 2033
- Figure 8: South America Solar Powered Smart Beehive Revenue (million), by Application 2025 & 2033
- Figure 9: South America Solar Powered Smart Beehive Revenue Share (%), by Application 2025 & 2033
- Figure 10: South America Solar Powered Smart Beehive Revenue (million), by Type 2025 & 2033
- Figure 11: South America Solar Powered Smart Beehive Revenue Share (%), by Type 2025 & 2033
- Figure 12: South America Solar Powered Smart Beehive Revenue (million), by Country 2025 & 2033
- Figure 13: South America Solar Powered Smart Beehive Revenue Share (%), by Country 2025 & 2033
- Figure 14: Europe Solar Powered Smart Beehive Revenue (million), by Application 2025 & 2033
- Figure 15: Europe Solar Powered Smart Beehive Revenue Share (%), by Application 2025 & 2033
- Figure 16: Europe Solar Powered Smart Beehive Revenue (million), by Type 2025 & 2033
- Figure 17: Europe Solar Powered Smart Beehive Revenue Share (%), by Type 2025 & 2033
- Figure 18: Europe Solar Powered Smart Beehive Revenue (million), by Country 2025 & 2033
- Figure 19: Europe Solar Powered Smart Beehive Revenue Share (%), by Country 2025 & 2033
- Figure 20: Middle East & Africa Solar Powered Smart Beehive Revenue (million), by Application 2025 & 2033
- Figure 21: Middle East & Africa Solar Powered Smart Beehive Revenue Share (%), by Application 2025 & 2033
- Figure 22: Middle East & Africa Solar Powered Smart Beehive Revenue (million), by Type 2025 & 2033
- Figure 23: Middle East & Africa Solar Powered Smart Beehive Revenue Share (%), by Type 2025 & 2033
- Figure 24: Middle East & Africa Solar Powered Smart Beehive Revenue (million), by Country 2025 & 2033
- Figure 25: Middle East & Africa Solar Powered Smart Beehive Revenue Share (%), by Country 2025 & 2033
- Figure 26: Asia Pacific Solar Powered Smart Beehive Revenue (million), by Application 2025 & 2033
- Figure 27: Asia Pacific Solar Powered Smart Beehive Revenue Share (%), by Application 2025 & 2033
- Figure 28: Asia Pacific Solar Powered Smart Beehive Revenue (million), by Type 2025 & 2033
- Figure 29: Asia Pacific Solar Powered Smart Beehive Revenue Share (%), by Type 2025 & 2033
- Figure 30: Asia Pacific Solar Powered Smart Beehive Revenue (million), by Country 2025 & 2033
- Figure 31: Asia Pacific Solar Powered Smart Beehive Revenue Share (%), by Country 2025 & 2033
List of Tables
- Table 1: Global Solar Powered Smart Beehive Revenue million Forecast, by Application 2020 & 2033
- Table 2: Global Solar Powered Smart Beehive Revenue million Forecast, by Type 2020 & 2033
- Table 3: Global Solar Powered Smart Beehive Revenue million Forecast, by Region 2020 & 2033
- Table 4: Global Solar Powered Smart Beehive Revenue million Forecast, by Application 2020 & 2033
- Table 5: Global Solar Powered Smart Beehive Revenue million Forecast, by Type 2020 & 2033
- Table 6: Global Solar Powered Smart Beehive Revenue million Forecast, by Country 2020 & 2033
- Table 7: United States Solar Powered Smart Beehive Revenue (million) Forecast, by Application 2020 & 2033
- Table 8: Canada Solar Powered Smart Beehive Revenue (million) Forecast, by Application 2020 & 2033
- Table 9: Mexico Solar Powered Smart Beehive Revenue (million) Forecast, by Application 2020 & 2033
- Table 10: Global Solar Powered Smart Beehive Revenue million Forecast, by Application 2020 & 2033
- Table 11: Global Solar Powered Smart Beehive Revenue million Forecast, by Type 2020 & 2033
- Table 12: Global Solar Powered Smart Beehive Revenue million Forecast, by Country 2020 & 2033
- Table 13: Brazil Solar Powered Smart Beehive Revenue (million) Forecast, by Application 2020 & 2033
- Table 14: Argentina Solar Powered Smart Beehive Revenue (million) Forecast, by Application 2020 & 2033
- Table 15: Rest of South America Solar Powered Smart Beehive Revenue (million) Forecast, by Application 2020 & 2033
- Table 16: Global Solar Powered Smart Beehive Revenue million Forecast, by Application 2020 & 2033
- Table 17: Global Solar Powered Smart Beehive Revenue million Forecast, by Type 2020 & 2033
- Table 18: Global Solar Powered Smart Beehive Revenue million Forecast, by Country 2020 & 2033
- Table 19: United Kingdom Solar Powered Smart Beehive Revenue (million) Forecast, by Application 2020 & 2033
- Table 20: Germany Solar Powered Smart Beehive Revenue (million) Forecast, by Application 2020 & 2033
- Table 21: France Solar Powered Smart Beehive Revenue (million) Forecast, by Application 2020 & 2033
- Table 22: Italy Solar Powered Smart Beehive Revenue (million) Forecast, by Application 2020 & 2033
- Table 23: Spain Solar Powered Smart Beehive Revenue (million) Forecast, by Application 2020 & 2033
- Table 24: Russia Solar Powered Smart Beehive Revenue (million) Forecast, by Application 2020 & 2033
- Table 25: Benelux Solar Powered Smart Beehive Revenue (million) Forecast, by Application 2020 & 2033
- Table 26: Nordics Solar Powered Smart Beehive Revenue (million) Forecast, by Application 2020 & 2033
- Table 27: Rest of Europe Solar Powered Smart Beehive Revenue (million) Forecast, by Application 2020 & 2033
- Table 28: Global Solar Powered Smart Beehive Revenue million Forecast, by Application 2020 & 2033
- Table 29: Global Solar Powered Smart Beehive Revenue million Forecast, by Type 2020 & 2033
- Table 30: Global Solar Powered Smart Beehive Revenue million Forecast, by Country 2020 & 2033
- Table 31: Turkey Solar Powered Smart Beehive Revenue (million) Forecast, by Application 2020 & 2033
- Table 32: Israel Solar Powered Smart Beehive Revenue (million) Forecast, by Application 2020 & 2033
- Table 33: GCC Solar Powered Smart Beehive Revenue (million) Forecast, by Application 2020 & 2033
- Table 34: North Africa Solar Powered Smart Beehive Revenue (million) Forecast, by Application 2020 & 2033
- Table 35: South Africa Solar Powered Smart Beehive Revenue (million) Forecast, by Application 2020 & 2033
- Table 36: Rest of Middle East & Africa Solar Powered Smart Beehive Revenue (million) Forecast, by Application 2020 & 2033
- Table 37: Global Solar Powered Smart Beehive Revenue million Forecast, by Application 2020 & 2033
- Table 38: Global Solar Powered Smart Beehive Revenue million Forecast, by Type 2020 & 2033
- Table 39: Global Solar Powered Smart Beehive Revenue million Forecast, by Country 2020 & 2033
- Table 40: China Solar Powered Smart Beehive Revenue (million) Forecast, by Application 2020 & 2033
- Table 41: India Solar Powered Smart Beehive Revenue (million) Forecast, by Application 2020 & 2033
- Table 42: Japan Solar Powered Smart Beehive Revenue (million) Forecast, by Application 2020 & 2033
- Table 43: South Korea Solar Powered Smart Beehive Revenue (million) Forecast, by Application 2020 & 2033
- Table 44: ASEAN Solar Powered Smart Beehive Revenue (million) Forecast, by Application 2020 & 2033
- Table 45: Oceania Solar Powered Smart Beehive Revenue (million) Forecast, by Application 2020 & 2033
- Table 46: Rest of Asia Pacific Solar Powered Smart Beehive Revenue (million) Forecast, by Application 2020 & 2033
Frequently Asked Questions
1. What is the projected Compound Annual Growth Rate (CAGR) of the Solar Powered Smart Beehive?
The projected CAGR is approximately 8.6%.
2. Which companies are prominent players in the Solar Powered Smart Beehive?
Key companies in the market include Beewise, ApisProtect, BeeHero, HiveTracks, BeeScanning, Hive Haven, SmartHive, Apiterra, HiveMind.
3. What are the main segments of the Solar Powered Smart Beehive?
The market segments include Application, Type.
4. Can you provide details about the market size?
The market size is estimated to be USD 997 million as of 2022.
5. What are some drivers contributing to market growth?
N/A
6. What are the notable trends driving market growth?
N/A
7. Are there any restraints impacting market growth?
N/A
8. Can you provide examples of recent developments in the market?
N/A
9. What pricing options are available for accessing the report?
Pricing options include single-user, multi-user, and enterprise licenses priced at USD 2900.00, USD 4350.00, and USD 5800.00 respectively.
10. Is the market size provided in terms of value or volume?
The market size is provided in terms of value, measured in million.
11. Are there any specific market keywords associated with the report?
Yes, the market keyword associated with the report is "Solar Powered Smart Beehive," which aids in identifying and referencing the specific market segment covered.
12. How do I determine which pricing option suits my needs best?
The pricing options vary based on user requirements and access needs. Individual users may opt for single-user licenses, while businesses requiring broader access may choose multi-user or enterprise licenses for cost-effective access to the report.
13. Are there any additional resources or data provided in the Solar Powered Smart Beehive report?
While the report offers comprehensive insights, it's advisable to review the specific contents or supplementary materials provided to ascertain if additional resources or data are available.
14. How can I stay updated on further developments or reports in the Solar Powered Smart Beehive?
To stay informed about further developments, trends, and reports in the Solar Powered Smart Beehive, consider subscribing to industry newsletters, following relevant companies and organizations, or regularly checking reputable industry news sources and publications.
Methodology
Step 1 - Identification of Relevant Samples Size from Population Database


Step 2 - Approaches for Defining Global Market Size (Value, Volume* & Price*)

Note*: In applicable scenarios
Step 3 - Data Sources
Primary Research
- Web Analytics
- Survey Reports
- Research Institute
- Latest Research Reports
- Opinion Leaders
Secondary Research
- Annual Reports
- White Paper
- Latest Press Release
- Industry Association
- Paid Database
- Investor Presentations

Step 4 - Data Triangulation
Involves using different sources of information in order to increase the validity of a study
These sources are likely to be stakeholders in a program - participants, other researchers, program staff, other community members, and so on.
Then we put all data in single framework & apply various statistical tools to find out the dynamic on the market.
During the analysis stage, feedback from the stakeholder groups would be compared to determine areas of agreement as well as areas of divergence