

Key Insights
The global soft contact lens market, valued at $97.6 billion in 2025, is poised for substantial expansion. Key growth drivers include the rising prevalence of myopia, increasing disposable income in emerging economies, and a growing demand for cosmetic contact lenses. Technological innovations, leading to more comfortable, breathable, and durable lenses, are further accelerating market growth. The corrective contact lens segment leads in usage, while therapeutic contact lenses show significant growth driven by enhanced eye health awareness and the increasing incidence of eye-related diseases. Distribution channels are diversifying, with online platforms gaining prominence alongside traditional opticians. Leading companies such as Johnson & Johnson Vision Care, Alcon, and CooperVision are actively investing in R&D to introduce new materials, designs, and features, maintaining their competitive advantage. Intense competition is characterized by a focus on brand building, strategic alliances, and mergers and acquisitions. While North America and Europe currently hold significant market shares, the Asia-Pacific region is projected to experience the fastest growth due to urbanization and rising disposable incomes.
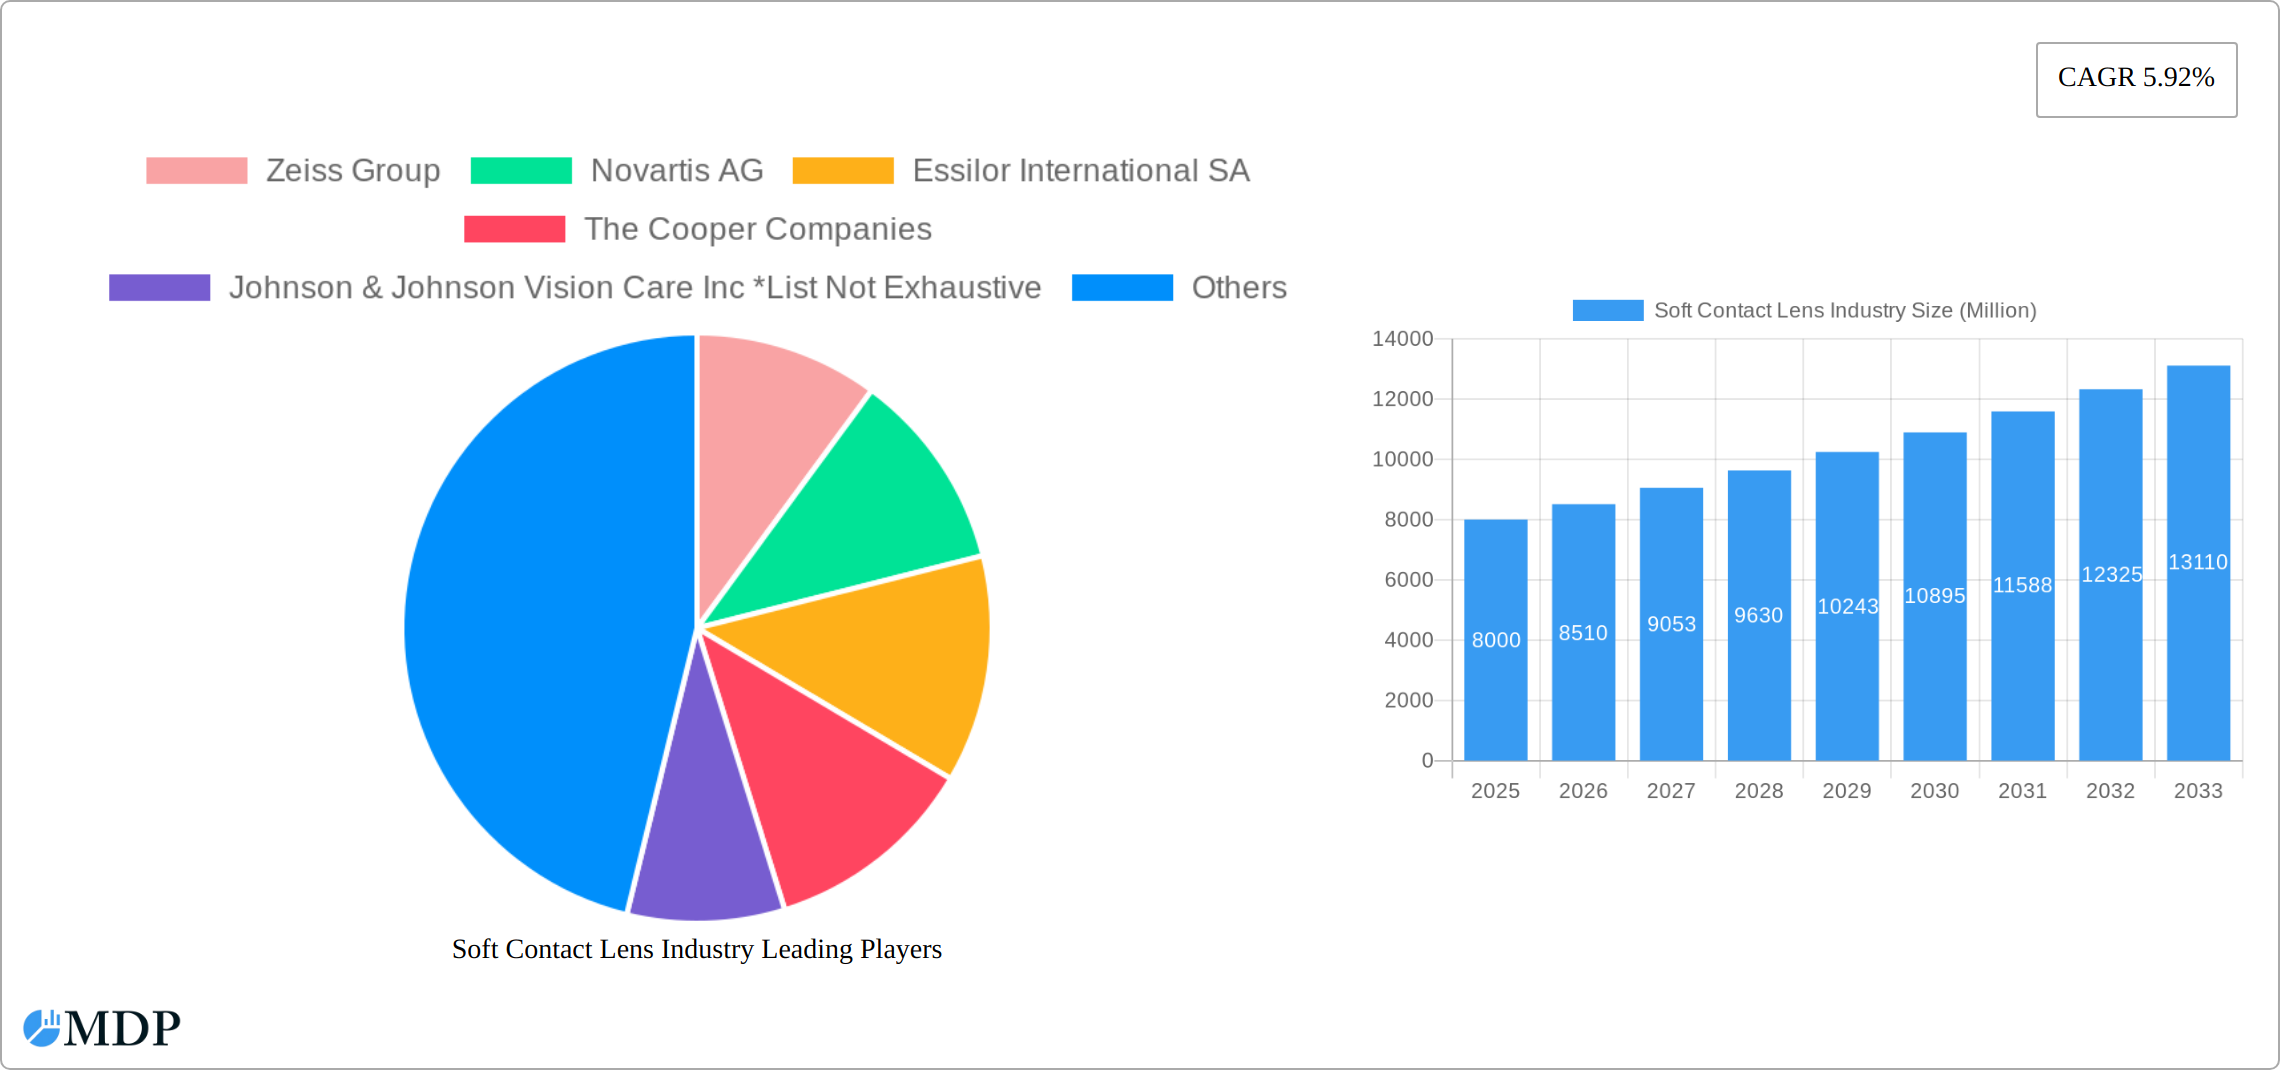
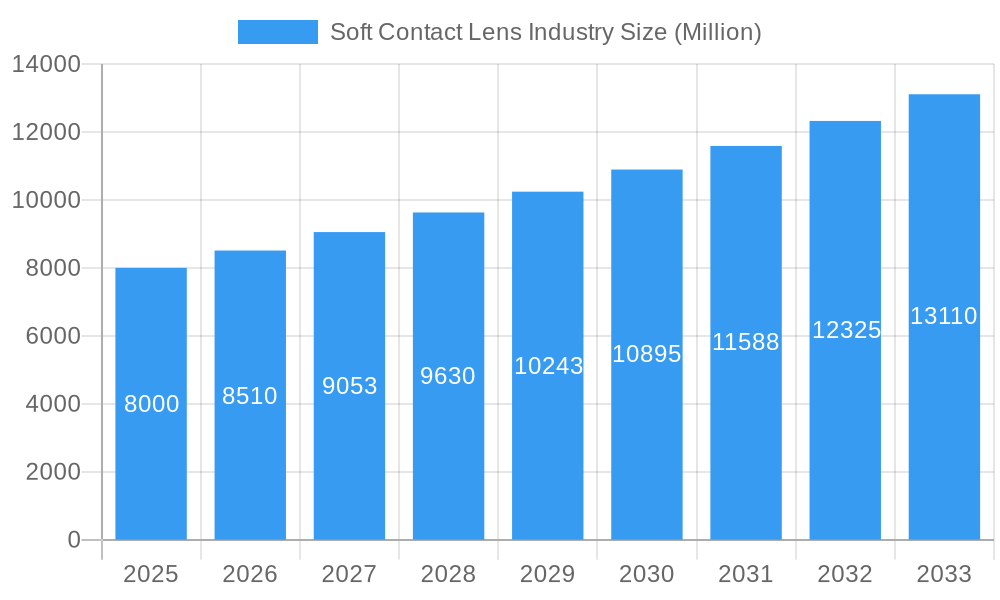
Soft Contact Lens Industry Market Size (In Billion)
The market is forecasted to sustain its growth trajectory throughout the projection period (2025-2033), with an anticipated Compound Annual Growth Rate (CAGR) of 6.21%. However, growth may be influenced by fluctuating raw material prices, rigorous regulatory approvals, and potential risks associated with contact lens misuse. Advanced refractive surgeries also present a competitive challenge. Ongoing research into novel lens materials, such as silicone hydrogels offering superior oxygen permeability and comfort, will continue to drive demand, particularly in the high-growth Asia-Pacific market. The market will witness continuous innovation in lens designs and features to meet diverse consumer needs. Segmentation by product type, usage, and distribution channel will enable targeted strategies, further shaping market dynamics.
Soft Contact Lens Industry Company Market Share
Soft Contact Lens Industry Market Report: 2019-2033 Forecast
Unlocking the Potential of the Multi-Billion Dollar Soft Contact Lens Market: A Comprehensive Analysis and Forecast (2019-2033)
This comprehensive report provides an in-depth analysis of the global soft contact lens industry, offering invaluable insights for stakeholders seeking to navigate this dynamic market. From market dynamics and concentration to leading players and emerging opportunities, this report delivers actionable intelligence for strategic decision-making. The study period spans 2019-2033, with 2025 serving as the base and estimated year. The forecast period covers 2025-2033, while historical data encompasses 2019-2024. The market size is projected to reach xx Million by 2033.
Soft Contact Lens Industry Market Dynamics & Concentration
The global soft contact lens market exhibits a moderately concentrated structure, with key players like Zeiss Group, Novartis AG, Essilor International SA, The Cooper Companies, Johnson & Johnson Vision Care Inc, Bausch Health Companies Inc, and Hoya Corporation holding significant market share. The combined market share of these companies is estimated at approximately 65% in 2025. Market concentration is influenced by factors such as economies of scale in manufacturing, strong brand recognition, and extensive distribution networks.
Innovation is a key driver, with ongoing research and development focusing on enhanced materials, improved comfort, and extended wear capabilities. Regulatory frameworks, particularly concerning material safety and labeling, significantly impact market dynamics. Product substitutes, such as LASIK surgery and other vision correction methods, pose a competitive challenge. End-user trends, including increasing preference for daily disposable lenses and growing awareness of eye health, are shaping market demand. M&A activity within the industry has been moderate in recent years, with approximately 5-7 deals annually, primarily focused on expanding product portfolios and geographical reach.
Soft Contact Lens Industry Industry Trends & Analysis
The soft contact lens market is experiencing robust growth, fueled by a confluence of factors. Globally, the increasing prevalence of refractive errors is a significant driver. This is further amplified by rising disposable incomes in emerging economies and a growing consumer preference for cosmetic contact lenses, enhancing the market's appeal beyond vision correction. The Compound Annual Growth Rate (CAGR) is projected to be approximately 5% during the forecast period (2025-2033). This growth is significantly boosted by ongoing technological advancements. For example, the development of silicone hydrogel materials with superior oxygen permeability has led to more comfortable and healthier lens options, increasing user satisfaction and market demand. Consumer preferences are evolving, with a clear shift towards the convenience of daily disposable lenses and specialized lenses designed to address specific eye conditions and needs. The market landscape is dynamic, characterized by intense competition among established players and the emergence of innovative new entrants, all vying for market share. Market penetration continues to rise, particularly in developing countries experiencing improved access to comprehensive eye care services. Furthermore, the market is poised for substantial growth in online sales, driven by the expansion of e-commerce platforms and the inherent convenience they offer to consumers.
Leading Markets & Segments in Soft Contact Lens Industry
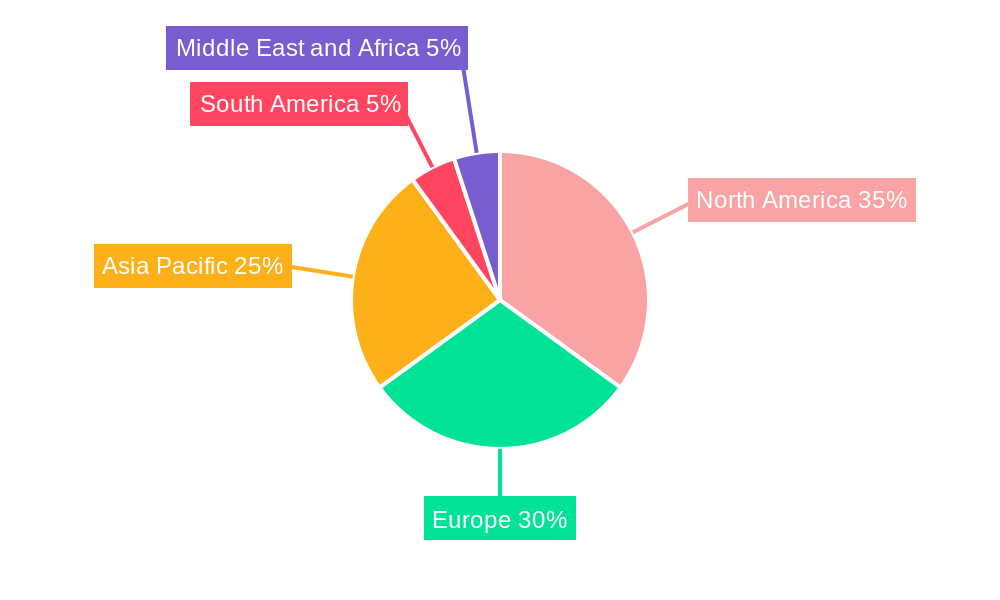
The North American region commands the largest market share in the soft contact lens industry, followed by Europe and the Asia Pacific region. Several key factors contribute to the dominance of these regions: high disposable incomes enabling greater consumer spending on healthcare products; advanced healthcare infrastructure providing better access to eye care professionals and services; and well-established distribution networks ensuring efficient product delivery to consumers.
Leading Segments:
- Product Type: Soft contact lenses remain the market leader, representing over 80% of total sales. Within this category, the daily disposable segment exhibits the most rapid growth, driven by its convenience and hygiene benefits.
- Usage: Corrective contact lenses still constitute the largest segment, addressing refractive errors like myopia and hyperopia. However, therapeutic contact lenses are demonstrating significant growth, fueled by increased awareness of various eye conditions and advancements in lens technology that allow for targeted treatment.
- Distribution Channel: Traditional spectacle stores maintain their position as the primary distribution channel. However, online stores are experiencing rapid growth, leveraging e-commerce platforms and convenient online ordering to capture a significant and increasing share of the market.
Key Drivers for Dominance:
- North America: High disposable incomes, a robust healthcare infrastructure, and strong brand awareness among consumers contribute to its leading position.
- Europe: Well-developed healthcare systems and a high rate of adoption of technologically advanced contact lenses drive market growth.
- Asia Pacific: Rapidly rising disposable incomes, a growing prevalence of refractive errors, and increasing awareness of the importance of eye health are key factors contributing to significant market expansion.
Soft Contact Lens Industry Product Developments
Recent innovations include advancements in silicone hydrogel materials for enhanced oxygen transmissibility, improved comfort, and extended wear capabilities. New designs focus on minimizing lens deposits and improving lens handling. These developments cater to increasing consumer demand for superior comfort, convenience, and health benefits. The market is also witnessing a rise in multifocal lenses for presbyopia correction and cosmetic lenses for aesthetic purposes.
Key Drivers of Soft Contact Lens Industry Growth
The industry’s growth is fueled by several factors: rising prevalence of refractive errors globally; increasing disposable incomes, particularly in emerging markets; technological advancements leading to improved lens materials and designs; and growing consumer preference for convenient and comfortable contact lenses. Furthermore, increasing awareness of eye health and proactive eye care is driving demand. Government initiatives promoting eye care also contribute to market expansion.
Challenges in the Soft Contact Lens Industry Market
Significant challenges include stringent regulatory requirements for lens materials and safety, potential supply chain disruptions impacting raw materials and manufacturing, and intense competition from established players and the entry of new competitors. The high cost of advanced contact lenses can also limit accessibility in certain markets. These factors can constrain market growth and profitability.
Emerging Opportunities in Soft Contact Lens Industry
The soft contact lens industry presents several exciting emerging opportunities. The development of smart contact lenses incorporating advanced technological features, such as integrated glucose monitoring or other health sensors, holds immense potential. Expanding into untapped markets, particularly in developing countries witnessing improved access to eye care, offers substantial growth prospects. Strategic partnerships, leveraging technological innovations and established distribution networks, are crucial for market expansion and product innovation. A focus on personalized lens designs and customized eye care solutions will further cater to individual patient needs and drive future market growth.
Leading Players in the Soft Contact Lens Industry Sector
- Zeiss Group
- Novartis AG
- Essilor International SA
- The Cooper Companies
- Johnson & Johnson Vision Care Inc
- Bausch Health Companies Inc
- Hoya Corporation
Key Milestones in Soft Contact Lens Industry Industry
- 2020: Johnson & Johnson Vision Care Inc. launched a new silicone hydrogel lens featuring significantly improved oxygen permeability, enhancing lens comfort and health.
- 2021: Essilor International SA expanded its product portfolio through the acquisition of a smaller contact lens manufacturer, strengthening its market presence.
- 2022: A new daily disposable lens with enhanced comfort features received FDA approval, signifying a leap forward in lens technology and user experience.
- 2023: A notable increase in online sales of contact lenses was observed across various global markets, reflecting the growing preference for e-commerce.
Strategic Outlook for Soft Contact Lens Industry Market
The soft contact lens market is poised for continued growth, driven by technological innovation, expanding market penetration, and increasing consumer demand. Strategic opportunities lie in focusing on personalized solutions, developing innovative materials, and leveraging digital platforms for enhanced reach and customer engagement. Expansion into emerging markets and strategic partnerships will further fuel growth and market leadership.
Soft Contact Lens Industry Segmentation
-
1. Product Type
- 1.1. Soft Contact Lens
- 1.2. Hybrid Contact Lens
- 1.3. Rigid Gas Permeable Contact Lens
- 1.4. Others
-
2. Usages
- 2.1. Corrective Contact Lens
- 2.2. Therapeutic Contact Lens
- 2.3. Other Usages
-
3. Distribution Channel
- 3.1. Spectacle Stores
- 3.2. Online Stores
- 3.3. Other channel
Soft Contact Lens Industry Segmentation By Geography
-
1. North America
- 1.1. United States
- 1.2. Canada
- 1.3. Mexico
- 1.4. Rest of North America
-
2. Europe
- 2.1. United Kingdom
- 2.2. Germany
- 2.3. France
- 2.4. Italy
- 2.5. Russia
- 2.6. Rest of Europe
-
3. Asia Pacific
- 3.1. China
- 3.2. Japan
- 3.3. India
- 3.4. Australia
- 3.5. Rest of Asia Pacific
-
4. South America
- 4.1. Brazil
- 4.2. Argentina
- 4.3. Rest of South America
-
5. Middle East and Africa
- 5.1. South Africa
- 5.2. United Arab Emirates
- 5.3. Rest of Middle East and Africa
Soft Contact Lens Industry Regional Market Share
Geographic Coverage of Soft Contact Lens Industry
Soft Contact Lens Industry REPORT HIGHLIGHTS
| Aspects | Details |
|---|---|
| Study Period | 2020-2034 |
| Base Year | 2025 |
| Estimated Year | 2026 |
| Forecast Period | 2026-2034 |
| Historical Period | 2020-2025 |
| Growth Rate | CAGR of 6.21% from 2020-2034 |
| Segmentation |
|
Table of Contents
- 1. Introduction
- 1.1. Research Scope
- 1.2. Market Segmentation
- 1.3. Research Objective
- 1.4. Definitions and Assumptions
- 2. Executive Summary
- 2.1. Market Snapshot
- 3. Market Dynamics
- 3.1. Market Drivers
- 3.2. Market Restrains
- 3.3. Market Trends
- 3.4. Market Opportunities
- 4. Market Factor Analysis
- 4.1. Porters Five Forces
- 4.1.1. Bargaining Power of Suppliers
- 4.1.2. Bargaining Power of Buyers
- 4.1.3. Threat of New Entrants
- 4.1.4. Threat of Substitutes
- 4.1.5. Competitive Rivalry
- 4.2. PESTEL analysis
- 4.3. BCG Analysis
- 4.3.1. Stars (High Growth, High Market Share)
- 4.3.2. Cash Cows (Low Growth, High Market Share)
- 4.3.3. Question Mark (High Growth, Low Market Share)
- 4.3.4. Dogs (Low Growth, Low Market Share)
- 4.4. Ansoff Matrix Analysis
- 4.5. Supply Chain Analysis
- 4.6. Regulatory Landscape
- 4.7. Current Market Potential and Opportunity Assessment (TAM–SAM–SOM Framework)
- 4.8. MDP Analyst Note
- 4.1. Porters Five Forces
- 5. Market Analysis, Insights and Forecast 2021-2033
- 5.1. Market Analysis, Insights and Forecast - by Product Type
- 5.1.1. Soft Contact Lens
- 5.1.2. Hybrid Contact Lens
- 5.1.3. Rigid Gas Permeable Contact Lens
- 5.1.4. Others
- 5.2. Market Analysis, Insights and Forecast - by Usages
- 5.2.1. Corrective Contact Lens
- 5.2.2. Therapeutic Contact Lens
- 5.2.3. Other Usages
- 5.3. Market Analysis, Insights and Forecast - by Distribution Channel
- 5.3.1. Spectacle Stores
- 5.3.2. Online Stores
- 5.3.3. Other channel
- 5.4. Market Analysis, Insights and Forecast - by Region
- 5.4.1. North America
- 5.4.2. Europe
- 5.4.3. Asia Pacific
- 5.4.4. South America
- 5.4.5. Middle East and Africa
- 5.1. Market Analysis, Insights and Forecast - by Product Type
- 6. Global Soft Contact Lens Industry Analysis, Insights and Forecast, 2021-2033
- 6.1. Market Analysis, Insights and Forecast - by Product Type
- 6.1.1. Soft Contact Lens
- 6.1.2. Hybrid Contact Lens
- 6.1.3. Rigid Gas Permeable Contact Lens
- 6.1.4. Others
- 6.2. Market Analysis, Insights and Forecast - by Usages
- 6.2.1. Corrective Contact Lens
- 6.2.2. Therapeutic Contact Lens
- 6.2.3. Other Usages
- 6.3. Market Analysis, Insights and Forecast - by Distribution Channel
- 6.3.1. Spectacle Stores
- 6.3.2. Online Stores
- 6.3.3. Other channel
- 6.1. Market Analysis, Insights and Forecast - by Product Type
- 7. North America Soft Contact Lens Industry Analysis, Insights and Forecast, 2020-2032
- 7.1. Market Analysis, Insights and Forecast - by Product Type
- 7.1.1. Soft Contact Lens
- 7.1.2. Hybrid Contact Lens
- 7.1.3. Rigid Gas Permeable Contact Lens
- 7.1.4. Others
- 7.2. Market Analysis, Insights and Forecast - by Usages
- 7.2.1. Corrective Contact Lens
- 7.2.2. Therapeutic Contact Lens
- 7.2.3. Other Usages
- 7.3. Market Analysis, Insights and Forecast - by Distribution Channel
- 7.3.1. Spectacle Stores
- 7.3.2. Online Stores
- 7.3.3. Other channel
- 7.1. Market Analysis, Insights and Forecast - by Product Type
- 8. Europe Soft Contact Lens Industry Analysis, Insights and Forecast, 2020-2032
- 8.1. Market Analysis, Insights and Forecast - by Product Type
- 8.1.1. Soft Contact Lens
- 8.1.2. Hybrid Contact Lens
- 8.1.3. Rigid Gas Permeable Contact Lens
- 8.1.4. Others
- 8.2. Market Analysis, Insights and Forecast - by Usages
- 8.2.1. Corrective Contact Lens
- 8.2.2. Therapeutic Contact Lens
- 8.2.3. Other Usages
- 8.3. Market Analysis, Insights and Forecast - by Distribution Channel
- 8.3.1. Spectacle Stores
- 8.3.2. Online Stores
- 8.3.3. Other channel
- 8.1. Market Analysis, Insights and Forecast - by Product Type
- 9. Asia Pacific Soft Contact Lens Industry Analysis, Insights and Forecast, 2020-2032
- 9.1. Market Analysis, Insights and Forecast - by Product Type
- 9.1.1. Soft Contact Lens
- 9.1.2. Hybrid Contact Lens
- 9.1.3. Rigid Gas Permeable Contact Lens
- 9.1.4. Others
- 9.2. Market Analysis, Insights and Forecast - by Usages
- 9.2.1. Corrective Contact Lens
- 9.2.2. Therapeutic Contact Lens
- 9.2.3. Other Usages
- 9.3. Market Analysis, Insights and Forecast - by Distribution Channel
- 9.3.1. Spectacle Stores
- 9.3.2. Online Stores
- 9.3.3. Other channel
- 9.1. Market Analysis, Insights and Forecast - by Product Type
- 10. South America Soft Contact Lens Industry Analysis, Insights and Forecast, 2020-2032
- 10.1. Market Analysis, Insights and Forecast - by Product Type
- 10.1.1. Soft Contact Lens
- 10.1.2. Hybrid Contact Lens
- 10.1.3. Rigid Gas Permeable Contact Lens
- 10.1.4. Others
- 10.2. Market Analysis, Insights and Forecast - by Usages
- 10.2.1. Corrective Contact Lens
- 10.2.2. Therapeutic Contact Lens
- 10.2.3. Other Usages
- 10.3. Market Analysis, Insights and Forecast - by Distribution Channel
- 10.3.1. Spectacle Stores
- 10.3.2. Online Stores
- 10.3.3. Other channel
- 10.1. Market Analysis, Insights and Forecast - by Product Type
- 11. Middle East and Africa Soft Contact Lens Industry Analysis, Insights and Forecast, 2020-2032
- 11.1. Market Analysis, Insights and Forecast - by Product Type
- 11.1.1. Soft Contact Lens
- 11.1.2. Hybrid Contact Lens
- 11.1.3. Rigid Gas Permeable Contact Lens
- 11.1.4. Others
- 11.2. Market Analysis, Insights and Forecast - by Usages
- 11.2.1. Corrective Contact Lens
- 11.2.2. Therapeutic Contact Lens
- 11.2.3. Other Usages
- 11.3. Market Analysis, Insights and Forecast - by Distribution Channel
- 11.3.1. Spectacle Stores
- 11.3.2. Online Stores
- 11.3.3. Other channel
- 11.1. Market Analysis, Insights and Forecast - by Product Type
- 12. Competitive Analysis
- 12.1. Company Profiles
- 12.1.1 Zeiss Group
- 12.1.1.1. Company Overview
- 12.1.1.2. Products
- 12.1.1.3. Company Financials
- 12.1.1.4. SWOT Analysis
- 12.1.2 Novartis AG
- 12.1.2.1. Company Overview
- 12.1.2.2. Products
- 12.1.2.3. Company Financials
- 12.1.2.4. SWOT Analysis
- 12.1.3 Essilor International SA
- 12.1.3.1. Company Overview
- 12.1.3.2. Products
- 12.1.3.3. Company Financials
- 12.1.3.4. SWOT Analysis
- 12.1.4 The Cooper Companies
- 12.1.4.1. Company Overview
- 12.1.4.2. Products
- 12.1.4.3. Company Financials
- 12.1.4.4. SWOT Analysis
- 12.1.5 Johnson & Johnson Vision Care Inc *List Not Exhaustive
- 12.1.5.1. Company Overview
- 12.1.5.2. Products
- 12.1.5.3. Company Financials
- 12.1.5.4. SWOT Analysis
- 12.1.6 Bausch Health Companies Inc
- 12.1.6.1. Company Overview
- 12.1.6.2. Products
- 12.1.6.3. Company Financials
- 12.1.6.4. SWOT Analysis
- 12.1.7 Hoya Corporation
- 12.1.7.1. Company Overview
- 12.1.7.2. Products
- 12.1.7.3. Company Financials
- 12.1.7.4. SWOT Analysis
- 12.1.1 Zeiss Group
- 12.2. Market Entropy
- 12.2.1 Company's Key Areas Served
- 12.2.2 Recent Developments
- 12.3. Company Market Share Analysis 2025
- 12.3.1 Top 5 Companies Market Share Analysis
- 12.3.2 Top 3 Companies Market Share Analysis
- 12.4. List of Potential Customers
- 13. Research Methodology
List of Figures
- Figure 1: Global Soft Contact Lens Industry Revenue Breakdown (billion, %) by Region 2025 & 2033
- Figure 2: Global Soft Contact Lens Industry Volume Breakdown (K Units, %) by Region 2025 & 2033
- Figure 3: North America Soft Contact Lens Industry Revenue (billion), by Product Type 2025 & 2033
- Figure 4: North America Soft Contact Lens Industry Volume (K Units), by Product Type 2025 & 2033
- Figure 5: North America Soft Contact Lens Industry Revenue Share (%), by Product Type 2025 & 2033
- Figure 6: North America Soft Contact Lens Industry Volume Share (%), by Product Type 2025 & 2033
- Figure 7: North America Soft Contact Lens Industry Revenue (billion), by Usages 2025 & 2033
- Figure 8: North America Soft Contact Lens Industry Volume (K Units), by Usages 2025 & 2033
- Figure 9: North America Soft Contact Lens Industry Revenue Share (%), by Usages 2025 & 2033
- Figure 10: North America Soft Contact Lens Industry Volume Share (%), by Usages 2025 & 2033
- Figure 11: North America Soft Contact Lens Industry Revenue (billion), by Distribution Channel 2025 & 2033
- Figure 12: North America Soft Contact Lens Industry Volume (K Units), by Distribution Channel 2025 & 2033
- Figure 13: North America Soft Contact Lens Industry Revenue Share (%), by Distribution Channel 2025 & 2033
- Figure 14: North America Soft Contact Lens Industry Volume Share (%), by Distribution Channel 2025 & 2033
- Figure 15: North America Soft Contact Lens Industry Revenue (billion), by Country 2025 & 2033
- Figure 16: North America Soft Contact Lens Industry Volume (K Units), by Country 2025 & 2033
- Figure 17: North America Soft Contact Lens Industry Revenue Share (%), by Country 2025 & 2033
- Figure 18: North America Soft Contact Lens Industry Volume Share (%), by Country 2025 & 2033
- Figure 19: Europe Soft Contact Lens Industry Revenue (billion), by Product Type 2025 & 2033
- Figure 20: Europe Soft Contact Lens Industry Volume (K Units), by Product Type 2025 & 2033
- Figure 21: Europe Soft Contact Lens Industry Revenue Share (%), by Product Type 2025 & 2033
- Figure 22: Europe Soft Contact Lens Industry Volume Share (%), by Product Type 2025 & 2033
- Figure 23: Europe Soft Contact Lens Industry Revenue (billion), by Usages 2025 & 2033
- Figure 24: Europe Soft Contact Lens Industry Volume (K Units), by Usages 2025 & 2033
- Figure 25: Europe Soft Contact Lens Industry Revenue Share (%), by Usages 2025 & 2033
- Figure 26: Europe Soft Contact Lens Industry Volume Share (%), by Usages 2025 & 2033
- Figure 27: Europe Soft Contact Lens Industry Revenue (billion), by Distribution Channel 2025 & 2033
- Figure 28: Europe Soft Contact Lens Industry Volume (K Units), by Distribution Channel 2025 & 2033
- Figure 29: Europe Soft Contact Lens Industry Revenue Share (%), by Distribution Channel 2025 & 2033
- Figure 30: Europe Soft Contact Lens Industry Volume Share (%), by Distribution Channel 2025 & 2033
- Figure 31: Europe Soft Contact Lens Industry Revenue (billion), by Country 2025 & 2033
- Figure 32: Europe Soft Contact Lens Industry Volume (K Units), by Country 2025 & 2033
- Figure 33: Europe Soft Contact Lens Industry Revenue Share (%), by Country 2025 & 2033
- Figure 34: Europe Soft Contact Lens Industry Volume Share (%), by Country 2025 & 2033
- Figure 35: Asia Pacific Soft Contact Lens Industry Revenue (billion), by Product Type 2025 & 2033
- Figure 36: Asia Pacific Soft Contact Lens Industry Volume (K Units), by Product Type 2025 & 2033
- Figure 37: Asia Pacific Soft Contact Lens Industry Revenue Share (%), by Product Type 2025 & 2033
- Figure 38: Asia Pacific Soft Contact Lens Industry Volume Share (%), by Product Type 2025 & 2033
- Figure 39: Asia Pacific Soft Contact Lens Industry Revenue (billion), by Usages 2025 & 2033
- Figure 40: Asia Pacific Soft Contact Lens Industry Volume (K Units), by Usages 2025 & 2033
- Figure 41: Asia Pacific Soft Contact Lens Industry Revenue Share (%), by Usages 2025 & 2033
- Figure 42: Asia Pacific Soft Contact Lens Industry Volume Share (%), by Usages 2025 & 2033
- Figure 43: Asia Pacific Soft Contact Lens Industry Revenue (billion), by Distribution Channel 2025 & 2033
- Figure 44: Asia Pacific Soft Contact Lens Industry Volume (K Units), by Distribution Channel 2025 & 2033
- Figure 45: Asia Pacific Soft Contact Lens Industry Revenue Share (%), by Distribution Channel 2025 & 2033
- Figure 46: Asia Pacific Soft Contact Lens Industry Volume Share (%), by Distribution Channel 2025 & 2033
- Figure 47: Asia Pacific Soft Contact Lens Industry Revenue (billion), by Country 2025 & 2033
- Figure 48: Asia Pacific Soft Contact Lens Industry Volume (K Units), by Country 2025 & 2033
- Figure 49: Asia Pacific Soft Contact Lens Industry Revenue Share (%), by Country 2025 & 2033
- Figure 50: Asia Pacific Soft Contact Lens Industry Volume Share (%), by Country 2025 & 2033
- Figure 51: South America Soft Contact Lens Industry Revenue (billion), by Product Type 2025 & 2033
- Figure 52: South America Soft Contact Lens Industry Volume (K Units), by Product Type 2025 & 2033
- Figure 53: South America Soft Contact Lens Industry Revenue Share (%), by Product Type 2025 & 2033
- Figure 54: South America Soft Contact Lens Industry Volume Share (%), by Product Type 2025 & 2033
- Figure 55: South America Soft Contact Lens Industry Revenue (billion), by Usages 2025 & 2033
- Figure 56: South America Soft Contact Lens Industry Volume (K Units), by Usages 2025 & 2033
- Figure 57: South America Soft Contact Lens Industry Revenue Share (%), by Usages 2025 & 2033
- Figure 58: South America Soft Contact Lens Industry Volume Share (%), by Usages 2025 & 2033
- Figure 59: South America Soft Contact Lens Industry Revenue (billion), by Distribution Channel 2025 & 2033
- Figure 60: South America Soft Contact Lens Industry Volume (K Units), by Distribution Channel 2025 & 2033
- Figure 61: South America Soft Contact Lens Industry Revenue Share (%), by Distribution Channel 2025 & 2033
- Figure 62: South America Soft Contact Lens Industry Volume Share (%), by Distribution Channel 2025 & 2033
- Figure 63: South America Soft Contact Lens Industry Revenue (billion), by Country 2025 & 2033
- Figure 64: South America Soft Contact Lens Industry Volume (K Units), by Country 2025 & 2033
- Figure 65: South America Soft Contact Lens Industry Revenue Share (%), by Country 2025 & 2033
- Figure 66: South America Soft Contact Lens Industry Volume Share (%), by Country 2025 & 2033
- Figure 67: Middle East and Africa Soft Contact Lens Industry Revenue (billion), by Product Type 2025 & 2033
- Figure 68: Middle East and Africa Soft Contact Lens Industry Volume (K Units), by Product Type 2025 & 2033
- Figure 69: Middle East and Africa Soft Contact Lens Industry Revenue Share (%), by Product Type 2025 & 2033
- Figure 70: Middle East and Africa Soft Contact Lens Industry Volume Share (%), by Product Type 2025 & 2033
- Figure 71: Middle East and Africa Soft Contact Lens Industry Revenue (billion), by Usages 2025 & 2033
- Figure 72: Middle East and Africa Soft Contact Lens Industry Volume (K Units), by Usages 2025 & 2033
- Figure 73: Middle East and Africa Soft Contact Lens Industry Revenue Share (%), by Usages 2025 & 2033
- Figure 74: Middle East and Africa Soft Contact Lens Industry Volume Share (%), by Usages 2025 & 2033
- Figure 75: Middle East and Africa Soft Contact Lens Industry Revenue (billion), by Distribution Channel 2025 & 2033
- Figure 76: Middle East and Africa Soft Contact Lens Industry Volume (K Units), by Distribution Channel 2025 & 2033
- Figure 77: Middle East and Africa Soft Contact Lens Industry Revenue Share (%), by Distribution Channel 2025 & 2033
- Figure 78: Middle East and Africa Soft Contact Lens Industry Volume Share (%), by Distribution Channel 2025 & 2033
- Figure 79: Middle East and Africa Soft Contact Lens Industry Revenue (billion), by Country 2025 & 2033
- Figure 80: Middle East and Africa Soft Contact Lens Industry Volume (K Units), by Country 2025 & 2033
- Figure 81: Middle East and Africa Soft Contact Lens Industry Revenue Share (%), by Country 2025 & 2033
- Figure 82: Middle East and Africa Soft Contact Lens Industry Volume Share (%), by Country 2025 & 2033
List of Tables
- Table 1: Global Soft Contact Lens Industry Revenue billion Forecast, by Product Type 2020 & 2033
- Table 2: Global Soft Contact Lens Industry Volume K Units Forecast, by Product Type 2020 & 2033
- Table 3: Global Soft Contact Lens Industry Revenue billion Forecast, by Usages 2020 & 2033
- Table 4: Global Soft Contact Lens Industry Volume K Units Forecast, by Usages 2020 & 2033
- Table 5: Global Soft Contact Lens Industry Revenue billion Forecast, by Distribution Channel 2020 & 2033
- Table 6: Global Soft Contact Lens Industry Volume K Units Forecast, by Distribution Channel 2020 & 2033
- Table 7: Global Soft Contact Lens Industry Revenue billion Forecast, by Region 2020 & 2033
- Table 8: Global Soft Contact Lens Industry Volume K Units Forecast, by Region 2020 & 2033
- Table 9: Global Soft Contact Lens Industry Revenue billion Forecast, by Product Type 2020 & 2033
- Table 10: Global Soft Contact Lens Industry Volume K Units Forecast, by Product Type 2020 & 2033
- Table 11: Global Soft Contact Lens Industry Revenue billion Forecast, by Usages 2020 & 2033
- Table 12: Global Soft Contact Lens Industry Volume K Units Forecast, by Usages 2020 & 2033
- Table 13: Global Soft Contact Lens Industry Revenue billion Forecast, by Distribution Channel 2020 & 2033
- Table 14: Global Soft Contact Lens Industry Volume K Units Forecast, by Distribution Channel 2020 & 2033
- Table 15: Global Soft Contact Lens Industry Revenue billion Forecast, by Country 2020 & 2033
- Table 16: Global Soft Contact Lens Industry Volume K Units Forecast, by Country 2020 & 2033
- Table 17: United States Soft Contact Lens Industry Revenue (billion) Forecast, by Application 2020 & 2033
- Table 18: United States Soft Contact Lens Industry Volume (K Units) Forecast, by Application 2020 & 2033
- Table 19: Canada Soft Contact Lens Industry Revenue (billion) Forecast, by Application 2020 & 2033
- Table 20: Canada Soft Contact Lens Industry Volume (K Units) Forecast, by Application 2020 & 2033
- Table 21: Mexico Soft Contact Lens Industry Revenue (billion) Forecast, by Application 2020 & 2033
- Table 22: Mexico Soft Contact Lens Industry Volume (K Units) Forecast, by Application 2020 & 2033
- Table 23: Rest of North America Soft Contact Lens Industry Revenue (billion) Forecast, by Application 2020 & 2033
- Table 24: Rest of North America Soft Contact Lens Industry Volume (K Units) Forecast, by Application 2020 & 2033
- Table 25: Global Soft Contact Lens Industry Revenue billion Forecast, by Product Type 2020 & 2033
- Table 26: Global Soft Contact Lens Industry Volume K Units Forecast, by Product Type 2020 & 2033
- Table 27: Global Soft Contact Lens Industry Revenue billion Forecast, by Usages 2020 & 2033
- Table 28: Global Soft Contact Lens Industry Volume K Units Forecast, by Usages 2020 & 2033
- Table 29: Global Soft Contact Lens Industry Revenue billion Forecast, by Distribution Channel 2020 & 2033
- Table 30: Global Soft Contact Lens Industry Volume K Units Forecast, by Distribution Channel 2020 & 2033
- Table 31: Global Soft Contact Lens Industry Revenue billion Forecast, by Country 2020 & 2033
- Table 32: Global Soft Contact Lens Industry Volume K Units Forecast, by Country 2020 & 2033
- Table 33: United Kingdom Soft Contact Lens Industry Revenue (billion) Forecast, by Application 2020 & 2033
- Table 34: United Kingdom Soft Contact Lens Industry Volume (K Units) Forecast, by Application 2020 & 2033
- Table 35: Germany Soft Contact Lens Industry Revenue (billion) Forecast, by Application 2020 & 2033
- Table 36: Germany Soft Contact Lens Industry Volume (K Units) Forecast, by Application 2020 & 2033
- Table 37: France Soft Contact Lens Industry Revenue (billion) Forecast, by Application 2020 & 2033
- Table 38: France Soft Contact Lens Industry Volume (K Units) Forecast, by Application 2020 & 2033
- Table 39: Italy Soft Contact Lens Industry Revenue (billion) Forecast, by Application 2020 & 2033
- Table 40: Italy Soft Contact Lens Industry Volume (K Units) Forecast, by Application 2020 & 2033
- Table 41: Russia Soft Contact Lens Industry Revenue (billion) Forecast, by Application 2020 & 2033
- Table 42: Russia Soft Contact Lens Industry Volume (K Units) Forecast, by Application 2020 & 2033
- Table 43: Rest of Europe Soft Contact Lens Industry Revenue (billion) Forecast, by Application 2020 & 2033
- Table 44: Rest of Europe Soft Contact Lens Industry Volume (K Units) Forecast, by Application 2020 & 2033
- Table 45: Global Soft Contact Lens Industry Revenue billion Forecast, by Product Type 2020 & 2033
- Table 46: Global Soft Contact Lens Industry Volume K Units Forecast, by Product Type 2020 & 2033
- Table 47: Global Soft Contact Lens Industry Revenue billion Forecast, by Usages 2020 & 2033
- Table 48: Global Soft Contact Lens Industry Volume K Units Forecast, by Usages 2020 & 2033
- Table 49: Global Soft Contact Lens Industry Revenue billion Forecast, by Distribution Channel 2020 & 2033
- Table 50: Global Soft Contact Lens Industry Volume K Units Forecast, by Distribution Channel 2020 & 2033
- Table 51: Global Soft Contact Lens Industry Revenue billion Forecast, by Country 2020 & 2033
- Table 52: Global Soft Contact Lens Industry Volume K Units Forecast, by Country 2020 & 2033
- Table 53: China Soft Contact Lens Industry Revenue (billion) Forecast, by Application 2020 & 2033
- Table 54: China Soft Contact Lens Industry Volume (K Units) Forecast, by Application 2020 & 2033
- Table 55: Japan Soft Contact Lens Industry Revenue (billion) Forecast, by Application 2020 & 2033
- Table 56: Japan Soft Contact Lens Industry Volume (K Units) Forecast, by Application 2020 & 2033
- Table 57: India Soft Contact Lens Industry Revenue (billion) Forecast, by Application 2020 & 2033
- Table 58: India Soft Contact Lens Industry Volume (K Units) Forecast, by Application 2020 & 2033
- Table 59: Australia Soft Contact Lens Industry Revenue (billion) Forecast, by Application 2020 & 2033
- Table 60: Australia Soft Contact Lens Industry Volume (K Units) Forecast, by Application 2020 & 2033
- Table 61: Rest of Asia Pacific Soft Contact Lens Industry Revenue (billion) Forecast, by Application 2020 & 2033
- Table 62: Rest of Asia Pacific Soft Contact Lens Industry Volume (K Units) Forecast, by Application 2020 & 2033
- Table 63: Global Soft Contact Lens Industry Revenue billion Forecast, by Product Type 2020 & 2033
- Table 64: Global Soft Contact Lens Industry Volume K Units Forecast, by Product Type 2020 & 2033
- Table 65: Global Soft Contact Lens Industry Revenue billion Forecast, by Usages 2020 & 2033
- Table 66: Global Soft Contact Lens Industry Volume K Units Forecast, by Usages 2020 & 2033
- Table 67: Global Soft Contact Lens Industry Revenue billion Forecast, by Distribution Channel 2020 & 2033
- Table 68: Global Soft Contact Lens Industry Volume K Units Forecast, by Distribution Channel 2020 & 2033
- Table 69: Global Soft Contact Lens Industry Revenue billion Forecast, by Country 2020 & 2033
- Table 70: Global Soft Contact Lens Industry Volume K Units Forecast, by Country 2020 & 2033
- Table 71: Brazil Soft Contact Lens Industry Revenue (billion) Forecast, by Application 2020 & 2033
- Table 72: Brazil Soft Contact Lens Industry Volume (K Units) Forecast, by Application 2020 & 2033
- Table 73: Argentina Soft Contact Lens Industry Revenue (billion) Forecast, by Application 2020 & 2033
- Table 74: Argentina Soft Contact Lens Industry Volume (K Units) Forecast, by Application 2020 & 2033
- Table 75: Rest of South America Soft Contact Lens Industry Revenue (billion) Forecast, by Application 2020 & 2033
- Table 76: Rest of South America Soft Contact Lens Industry Volume (K Units) Forecast, by Application 2020 & 2033
- Table 77: Global Soft Contact Lens Industry Revenue billion Forecast, by Product Type 2020 & 2033
- Table 78: Global Soft Contact Lens Industry Volume K Units Forecast, by Product Type 2020 & 2033
- Table 79: Global Soft Contact Lens Industry Revenue billion Forecast, by Usages 2020 & 2033
- Table 80: Global Soft Contact Lens Industry Volume K Units Forecast, by Usages 2020 & 2033
- Table 81: Global Soft Contact Lens Industry Revenue billion Forecast, by Distribution Channel 2020 & 2033
- Table 82: Global Soft Contact Lens Industry Volume K Units Forecast, by Distribution Channel 2020 & 2033
- Table 83: Global Soft Contact Lens Industry Revenue billion Forecast, by Country 2020 & 2033
- Table 84: Global Soft Contact Lens Industry Volume K Units Forecast, by Country 2020 & 2033
- Table 85: South Africa Soft Contact Lens Industry Revenue (billion) Forecast, by Application 2020 & 2033
- Table 86: South Africa Soft Contact Lens Industry Volume (K Units) Forecast, by Application 2020 & 2033
- Table 87: United Arab Emirates Soft Contact Lens Industry Revenue (billion) Forecast, by Application 2020 & 2033
- Table 88: United Arab Emirates Soft Contact Lens Industry Volume (K Units) Forecast, by Application 2020 & 2033
- Table 89: Rest of Middle East and Africa Soft Contact Lens Industry Revenue (billion) Forecast, by Application 2020 & 2033
- Table 90: Rest of Middle East and Africa Soft Contact Lens Industry Volume (K Units) Forecast, by Application 2020 & 2033
Frequently Asked Questions
1. What is the projected Compound Annual Growth Rate (CAGR) of the Soft Contact Lens Industry?
The projected CAGR is approximately 6.21%.
2. Which companies are prominent players in the Soft Contact Lens Industry?
Key companies in the market include Zeiss Group, Novartis AG, Essilor International SA, The Cooper Companies, Johnson & Johnson Vision Care Inc *List Not Exhaustive, Bausch Health Companies Inc, Hoya Corporation.
3. What are the main segments of the Soft Contact Lens Industry?
The market segments include Product Type, Usages, Distribution Channel.
4. Can you provide details about the market size?
The market size is estimated to be USD 97.6 billion as of 2022.
5. What are some drivers contributing to market growth?
Increasing Sports Participation is Boosting the Market Growth; Increasing Innovation and Upgradation in Merchandizing Products.
6. What are the notable trends driving market growth?
Rigid Gas Permeable Contact Lenses Segment is Expected to Exhibit the Fastest Growth Rate over the Forecast Period.
7. Are there any restraints impacting market growth?
Availability of Counterfeit Sports Merchandise Products.
8. Can you provide examples of recent developments in the market?
N/A
9. What pricing options are available for accessing the report?
Pricing options include single-user, multi-user, and enterprise licenses priced at USD 4750, USD 5250, and USD 8750 respectively.
10. Is the market size provided in terms of value or volume?
The market size is provided in terms of value, measured in billion and volume, measured in K Units.
11. Are there any specific market keywords associated with the report?
Yes, the market keyword associated with the report is "Soft Contact Lens Industry," which aids in identifying and referencing the specific market segment covered.
12. How do I determine which pricing option suits my needs best?
The pricing options vary based on user requirements and access needs. Individual users may opt for single-user licenses, while businesses requiring broader access may choose multi-user or enterprise licenses for cost-effective access to the report.
13. Are there any additional resources or data provided in the Soft Contact Lens Industry report?
While the report offers comprehensive insights, it's advisable to review the specific contents or supplementary materials provided to ascertain if additional resources or data are available.
14. How can I stay updated on further developments or reports in the Soft Contact Lens Industry?
To stay informed about further developments, trends, and reports in the Soft Contact Lens Industry, consider subscribing to industry newsletters, following relevant companies and organizations, or regularly checking reputable industry news sources and publications.
Methodology
Step 1 - Identification of Relevant Samples Size from Population Database


Step 2 - Approaches for Defining Global Market Size (Value, Volume* & Price*)

Note*: In applicable scenarios
Step 3 - Data Sources
Primary Research
- Web Analytics
- Survey Reports
- Research Institute
- Latest Research Reports
- Opinion Leaders
Secondary Research
- Annual Reports
- White Paper
- Latest Press Release
- Industry Association
- Paid Database
- Investor Presentations

Step 4 - Data Triangulation
Involves using different sources of information in order to increase the validity of a study
These sources are likely to be stakeholders in a program - participants, other researchers, program staff, other community members, and so on.
Then we put all data in single framework & apply various statistical tools to find out the dynamic on the market.
During the analysis stage, feedback from the stakeholder groups would be compared to determine areas of agreement as well as areas of divergence