

Key Insights
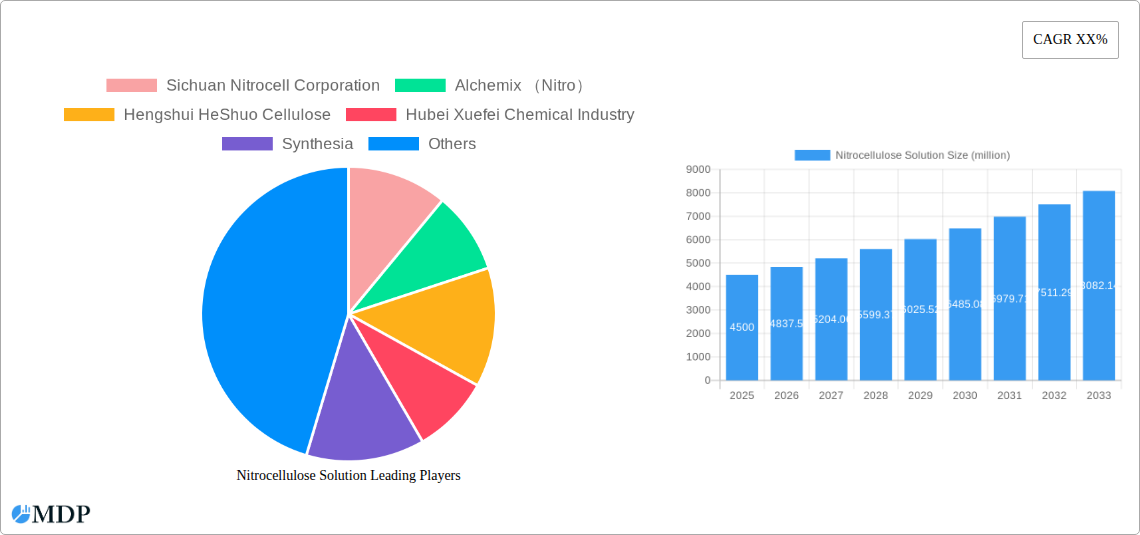
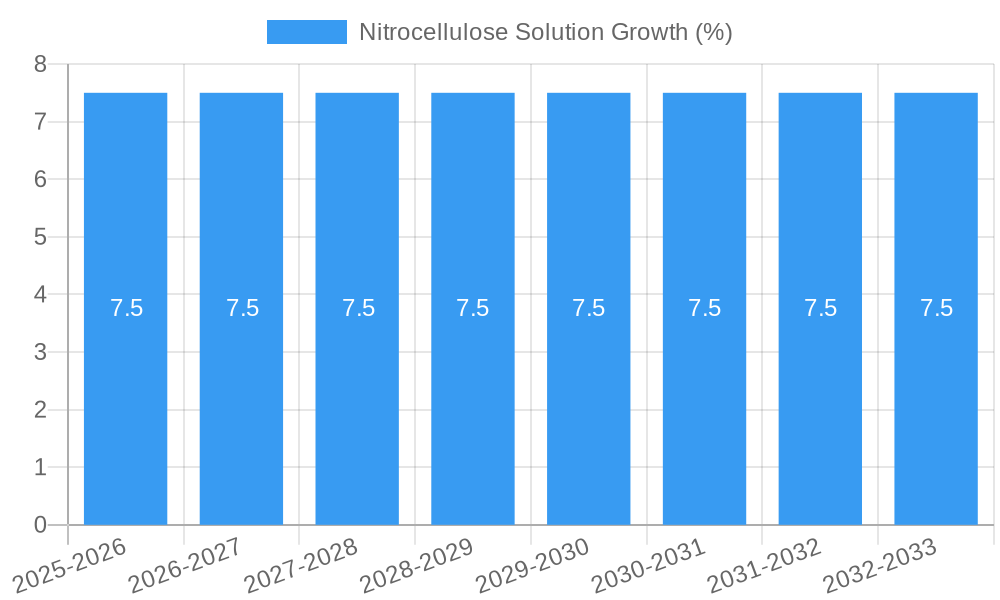
The global Nitrocellulose Solution market is projected to reach a significant valuation, driven by robust demand from key end-use industries such as coatings, printing inks, and the plastics sector. Estimated to be valued at approximately $4,500 million in 2025, the market is poised for substantial growth, anticipating a Compound Annual Growth Rate (CAGR) of around 7.5% over the forecast period from 2025 to 2033. This expansion is fueled by the inherent properties of nitrocellulose, including its rapid drying, excellent adhesion, and high gloss finish, making it a preferred choice for a wide array of applications. The increasing industrialization and urbanization worldwide are further stimulating the demand for paints, coatings, and printed materials, thereby acting as primary growth catalysts for the nitrocellulose solution market. Emerging economies, with their burgeoning manufacturing sectors, are expected to contribute significantly to this upward trajectory, presenting lucrative opportunities for market players.
Despite the promising outlook, the nitrocellulose solution market faces certain restraints, primarily related to environmental regulations and the availability of substitute materials. Concerns regarding the flammability and toxicity of nitrocellulose, coupled with stricter environmental compliance measures, necessitate continuous innovation in product development and manufacturing processes. However, the market is also witnessing key trends that are shaping its future. The development of eco-friendly nitrocellulose formulations and advancements in application technologies are gaining traction. Furthermore, the growing preference for high-performance coatings in automotive and furniture industries, along with the expanding use of nitrocellulose in specialized printing inks for packaging and labels, are expected to propel market growth. The market is broadly segmented by application, with coatings and paints representing the largest share, followed by printing inks and the plastic industry. The "H Type" (Nitrogen ≥ 11.5%) segment is anticipated to dominate the market due to its superior film-forming capabilities and versatility.
Nitrocellulose Solution Market Report: Dynamics, Trends, and Strategic Outlook (2019-2033)
This comprehensive report provides an in-depth analysis of the global Nitrocellulose Solution market, forecasting its trajectory from 2025 to 2033, with historical data spanning 2019-2024 and a base year of 2025. We delve into market dynamics, industry trends, leading segments, product developments, growth drivers, challenges, opportunities, key players, and strategic outlooks, offering actionable insights for industry stakeholders. This report is meticulously crafted for immediate use without further modification.
Nitrocellulose Solution Market Dynamics & Concentration
The global Nitrocellulose Solution market is characterized by a moderate concentration, with key players like Sichuan Nitrocell Corporation and Alchemix (Nitro) holding significant market shares, estimated to be over 15% and 12% respectively. Innovation remains a primary driver, fueled by advancements in formulation technologies to enhance performance characteristics such as faster drying times, improved adhesion, and reduced environmental impact. Regulatory frameworks, particularly concerning volatile organic compounds (VOCs) and safety standards, are increasingly influencing product development and market access. For instance, stringent environmental regulations in North America and Europe are pushing manufacturers towards low-VOC nitrocellulose solutions. Product substitutes, while present in niche applications, have not significantly eroded the dominance of nitrocellulose due to its unique combination of properties, including excellent film formation, gloss, and hardness. End-user trends show a growing demand for high-performance coatings in automotive and furniture industries, alongside a resurgence in printing inks for specialized packaging. Mergers and acquisition (M&A) activities, while infrequent, have been strategic, aiming to consolidate market presence and expand product portfolios. We estimate a total of approximately 5 significant M&A deals in the historical period (2019-2024) valued at over 50 million each.
Nitrocellulose Solution Industry Trends & Analysis
The Nitrocellulose Solution industry is poised for robust growth, driven by a confluence of factors. The CAGR for the forecast period (2025-2033) is projected at a healthy 5.8%, indicating sustained expansion. Market penetration is high in developed regions, with emerging economies presenting significant untapped potential. A primary growth driver is the escalating demand for high-quality coatings and paints across diverse sectors. The automotive industry, in particular, relies heavily on nitrocellulose-based lacquers for their superior finish and durability, contributing an estimated 40% of the total market revenue. Similarly, the furniture industry leverages nitrocellulose solutions for their excellent aesthetic properties and rapid curing capabilities, accounting for approximately 25% of the market.
The printing inks segment is another significant contributor, driven by the demand for vibrant, durable inks in packaging and specialty printing applications. This segment is expected to grow at a CAGR of 6.2% over the forecast period. The plastic industry also utilizes nitrocellulose solutions for various applications, including protective coatings and decorative finishes, representing around 15% of the market.
Technological disruptions are primarily focused on enhancing the sustainability profile of nitrocellulose. Innovations in manufacturing processes are aimed at reducing energy consumption and waste generation. Furthermore, research into bio-based nitrocellulose is gaining traction, aligning with global sustainability initiatives and consumer preferences for eco-friendly products. The development of waterborne nitrocellulose dispersions is also a key trend, addressing the need for lower VOC emissions.
Consumer preferences are increasingly tilting towards products that offer superior performance, aesthetic appeal, and environmental compliance. This has spurred manufacturers to invest in R&D to develop advanced nitrocellulose formulations that meet these evolving demands. The competitive landscape remains dynamic, with established players like Sichuan Nitrocell Corporation and Alchemix (Nitro) continuously innovating to maintain their market leadership. New entrants, particularly from Asia, are emerging, driven by lower manufacturing costs and growing domestic demand. The market penetration of nitrocellulose solutions is estimated to be over 70% in the coatings and paints sector globally. The market size is expected to reach over 5,000 million by 2025.
Leading Markets & Segments in Nitrocellulose Solution
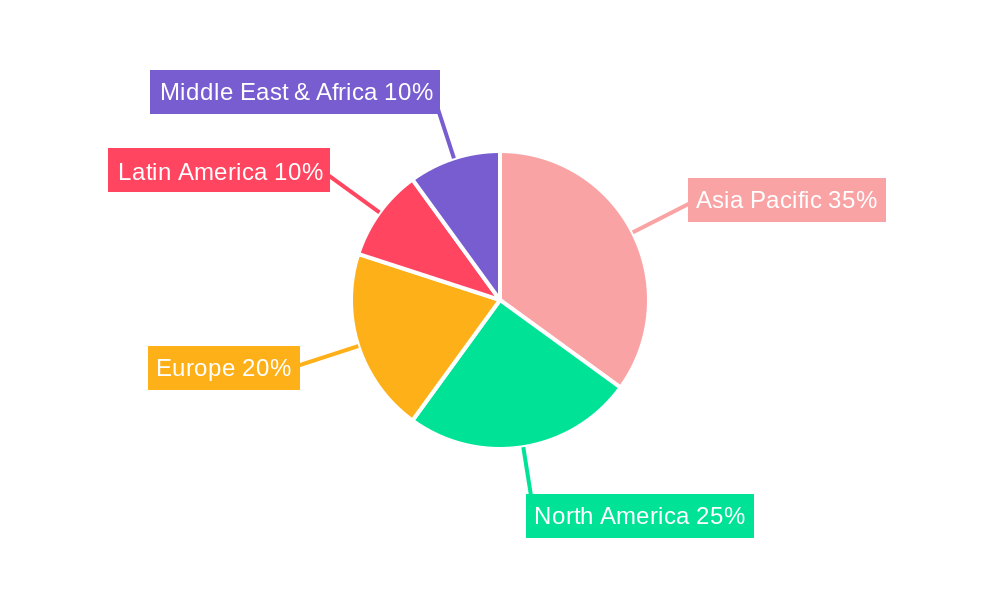
The Nitrocellulose Solution market exhibits distinct regional and segmental leadership. Geographically, Asia Pacific is the dominant region, driven by its burgeoning manufacturing sector and increasing disposable incomes, contributing an estimated 35% of global demand. China, in particular, stands out as a leading country due to its extensive manufacturing base in coatings, inks, and plastics. The Application segment of Coatings and Paints commands the largest market share, estimated at over 45%, owing to its widespread use in automotive, furniture, and industrial coatings. Within this segment, automotive coatings represent the largest sub-segment.
The Type segment of H Type (Nitrogen≥11.5%) is more prevalent due to its superior film-forming properties and suitability for high-performance applications. This type accounts for an estimated 60% of the total market volume. The Printing Inks segment follows with a significant share of approximately 30%, propelled by demand in flexible packaging and publication printing. The Plastic Industry contributes around 20%, with applications in decorative laminates and protective films. The Others segment, encompassing applications in explosives and cosmetics, holds a smaller but growing share. The L Type (Nitrogen is projected to see steady growth, particularly in applications where lower viscosity and faster drying are paramount.
Nitrocellulose Solution Product Developments
Product innovation in the Nitrocellulose Solution market is a critical factor for competitive advantage. Recent developments focus on enhancing sustainability and performance. Manufacturers are introducing low-VOC and waterborne nitrocellulose dispersions that meet stringent environmental regulations, such as those in Europe and North America. These advancements improve application efficiency and reduce health hazards. For instance, GRN Cellulose has been at the forefront of developing eco-friendly nitrocellulose binders for printing inks. Synthesia has focused on high-purity nitrocellulose grades for specialized industrial applications. These innovations are aimed at expanding the application range and meeting evolving consumer and regulatory demands, solidifying nitrocellulose's position against alternative materials.
Key Drivers of Nitrocellulose Solution Growth
Several key drivers are propelling the growth of the Nitrocellulose Solution market. Technologically, ongoing advancements in formulation and manufacturing processes are leading to the development of higher-performance, more sustainable nitrocellulose solutions. Economically, the robust growth of end-use industries such as automotive, furniture, and packaging, particularly in emerging economies, is creating sustained demand. Regulatory factors, while sometimes posing challenges, are also driving innovation towards eco-friendlier products, opening new market opportunities. For example, stricter regulations on VOC emissions are pushing the adoption of low-VOC nitrocellulose solutions, a market expected to grow by 8% annually. The inherent properties of nitrocellulose, such as its fast drying time, excellent hardness, and gloss, continue to make it an indispensable material in many applications.
Challenges in the Nitrocellulose Solution Market
Despite the positive growth outlook, the Nitrocellulose Solution market faces several challenges. Regulatory hurdles, particularly regarding the handling and transportation of flammable nitrocellulose, can increase operational costs and compliance burdens. Supply chain disruptions, exacerbated by geopolitical events and raw material price volatility, pose a significant risk, potentially impacting production volumes and lead times. Competitive pressures from alternative materials, although less impactful for core applications, necessitate continuous innovation to maintain market share. For example, fluctuations in the price of cotton linters, a key raw material, can lead to price instability for nitrocellulose, impacting its cost-competitiveness. The overall market is estimated to face a 5% impact on production capacity due to these disruptions.
Emerging Opportunities in Nitrocellulose Solution
The Nitrocellulose Solution market presents several emerging opportunities for growth. Technological breakthroughs in bio-based nitrocellulose production offer a path towards enhanced sustainability and a reduced carbon footprint, appealing to environmentally conscious consumers and businesses. Strategic partnerships between manufacturers and end-users can lead to the co-development of tailored solutions for specific applications, such as advanced coatings for electric vehicles. Market expansion into underpenetrated regions in Southeast Asia and Africa, driven by industrialization and infrastructure development, represents significant untapped potential. The growing demand for specialized printing inks for high-value packaging also presents a lucrative niche.
Leading Players in the Nitrocellulose Solution Sector
- Sichuan Nitrocell Corporation
- Alchemix (Nitro)
- Hengshui HeShuo Cellulose
- Hubei Xuefei Chemical Industry
- Synthesia
- GRN Cellulose
- Nitrocellulose Group
Key Milestones in Nitrocellulose Solution Industry
- 2019: Increased focus on R&D for low-VOC nitrocellulose formulations to meet evolving environmental standards.
- 2020: Launch of novel waterborne nitrocellulose dispersions by several key players, targeting the architectural coatings market.
- 2021: Strategic acquisition of a smaller nitrocellulose producer by Alchemix (Nitro) to expand its production capacity in Asia.
- 2022: Significant investment in research for bio-based nitrocellulose alternatives by Hubei Xuefei Chemical Industry.
- 2023: Enhanced safety protocols and logistics optimization by Nitrocellulose Group to mitigate supply chain risks.
- 2024: Introduction of high-purity, custom-formulated nitrocellulose solutions for niche industrial applications by GRN Cellulose.
Strategic Outlook for Nitrocellulose Solution Market
The strategic outlook for the Nitrocellulose Solution market is positive, with growth accelerators centered on innovation, sustainability, and market expansion. Continued investment in R&D will be crucial to develop advanced, eco-friendly nitrocellulose solutions that address global environmental concerns and meet stringent regulatory requirements. Leveraging the increasing demand for high-performance coatings and inks in rapidly developing economies offers substantial growth potential. Strategic partnerships and potential consolidation will enable companies to strengthen their market positions, optimize supply chains, and enhance their technological capabilities. The focus on sustainable sourcing of raw materials and the development of biodegradable nitrocellulose derivatives will be key to long-term success and market leadership.
Nitrocellulose Solution Segmentation
-
1. Application
- 1.1. Coatings and Pants
- 1.2. Printing Inks
- 1.3. Plastic Industry
- 1.4. Others
-
2. Types
- 2.1. H Type (Nitrogen≥11.5%)
- 2.2. L Type (Nitrogen<11.5%)
Nitrocellulose Solution Segmentation By Geography
-
1. North America
- 1.1. United States
- 1.2. Canada
- 1.3. Mexico
-
2. South America
- 2.1. Brazil
- 2.2. Argentina
- 2.3. Rest of South America
-
3. Europe
- 3.1. United Kingdom
- 3.2. Germany
- 3.3. France
- 3.4. Italy
- 3.5. Spain
- 3.6. Russia
- 3.7. Benelux
- 3.8. Nordics
- 3.9. Rest of Europe
-
4. Middle East & Africa
- 4.1. Turkey
- 4.2. Israel
- 4.3. GCC
- 4.4. North Africa
- 4.5. South Africa
- 4.6. Rest of Middle East & Africa
-
5. Asia Pacific
- 5.1. China
- 5.2. India
- 5.3. Japan
- 5.4. South Korea
- 5.5. ASEAN
- 5.6. Oceania
- 5.7. Rest of Asia Pacific
Nitrocellulose Solution REPORT HIGHLIGHTS
| Aspects | Details |
|---|---|
| Study Period | 2019-2033 |
| Base Year | 2024 |
| Estimated Year | 2025 |
| Forecast Period | 2025-2033 |
| Historical Period | 2019-2024 |
| Growth Rate | CAGR of XX% from 2019-2033 |
| Segmentation |
|
Table of Contents
- 1. Introduction
- 1.1. Research Scope
- 1.2. Market Segmentation
- 1.3. Research Methodology
- 1.4. Definitions and Assumptions
- 2. Executive Summary
- 2.1. Introduction
- 3. Market Dynamics
- 3.1. Introduction
- 3.2. Market Drivers
- 3.3. Market Restrains
- 3.4. Market Trends
- 4. Market Factor Analysis
- 4.1. Porters Five Forces
- 4.2. Supply/Value Chain
- 4.3. PESTEL analysis
- 4.4. Market Entropy
- 4.5. Patent/Trademark Analysis
- 5. Global Nitrocellulose Solution Analysis, Insights and Forecast, 2019-2031
- 5.1. Market Analysis, Insights and Forecast - by Application
- 5.1.1. Coatings and Pants
- 5.1.2. Printing Inks
- 5.1.3. Plastic Industry
- 5.1.4. Others
- 5.2. Market Analysis, Insights and Forecast - by Types
- 5.2.1. H Type (Nitrogen≥11.5%)
- 5.2.2. L Type (Nitrogen<11.5%)
- 5.3. Market Analysis, Insights and Forecast - by Region
- 5.3.1. North America
- 5.3.2. South America
- 5.3.3. Europe
- 5.3.4. Middle East & Africa
- 5.3.5. Asia Pacific
- 5.1. Market Analysis, Insights and Forecast - by Application
- 6. North America Nitrocellulose Solution Analysis, Insights and Forecast, 2019-2031
- 6.1. Market Analysis, Insights and Forecast - by Application
- 6.1.1. Coatings and Pants
- 6.1.2. Printing Inks
- 6.1.3. Plastic Industry
- 6.1.4. Others
- 6.2. Market Analysis, Insights and Forecast - by Types
- 6.2.1. H Type (Nitrogen≥11.5%)
- 6.2.2. L Type (Nitrogen<11.5%)
- 6.1. Market Analysis, Insights and Forecast - by Application
- 7. South America Nitrocellulose Solution Analysis, Insights and Forecast, 2019-2031
- 7.1. Market Analysis, Insights and Forecast - by Application
- 7.1.1. Coatings and Pants
- 7.1.2. Printing Inks
- 7.1.3. Plastic Industry
- 7.1.4. Others
- 7.2. Market Analysis, Insights and Forecast - by Types
- 7.2.1. H Type (Nitrogen≥11.5%)
- 7.2.2. L Type (Nitrogen<11.5%)
- 7.1. Market Analysis, Insights and Forecast - by Application
- 8. Europe Nitrocellulose Solution Analysis, Insights and Forecast, 2019-2031
- 8.1. Market Analysis, Insights and Forecast - by Application
- 8.1.1. Coatings and Pants
- 8.1.2. Printing Inks
- 8.1.3. Plastic Industry
- 8.1.4. Others
- 8.2. Market Analysis, Insights and Forecast - by Types
- 8.2.1. H Type (Nitrogen≥11.5%)
- 8.2.2. L Type (Nitrogen<11.5%)
- 8.1. Market Analysis, Insights and Forecast - by Application
- 9. Middle East & Africa Nitrocellulose Solution Analysis, Insights and Forecast, 2019-2031
- 9.1. Market Analysis, Insights and Forecast - by Application
- 9.1.1. Coatings and Pants
- 9.1.2. Printing Inks
- 9.1.3. Plastic Industry
- 9.1.4. Others
- 9.2. Market Analysis, Insights and Forecast - by Types
- 9.2.1. H Type (Nitrogen≥11.5%)
- 9.2.2. L Type (Nitrogen<11.5%)
- 9.1. Market Analysis, Insights and Forecast - by Application
- 10. Asia Pacific Nitrocellulose Solution Analysis, Insights and Forecast, 2019-2031
- 10.1. Market Analysis, Insights and Forecast - by Application
- 10.1.1. Coatings and Pants
- 10.1.2. Printing Inks
- 10.1.3. Plastic Industry
- 10.1.4. Others
- 10.2. Market Analysis, Insights and Forecast - by Types
- 10.2.1. H Type (Nitrogen≥11.5%)
- 10.2.2. L Type (Nitrogen<11.5%)
- 10.1. Market Analysis, Insights and Forecast - by Application
- 11. Competitive Analysis
- 11.1. Global Market Share Analysis 2024
- 11.2. Company Profiles
- 11.2.1 Sichuan Nitrocell Corporation
- 11.2.1.1. Overview
- 11.2.1.2. Products
- 11.2.1.3. SWOT Analysis
- 11.2.1.4. Recent Developments
- 11.2.1.5. Financials (Based on Availability)
- 11.2.2 Alchemix (Nitro)
- 11.2.2.1. Overview
- 11.2.2.2. Products
- 11.2.2.3. SWOT Analysis
- 11.2.2.4. Recent Developments
- 11.2.2.5. Financials (Based on Availability)
- 11.2.3 Hengshui HeShuo Cellulose
- 11.2.3.1. Overview
- 11.2.3.2. Products
- 11.2.3.3. SWOT Analysis
- 11.2.3.4. Recent Developments
- 11.2.3.5. Financials (Based on Availability)
- 11.2.4 Hubei Xuefei Chemical Industry
- 11.2.4.1. Overview
- 11.2.4.2. Products
- 11.2.4.3. SWOT Analysis
- 11.2.4.4. Recent Developments
- 11.2.4.5. Financials (Based on Availability)
- 11.2.5 Synthesia
- 11.2.5.1. Overview
- 11.2.5.2. Products
- 11.2.5.3. SWOT Analysis
- 11.2.5.4. Recent Developments
- 11.2.5.5. Financials (Based on Availability)
- 11.2.6 GRN Cellulose
- 11.2.6.1. Overview
- 11.2.6.2. Products
- 11.2.6.3. SWOT Analysis
- 11.2.6.4. Recent Developments
- 11.2.6.5. Financials (Based on Availability)
- 11.2.7 Nitrocellulose Group
- 11.2.7.1. Overview
- 11.2.7.2. Products
- 11.2.7.3. SWOT Analysis
- 11.2.7.4. Recent Developments
- 11.2.7.5. Financials (Based on Availability)
- 11.2.1 Sichuan Nitrocell Corporation
List of Figures
- Figure 1: Global Nitrocellulose Solution Revenue Breakdown (million, %) by Region 2024 & 2032
- Figure 2: Global Nitrocellulose Solution Volume Breakdown (K, %) by Region 2024 & 2032
- Figure 3: North America Nitrocellulose Solution Revenue (million), by Application 2024 & 2032
- Figure 4: North America Nitrocellulose Solution Volume (K), by Application 2024 & 2032
- Figure 5: North America Nitrocellulose Solution Revenue Share (%), by Application 2024 & 2032
- Figure 6: North America Nitrocellulose Solution Volume Share (%), by Application 2024 & 2032
- Figure 7: North America Nitrocellulose Solution Revenue (million), by Types 2024 & 2032
- Figure 8: North America Nitrocellulose Solution Volume (K), by Types 2024 & 2032
- Figure 9: North America Nitrocellulose Solution Revenue Share (%), by Types 2024 & 2032
- Figure 10: North America Nitrocellulose Solution Volume Share (%), by Types 2024 & 2032
- Figure 11: North America Nitrocellulose Solution Revenue (million), by Country 2024 & 2032
- Figure 12: North America Nitrocellulose Solution Volume (K), by Country 2024 & 2032
- Figure 13: North America Nitrocellulose Solution Revenue Share (%), by Country 2024 & 2032
- Figure 14: North America Nitrocellulose Solution Volume Share (%), by Country 2024 & 2032
- Figure 15: South America Nitrocellulose Solution Revenue (million), by Application 2024 & 2032
- Figure 16: South America Nitrocellulose Solution Volume (K), by Application 2024 & 2032
- Figure 17: South America Nitrocellulose Solution Revenue Share (%), by Application 2024 & 2032
- Figure 18: South America Nitrocellulose Solution Volume Share (%), by Application 2024 & 2032
- Figure 19: South America Nitrocellulose Solution Revenue (million), by Types 2024 & 2032
- Figure 20: South America Nitrocellulose Solution Volume (K), by Types 2024 & 2032
- Figure 21: South America Nitrocellulose Solution Revenue Share (%), by Types 2024 & 2032
- Figure 22: South America Nitrocellulose Solution Volume Share (%), by Types 2024 & 2032
- Figure 23: South America Nitrocellulose Solution Revenue (million), by Country 2024 & 2032
- Figure 24: South America Nitrocellulose Solution Volume (K), by Country 2024 & 2032
- Figure 25: South America Nitrocellulose Solution Revenue Share (%), by Country 2024 & 2032
- Figure 26: South America Nitrocellulose Solution Volume Share (%), by Country 2024 & 2032
- Figure 27: Europe Nitrocellulose Solution Revenue (million), by Application 2024 & 2032
- Figure 28: Europe Nitrocellulose Solution Volume (K), by Application 2024 & 2032
- Figure 29: Europe Nitrocellulose Solution Revenue Share (%), by Application 2024 & 2032
- Figure 30: Europe Nitrocellulose Solution Volume Share (%), by Application 2024 & 2032
- Figure 31: Europe Nitrocellulose Solution Revenue (million), by Types 2024 & 2032
- Figure 32: Europe Nitrocellulose Solution Volume (K), by Types 2024 & 2032
- Figure 33: Europe Nitrocellulose Solution Revenue Share (%), by Types 2024 & 2032
- Figure 34: Europe Nitrocellulose Solution Volume Share (%), by Types 2024 & 2032
- Figure 35: Europe Nitrocellulose Solution Revenue (million), by Country 2024 & 2032
- Figure 36: Europe Nitrocellulose Solution Volume (K), by Country 2024 & 2032
- Figure 37: Europe Nitrocellulose Solution Revenue Share (%), by Country 2024 & 2032
- Figure 38: Europe Nitrocellulose Solution Volume Share (%), by Country 2024 & 2032
- Figure 39: Middle East & Africa Nitrocellulose Solution Revenue (million), by Application 2024 & 2032
- Figure 40: Middle East & Africa Nitrocellulose Solution Volume (K), by Application 2024 & 2032
- Figure 41: Middle East & Africa Nitrocellulose Solution Revenue Share (%), by Application 2024 & 2032
- Figure 42: Middle East & Africa Nitrocellulose Solution Volume Share (%), by Application 2024 & 2032
- Figure 43: Middle East & Africa Nitrocellulose Solution Revenue (million), by Types 2024 & 2032
- Figure 44: Middle East & Africa Nitrocellulose Solution Volume (K), by Types 2024 & 2032
- Figure 45: Middle East & Africa Nitrocellulose Solution Revenue Share (%), by Types 2024 & 2032
- Figure 46: Middle East & Africa Nitrocellulose Solution Volume Share (%), by Types 2024 & 2032
- Figure 47: Middle East & Africa Nitrocellulose Solution Revenue (million), by Country 2024 & 2032
- Figure 48: Middle East & Africa Nitrocellulose Solution Volume (K), by Country 2024 & 2032
- Figure 49: Middle East & Africa Nitrocellulose Solution Revenue Share (%), by Country 2024 & 2032
- Figure 50: Middle East & Africa Nitrocellulose Solution Volume Share (%), by Country 2024 & 2032
- Figure 51: Asia Pacific Nitrocellulose Solution Revenue (million), by Application 2024 & 2032
- Figure 52: Asia Pacific Nitrocellulose Solution Volume (K), by Application 2024 & 2032
- Figure 53: Asia Pacific Nitrocellulose Solution Revenue Share (%), by Application 2024 & 2032
- Figure 54: Asia Pacific Nitrocellulose Solution Volume Share (%), by Application 2024 & 2032
- Figure 55: Asia Pacific Nitrocellulose Solution Revenue (million), by Types 2024 & 2032
- Figure 56: Asia Pacific Nitrocellulose Solution Volume (K), by Types 2024 & 2032
- Figure 57: Asia Pacific Nitrocellulose Solution Revenue Share (%), by Types 2024 & 2032
- Figure 58: Asia Pacific Nitrocellulose Solution Volume Share (%), by Types 2024 & 2032
- Figure 59: Asia Pacific Nitrocellulose Solution Revenue (million), by Country 2024 & 2032
- Figure 60: Asia Pacific Nitrocellulose Solution Volume (K), by Country 2024 & 2032
- Figure 61: Asia Pacific Nitrocellulose Solution Revenue Share (%), by Country 2024 & 2032
- Figure 62: Asia Pacific Nitrocellulose Solution Volume Share (%), by Country 2024 & 2032
List of Tables
- Table 1: Global Nitrocellulose Solution Revenue million Forecast, by Region 2019 & 2032
- Table 2: Global Nitrocellulose Solution Volume K Forecast, by Region 2019 & 2032
- Table 3: Global Nitrocellulose Solution Revenue million Forecast, by Application 2019 & 2032
- Table 4: Global Nitrocellulose Solution Volume K Forecast, by Application 2019 & 2032
- Table 5: Global Nitrocellulose Solution Revenue million Forecast, by Types 2019 & 2032
- Table 6: Global Nitrocellulose Solution Volume K Forecast, by Types 2019 & 2032
- Table 7: Global Nitrocellulose Solution Revenue million Forecast, by Region 2019 & 2032
- Table 8: Global Nitrocellulose Solution Volume K Forecast, by Region 2019 & 2032
- Table 9: Global Nitrocellulose Solution Revenue million Forecast, by Application 2019 & 2032
- Table 10: Global Nitrocellulose Solution Volume K Forecast, by Application 2019 & 2032
- Table 11: Global Nitrocellulose Solution Revenue million Forecast, by Types 2019 & 2032
- Table 12: Global Nitrocellulose Solution Volume K Forecast, by Types 2019 & 2032
- Table 13: Global Nitrocellulose Solution Revenue million Forecast, by Country 2019 & 2032
- Table 14: Global Nitrocellulose Solution Volume K Forecast, by Country 2019 & 2032
- Table 15: United States Nitrocellulose Solution Revenue (million) Forecast, by Application 2019 & 2032
- Table 16: United States Nitrocellulose Solution Volume (K) Forecast, by Application 2019 & 2032
- Table 17: Canada Nitrocellulose Solution Revenue (million) Forecast, by Application 2019 & 2032
- Table 18: Canada Nitrocellulose Solution Volume (K) Forecast, by Application 2019 & 2032
- Table 19: Mexico Nitrocellulose Solution Revenue (million) Forecast, by Application 2019 & 2032
- Table 20: Mexico Nitrocellulose Solution Volume (K) Forecast, by Application 2019 & 2032
- Table 21: Global Nitrocellulose Solution Revenue million Forecast, by Application 2019 & 2032
- Table 22: Global Nitrocellulose Solution Volume K Forecast, by Application 2019 & 2032
- Table 23: Global Nitrocellulose Solution Revenue million Forecast, by Types 2019 & 2032
- Table 24: Global Nitrocellulose Solution Volume K Forecast, by Types 2019 & 2032
- Table 25: Global Nitrocellulose Solution Revenue million Forecast, by Country 2019 & 2032
- Table 26: Global Nitrocellulose Solution Volume K Forecast, by Country 2019 & 2032
- Table 27: Brazil Nitrocellulose Solution Revenue (million) Forecast, by Application 2019 & 2032
- Table 28: Brazil Nitrocellulose Solution Volume (K) Forecast, by Application 2019 & 2032
- Table 29: Argentina Nitrocellulose Solution Revenue (million) Forecast, by Application 2019 & 2032
- Table 30: Argentina Nitrocellulose Solution Volume (K) Forecast, by Application 2019 & 2032
- Table 31: Rest of South America Nitrocellulose Solution Revenue (million) Forecast, by Application 2019 & 2032
- Table 32: Rest of South America Nitrocellulose Solution Volume (K) Forecast, by Application 2019 & 2032
- Table 33: Global Nitrocellulose Solution Revenue million Forecast, by Application 2019 & 2032
- Table 34: Global Nitrocellulose Solution Volume K Forecast, by Application 2019 & 2032
- Table 35: Global Nitrocellulose Solution Revenue million Forecast, by Types 2019 & 2032
- Table 36: Global Nitrocellulose Solution Volume K Forecast, by Types 2019 & 2032
- Table 37: Global Nitrocellulose Solution Revenue million Forecast, by Country 2019 & 2032
- Table 38: Global Nitrocellulose Solution Volume K Forecast, by Country 2019 & 2032
- Table 39: United Kingdom Nitrocellulose Solution Revenue (million) Forecast, by Application 2019 & 2032
- Table 40: United Kingdom Nitrocellulose Solution Volume (K) Forecast, by Application 2019 & 2032
- Table 41: Germany Nitrocellulose Solution Revenue (million) Forecast, by Application 2019 & 2032
- Table 42: Germany Nitrocellulose Solution Volume (K) Forecast, by Application 2019 & 2032
- Table 43: France Nitrocellulose Solution Revenue (million) Forecast, by Application 2019 & 2032
- Table 44: France Nitrocellulose Solution Volume (K) Forecast, by Application 2019 & 2032
- Table 45: Italy Nitrocellulose Solution Revenue (million) Forecast, by Application 2019 & 2032
- Table 46: Italy Nitrocellulose Solution Volume (K) Forecast, by Application 2019 & 2032
- Table 47: Spain Nitrocellulose Solution Revenue (million) Forecast, by Application 2019 & 2032
- Table 48: Spain Nitrocellulose Solution Volume (K) Forecast, by Application 2019 & 2032
- Table 49: Russia Nitrocellulose Solution Revenue (million) Forecast, by Application 2019 & 2032
- Table 50: Russia Nitrocellulose Solution Volume (K) Forecast, by Application 2019 & 2032
- Table 51: Benelux Nitrocellulose Solution Revenue (million) Forecast, by Application 2019 & 2032
- Table 52: Benelux Nitrocellulose Solution Volume (K) Forecast, by Application 2019 & 2032
- Table 53: Nordics Nitrocellulose Solution Revenue (million) Forecast, by Application 2019 & 2032
- Table 54: Nordics Nitrocellulose Solution Volume (K) Forecast, by Application 2019 & 2032
- Table 55: Rest of Europe Nitrocellulose Solution Revenue (million) Forecast, by Application 2019 & 2032
- Table 56: Rest of Europe Nitrocellulose Solution Volume (K) Forecast, by Application 2019 & 2032
- Table 57: Global Nitrocellulose Solution Revenue million Forecast, by Application 2019 & 2032
- Table 58: Global Nitrocellulose Solution Volume K Forecast, by Application 2019 & 2032
- Table 59: Global Nitrocellulose Solution Revenue million Forecast, by Types 2019 & 2032
- Table 60: Global Nitrocellulose Solution Volume K Forecast, by Types 2019 & 2032
- Table 61: Global Nitrocellulose Solution Revenue million Forecast, by Country 2019 & 2032
- Table 62: Global Nitrocellulose Solution Volume K Forecast, by Country 2019 & 2032
- Table 63: Turkey Nitrocellulose Solution Revenue (million) Forecast, by Application 2019 & 2032
- Table 64: Turkey Nitrocellulose Solution Volume (K) Forecast, by Application 2019 & 2032
- Table 65: Israel Nitrocellulose Solution Revenue (million) Forecast, by Application 2019 & 2032
- Table 66: Israel Nitrocellulose Solution Volume (K) Forecast, by Application 2019 & 2032
- Table 67: GCC Nitrocellulose Solution Revenue (million) Forecast, by Application 2019 & 2032
- Table 68: GCC Nitrocellulose Solution Volume (K) Forecast, by Application 2019 & 2032
- Table 69: North Africa Nitrocellulose Solution Revenue (million) Forecast, by Application 2019 & 2032
- Table 70: North Africa Nitrocellulose Solution Volume (K) Forecast, by Application 2019 & 2032
- Table 71: South Africa Nitrocellulose Solution Revenue (million) Forecast, by Application 2019 & 2032
- Table 72: South Africa Nitrocellulose Solution Volume (K) Forecast, by Application 2019 & 2032
- Table 73: Rest of Middle East & Africa Nitrocellulose Solution Revenue (million) Forecast, by Application 2019 & 2032
- Table 74: Rest of Middle East & Africa Nitrocellulose Solution Volume (K) Forecast, by Application 2019 & 2032
- Table 75: Global Nitrocellulose Solution Revenue million Forecast, by Application 2019 & 2032
- Table 76: Global Nitrocellulose Solution Volume K Forecast, by Application 2019 & 2032
- Table 77: Global Nitrocellulose Solution Revenue million Forecast, by Types 2019 & 2032
- Table 78: Global Nitrocellulose Solution Volume K Forecast, by Types 2019 & 2032
- Table 79: Global Nitrocellulose Solution Revenue million Forecast, by Country 2019 & 2032
- Table 80: Global Nitrocellulose Solution Volume K Forecast, by Country 2019 & 2032
- Table 81: China Nitrocellulose Solution Revenue (million) Forecast, by Application 2019 & 2032
- Table 82: China Nitrocellulose Solution Volume (K) Forecast, by Application 2019 & 2032
- Table 83: India Nitrocellulose Solution Revenue (million) Forecast, by Application 2019 & 2032
- Table 84: India Nitrocellulose Solution Volume (K) Forecast, by Application 2019 & 2032
- Table 85: Japan Nitrocellulose Solution Revenue (million) Forecast, by Application 2019 & 2032
- Table 86: Japan Nitrocellulose Solution Volume (K) Forecast, by Application 2019 & 2032
- Table 87: South Korea Nitrocellulose Solution Revenue (million) Forecast, by Application 2019 & 2032
- Table 88: South Korea Nitrocellulose Solution Volume (K) Forecast, by Application 2019 & 2032
- Table 89: ASEAN Nitrocellulose Solution Revenue (million) Forecast, by Application 2019 & 2032
- Table 90: ASEAN Nitrocellulose Solution Volume (K) Forecast, by Application 2019 & 2032
- Table 91: Oceania Nitrocellulose Solution Revenue (million) Forecast, by Application 2019 & 2032
- Table 92: Oceania Nitrocellulose Solution Volume (K) Forecast, by Application 2019 & 2032
- Table 93: Rest of Asia Pacific Nitrocellulose Solution Revenue (million) Forecast, by Application 2019 & 2032
- Table 94: Rest of Asia Pacific Nitrocellulose Solution Volume (K) Forecast, by Application 2019 & 2032
Frequently Asked Questions
1. What is the projected Compound Annual Growth Rate (CAGR) of the Nitrocellulose Solution?
The projected CAGR is approximately XX%.
2. Which companies are prominent players in the Nitrocellulose Solution?
Key companies in the market include Sichuan Nitrocell Corporation, Alchemix (Nitro), Hengshui HeShuo Cellulose, Hubei Xuefei Chemical Industry, Synthesia, GRN Cellulose, Nitrocellulose Group.
3. What are the main segments of the Nitrocellulose Solution?
The market segments include Application, Types.
4. Can you provide details about the market size?
The market size is estimated to be USD XXX million as of 2022.
5. What are some drivers contributing to market growth?
N/A
6. What are the notable trends driving market growth?
N/A
7. Are there any restraints impacting market growth?
N/A
8. Can you provide examples of recent developments in the market?
N/A
9. What pricing options are available for accessing the report?
Pricing options include single-user, multi-user, and enterprise licenses priced at USD 3950.00, USD 5925.00, and USD 7900.00 respectively.
10. Is the market size provided in terms of value or volume?
The market size is provided in terms of value, measured in million and volume, measured in K.
11. Are there any specific market keywords associated with the report?
Yes, the market keyword associated with the report is "Nitrocellulose Solution," which aids in identifying and referencing the specific market segment covered.
12. How do I determine which pricing option suits my needs best?
The pricing options vary based on user requirements and access needs. Individual users may opt for single-user licenses, while businesses requiring broader access may choose multi-user or enterprise licenses for cost-effective access to the report.
13. Are there any additional resources or data provided in the Nitrocellulose Solution report?
While the report offers comprehensive insights, it's advisable to review the specific contents or supplementary materials provided to ascertain if additional resources or data are available.
14. How can I stay updated on further developments or reports in the Nitrocellulose Solution?
To stay informed about further developments, trends, and reports in the Nitrocellulose Solution, consider subscribing to industry newsletters, following relevant companies and organizations, or regularly checking reputable industry news sources and publications.
Methodology
Step 1 - Identification of Relevant Samples Size from Population Database


Step 2 - Approaches for Defining Global Market Size (Value, Volume* & Price*)

Note*: In applicable scenarios
Step 3 - Data Sources
Primary Research
- Web Analytics
- Survey Reports
- Research Institute
- Latest Research Reports
- Opinion Leaders
Secondary Research
- Annual Reports
- White Paper
- Latest Press Release
- Industry Association
- Paid Database
- Investor Presentations

Step 4 - Data Triangulation
Involves using different sources of information in order to increase the validity of a study
These sources are likely to be stakeholders in a program - participants, other researchers, program staff, other community members, and so on.
Then we put all data in single framework & apply various statistical tools to find out the dynamic on the market.
During the analysis stage, feedback from the stakeholder groups would be compared to determine areas of agreement as well as areas of divergence
