

Key Insights
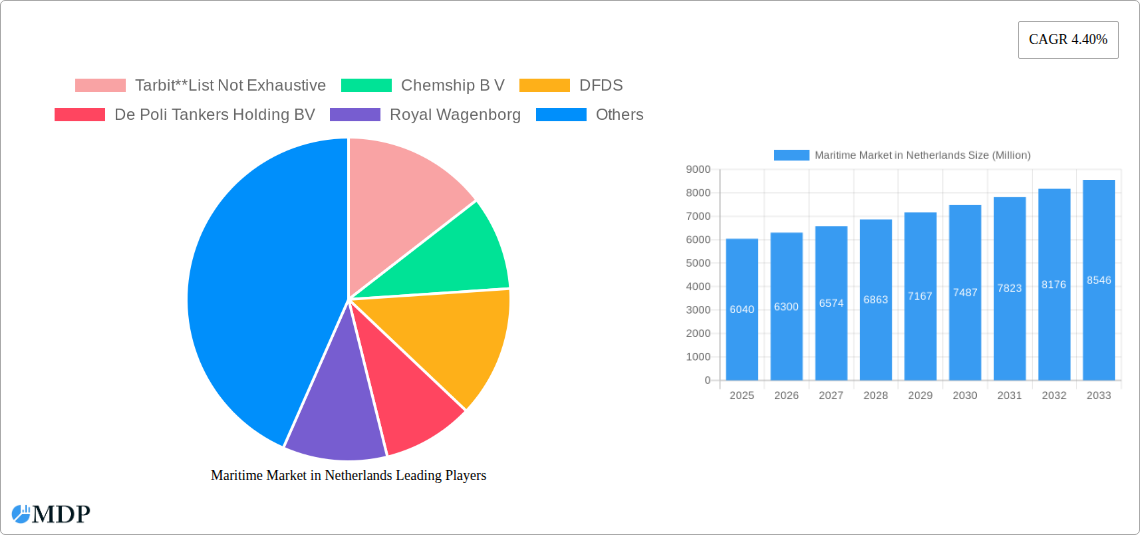
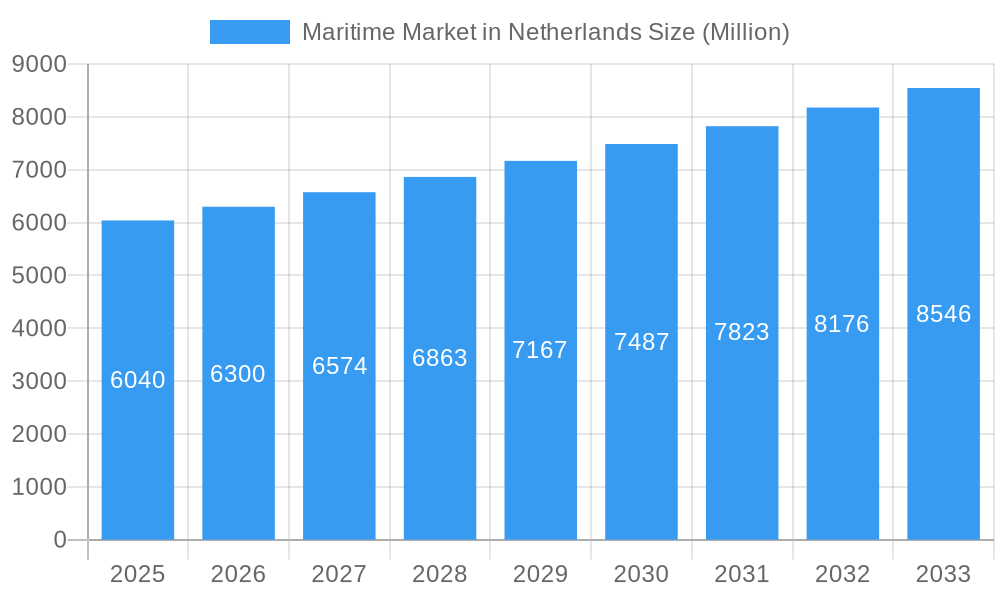
The Netherlands' maritime market, valued at €6.04 billion in 2025, is projected to experience robust growth, driven by the nation's strategic location as a major European port hub and its established expertise in shipping and logistics. A compound annual growth rate (CAGR) of 4.40% is anticipated from 2025 to 2033, indicating a steadily expanding market. Key growth drivers include increasing global trade volumes, particularly in containerized goods, the rising demand for efficient and reliable freight transport services, and continued investments in port infrastructure modernization and digitalization within the Netherlands. The sector's segmentation reveals a diverse landscape encompassing freight transport, vessel leasing and rental, cargo handling (including container, crane, and stevedoring services), and supporting services such as shipping agencies and ship management. While specific restraining factors are not provided, potential challenges could include fluctuations in global fuel prices, geopolitical instability impacting trade routes, and the ongoing need for sustainable and environmentally friendly shipping practices. The dominance of established players like DFDS and Royal Wagenborg highlights the competitive yet consolidated nature of the market. Future growth will likely depend on the success of companies in adapting to evolving technological advancements, stringent environmental regulations, and the increasing need for supply chain resilience.
Maritime Market in Netherlands Market Size (In Billion)
The Netherlands' strategic geographic position and well-developed infrastructure contribute significantly to the market's expansion. The growth trajectory is projected to be fueled by ongoing investments in port facilities, technological upgrades aimed at enhancing efficiency and reducing operational costs, and a growing focus on sustainable shipping solutions to meet environmental regulations. The presence of numerous specialized service providers, such as shipping agencies and ship management companies, underscores the sophisticated nature of the Dutch maritime sector. Competition within the market remains relatively intense, with established players and smaller, specialized firms vying for market share. Sustained growth will require a continued focus on innovation, efficient resource management, and adept adaptation to the evolving global shipping landscape, with emphasis on both short-term market fluctuations and long-term sustainability goals. This includes navigating challenges such as workforce skills gaps and the integration of new technologies into existing operations.
Maritime Market in Netherlands Company Market Share
Maritime Market in Netherlands: A Comprehensive Analysis (2019-2033)
This in-depth report provides a comprehensive analysis of the Netherlands' maritime market, offering invaluable insights for industry stakeholders. Covering the period 2019-2033, with a focus on 2025, this study unveils market dynamics, trends, leading players, and future opportunities. Download now to gain a competitive edge.
Keywords: Netherlands maritime market, maritime industry Netherlands, shipping Netherlands, port of Rotterdam, maritime transport Netherlands, cargo handling Netherlands, vessel leasing Netherlands, shipping agencies Netherlands, maritime market analysis, maritime market forecast, Dutch maritime sector, maritime market size Netherlands, CAGR maritime Netherlands.
Maritime Market in Netherlands Market Dynamics & Concentration
The Netherlands maritime market, a significant contributor to the nation's economy, exhibits a moderately concentrated structure. While a few large players dominate certain segments like freight transport, numerous smaller companies specialize in niche areas such as ship management or specialized cargo handling. The market's dynamics are shaped by several factors:
Market Concentration: The top five players (DFDS, Royal Wagenborg, Unifeeder, De Poli Tankers Holding BV, and Arklow Shipping) collectively hold an estimated xx% market share in 2025, indicating moderate consolidation. Smaller players, however, maintain a strong presence, particularly in specialized segments.
Innovation Drivers: Technological advancements such as autonomous vessels, digitalization of logistics, and improved vessel efficiency are key drivers of innovation. The Netherlands is a front-runner in adopting these technologies.
Regulatory Frameworks: Stringent environmental regulations (e.g., emission control areas) and safety standards drive investment in cleaner technologies and operational efficiency. This also influences M&A activity as companies consolidate to comply with regulations.
Product Substitutes: Road and rail transport present some competition, particularly for shorter distances. However, the maritime sector's cost-effectiveness for bulk and long-haul transportation ensures its continued dominance.
End-User Trends: Growing e-commerce and globalization fuel demand for efficient freight transport services, driving market growth. Furthermore, the increasing demand for sustainable shipping solutions shapes business strategies.
M&A Activities: The historical period (2019-2024) witnessed approximately xx M&A deals in the Netherlands maritime market, with a projected increase to xx deals during the forecast period (2025-2033) driven by consolidation and expansion efforts.
Maritime Market in Netherlands Industry Trends & Analysis
The Netherlands maritime market exhibits robust growth driven by several key factors. The compound annual growth rate (CAGR) for the overall market is estimated at xx% during the forecast period (2025-2033).
Market growth is fueled by:
Increasing Global Trade: The Netherlands' strategic location as a major European port hub significantly boosts its maritime sector. Increased global trade volumes directly translate to higher demand for shipping and related services.
Technological Disruptions: The adoption of digital technologies is streamlining operations, improving efficiency, and reducing costs across various segments. Automation and data analytics are improving decision-making and supply chain management. Market penetration of AI-powered solutions in vessel management is projected to reach xx% by 2033.
Government Initiatives: Government support for sustainable shipping and port infrastructure development encourages investment and growth within the sector. Policies promoting green shipping technologies and improving port efficiency contribute to the industry's positive outlook.
Competitive Dynamics: The competitive landscape involves both large multinational corporations and specialized smaller companies. Competition is largely based on price, service quality, and innovation. The market is characterized by both cooperation and competition, with strategic partnerships formed for specialized services.
Consumer Preferences: Emphasis on sustainability and environmentally friendly solutions is increasingly influencing consumer choices, with a growing preference for companies with robust ESG (Environmental, Social, and Governance) practices.
Leading Markets & Segments in Maritime Market in Netherlands
The Port of Rotterdam dominates the Netherlands maritime market, handling a significant share of the country's seaborne cargo. This dominance is attributable to several factors:
Strategic Location: Rotterdam's position as a major European gateway provides unparalleled connectivity to global trade routes.
Extensive Infrastructure: The port boasts world-class infrastructure, including deepwater berths, modern terminals, and efficient logistics networks.
Government Support: Continuous investment in port infrastructure and related initiatives strengthens Rotterdam's competitive advantage.
Among the service segments, Freight Transport Services represents the largest segment, accounting for approximately xx% of the market in 2025.
Freight Transport Services: High demand for efficient and reliable cargo transportation fuels this segment's dominance. This is driven by increased global trade and the reliance on the Netherlands as a major European logistics hub.
Vessel Leasing and Rental Services: This segment benefits from fluctuations in market demand, with companies strategically leasing or renting vessels based on project needs. Growth in this segment is projected to be xx% during the forecast period.
Cargo Handling: This segment comprises container services, crane services, and stevedoring services. Technological advancements, especially in automation, are improving efficiency and throughput.
Supporting Service Activities: Shipping agencies, ship brokerage, and ship management services are vital for the smooth functioning of the entire maritime ecosystem. These segments benefit from the overall growth of the shipping industry.
Maritime Market in Netherlands Product Developments
Recent years have witnessed significant product innovations in vessel design, incorporating fuel-efficient technologies and automation to enhance operational efficiency and environmental sustainability. The focus is on reducing emissions, improving safety, and maximizing cargo capacity. This includes the development of larger, more efficient container vessels and the increasing use of digital twins for vessel maintenance and management. These advancements improve competitiveness and align with the market's growing focus on sustainability.
Key Drivers of Maritime Market in Netherlands Growth
Several factors underpin the continued growth of the Netherlands maritime market:
Technological advancements: Automation, AI, and digitalization improve efficiency and reduce costs across the value chain.
Strong economic fundamentals: The Netherlands' robust economy provides a solid base for the maritime sector's sustained growth.
Favorable government policies: Government support for port infrastructure and sustainable shipping initiatives stimulates investment and growth.
Strategic location: The Netherlands' central location in Europe and access to major trade routes ensures continued market competitiveness.
Challenges in the Maritime Market in Netherlands Market
Several challenges hinder the Netherlands' maritime market's growth:
Fluctuating fuel prices: Rising fuel costs impact profitability, particularly for smaller operators.
Port congestion: High volumes of cargo can lead to congestion, impacting efficiency and increasing costs.
Environmental regulations: Compliance with stricter environmental regulations requires significant investments in cleaner technologies.
Geopolitical uncertainties: Global political events can disrupt trade flows and impact market stability, impacting overall growth by an estimated xx% in years of high geopolitical uncertainty.
Emerging Opportunities in Maritime Market in Netherlands
The Netherlands maritime market presents several promising opportunities:
Green shipping solutions: Increased demand for sustainable shipping practices creates opportunities for companies offering eco-friendly solutions.
Digitalization and automation: Further integration of digital technologies can streamline operations and improve efficiency.
Strategic partnerships: Collaboration among stakeholders can unlock synergies and drive innovation.
Market expansion: Focus on new markets and trade routes can further enhance growth potential.
Leading Players in the Maritime Market in Netherlands Sector
- Tarbit
- Chemship B V
- DFDS
- De Poli Tankers Holding BV
- Royal Wagenborg
- Unifeeder
- Nirint Shipping B V
- Wilson Agency BV
- Arklow Shipping
- Interstream Barging
Key Milestones in Maritime Market in Netherlands Industry
- 2020: Increased focus on digitalization within the port of Rotterdam.
- 2021: Implementation of stricter environmental regulations for vessels operating in Dutch waters.
- 2022: Several significant M&A deals consolidating smaller players within the sector.
- 2023: Launch of a new initiative promoting sustainable shipping practices in the Netherlands.
- 2024: Significant investments in port infrastructure modernization and expansion.
Strategic Outlook for Maritime Market in Netherlands Market
The Netherlands maritime market is poised for continued growth, driven by technological advancements, robust economic fundamentals, and supportive government policies. Focus on sustainable practices, digitalization, and strategic partnerships will be crucial for success in this dynamic market. The long-term potential is significant, with opportunities for market expansion and diversification within the sector. The market is expected to reach a value of xx Million by 2033.
Maritime Market in Netherlands Segmentation
-
1. Service
- 1.1. Freight Transport Services
- 1.2. Vessel Leasing and Rental Services
- 1.3. Cargo Ha
- 1.4. Supporti
Maritime Market in Netherlands Segmentation By Geography
-
1. North America
- 1.1. United States
- 1.2. Canada
- 1.3. Mexico
-
2. South America
- 2.1. Brazil
- 2.2. Argentina
- 2.3. Rest of South America
-
3. Europe
- 3.1. United Kingdom
- 3.2. Germany
- 3.3. France
- 3.4. Italy
- 3.5. Spain
- 3.6. Russia
- 3.7. Benelux
- 3.8. Nordics
- 3.9. Rest of Europe
-
4. Middle East & Africa
- 4.1. Turkey
- 4.2. Israel
- 4.3. GCC
- 4.4. North Africa
- 4.5. South Africa
- 4.6. Rest of Middle East & Africa
-
5. Asia Pacific
- 5.1. China
- 5.2. India
- 5.3. Japan
- 5.4. South Korea
- 5.5. ASEAN
- 5.6. Oceania
- 5.7. Rest of Asia Pacific
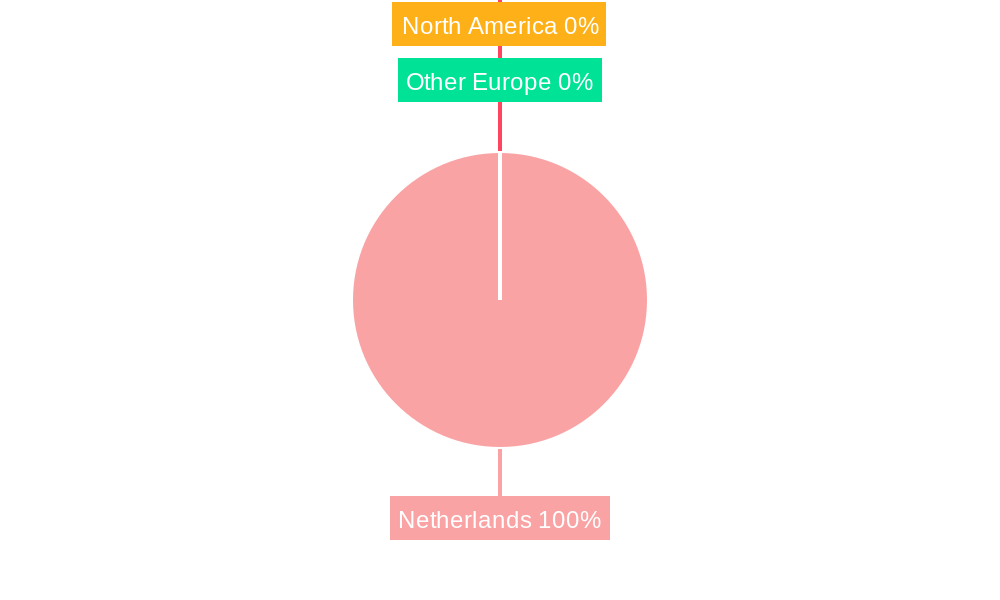
Maritime Market in Netherlands Regional Market Share
Geographic Coverage of Maritime Market in Netherlands
Maritime Market in Netherlands REPORT HIGHLIGHTS
| Aspects | Details |
|---|---|
| Study Period | 2020-2034 |
| Base Year | 2025 |
| Estimated Year | 2026 |
| Forecast Period | 2026-2034 |
| Historical Period | 2020-2025 |
| Growth Rate | CAGR of 4.40% from 2020-2034 |
| Segmentation |
|
Table of Contents
- 1. Introduction
- 1.1. Research Scope
- 1.2. Market Segmentation
- 1.3. Research Objective
- 1.4. Definitions and Assumptions
- 2. Executive Summary
- 2.1. Market Snapshot
- 3. Market Dynamics
- 3.1. Market Drivers
- 3.2. Market Restrains
- 3.3. Market Trends
- 3.4. Market Opportunities
- 4. Market Factor Analysis
- 4.1. Porters Five Forces
- 4.1.1. Bargaining Power of Suppliers
- 4.1.2. Bargaining Power of Buyers
- 4.1.3. Threat of New Entrants
- 4.1.4. Threat of Substitutes
- 4.1.5. Competitive Rivalry
- 4.2. PESTEL analysis
- 4.3. BCG Analysis
- 4.3.1. Stars (High Growth, High Market Share)
- 4.3.2. Cash Cows (Low Growth, High Market Share)
- 4.3.3. Question Mark (High Growth, Low Market Share)
- 4.3.4. Dogs (Low Growth, Low Market Share)
- 4.4. Ansoff Matrix Analysis
- 4.5. Supply Chain Analysis
- 4.6. Regulatory Landscape
- 4.7. Current Market Potential and Opportunity Assessment (TAM–SAM–SOM Framework)
- 4.8. MDP Analyst Note
- 4.1. Porters Five Forces
- 5. Market Analysis, Insights and Forecast 2021-2033
- 5.1. Market Analysis, Insights and Forecast - by Service
- 5.1.1. Freight Transport Services
- 5.1.2. Vessel Leasing and Rental Services
- 5.1.3. Cargo Ha
- 5.1.4. Supporti
- 5.2. Market Analysis, Insights and Forecast - by Region
- 5.2.1. North America
- 5.2.2. South America
- 5.2.3. Europe
- 5.2.4. Middle East & Africa
- 5.2.5. Asia Pacific
- 5.1. Market Analysis, Insights and Forecast - by Service
- 6. Global Maritime Market in Netherlands Analysis, Insights and Forecast, 2021-2033
- 6.1. Market Analysis, Insights and Forecast - by Service
- 6.1.1. Freight Transport Services
- 6.1.2. Vessel Leasing and Rental Services
- 6.1.3. Cargo Ha
- 6.1.4. Supporti
- 6.1. Market Analysis, Insights and Forecast - by Service
- 7. North America Maritime Market in Netherlands Analysis, Insights and Forecast, 2020-2032
- 7.1. Market Analysis, Insights and Forecast - by Service
- 7.1.1. Freight Transport Services
- 7.1.2. Vessel Leasing and Rental Services
- 7.1.3. Cargo Ha
- 7.1.4. Supporti
- 7.1. Market Analysis, Insights and Forecast - by Service
- 8. South America Maritime Market in Netherlands Analysis, Insights and Forecast, 2020-2032
- 8.1. Market Analysis, Insights and Forecast - by Service
- 8.1.1. Freight Transport Services
- 8.1.2. Vessel Leasing and Rental Services
- 8.1.3. Cargo Ha
- 8.1.4. Supporti
- 8.1. Market Analysis, Insights and Forecast - by Service
- 9. Europe Maritime Market in Netherlands Analysis, Insights and Forecast, 2020-2032
- 9.1. Market Analysis, Insights and Forecast - by Service
- 9.1.1. Freight Transport Services
- 9.1.2. Vessel Leasing and Rental Services
- 9.1.3. Cargo Ha
- 9.1.4. Supporti
- 9.1. Market Analysis, Insights and Forecast - by Service
- 10. Middle East & Africa Maritime Market in Netherlands Analysis, Insights and Forecast, 2020-2032
- 10.1. Market Analysis, Insights and Forecast - by Service
- 10.1.1. Freight Transport Services
- 10.1.2. Vessel Leasing and Rental Services
- 10.1.3. Cargo Ha
- 10.1.4. Supporti
- 10.1. Market Analysis, Insights and Forecast - by Service
- 11. Asia Pacific Maritime Market in Netherlands Analysis, Insights and Forecast, 2020-2032
- 11.1. Market Analysis, Insights and Forecast - by Service
- 11.1.1. Freight Transport Services
- 11.1.2. Vessel Leasing and Rental Services
- 11.1.3. Cargo Ha
- 11.1.4. Supporti
- 11.1. Market Analysis, Insights and Forecast - by Service
- 12. Competitive Analysis
- 12.1. Company Profiles
- 12.1.1 Tarbit**List Not Exhaustive
- 12.1.1.1. Company Overview
- 12.1.1.2. Products
- 12.1.1.3. Company Financials
- 12.1.1.4. SWOT Analysis
- 12.1.2 Chemship B V
- 12.1.2.1. Company Overview
- 12.1.2.2. Products
- 12.1.2.3. Company Financials
- 12.1.2.4. SWOT Analysis
- 12.1.3 DFDS
- 12.1.3.1. Company Overview
- 12.1.3.2. Products
- 12.1.3.3. Company Financials
- 12.1.3.4. SWOT Analysis
- 12.1.4 De Poli Tankers Holding BV
- 12.1.4.1. Company Overview
- 12.1.4.2. Products
- 12.1.4.3. Company Financials
- 12.1.4.4. SWOT Analysis
- 12.1.5 Royal Wagenborg
- 12.1.5.1. Company Overview
- 12.1.5.2. Products
- 12.1.5.3. Company Financials
- 12.1.5.4. SWOT Analysis
- 12.1.6 Unifeeder
- 12.1.6.1. Company Overview
- 12.1.6.2. Products
- 12.1.6.3. Company Financials
- 12.1.6.4. SWOT Analysis
- 12.1.7 Nirint Shipping B V
- 12.1.7.1. Company Overview
- 12.1.7.2. Products
- 12.1.7.3. Company Financials
- 12.1.7.4. SWOT Analysis
- 12.1.8 Wilson Agency BV
- 12.1.8.1. Company Overview
- 12.1.8.2. Products
- 12.1.8.3. Company Financials
- 12.1.8.4. SWOT Analysis
- 12.1.9 Arklow Shipping
- 12.1.9.1. Company Overview
- 12.1.9.2. Products
- 12.1.9.3. Company Financials
- 12.1.9.4. SWOT Analysis
- 12.1.10 Interstream Barging
- 12.1.10.1. Company Overview
- 12.1.10.2. Products
- 12.1.10.3. Company Financials
- 12.1.10.4. SWOT Analysis
- 12.1.1 Tarbit**List Not Exhaustive
- 12.2. Market Entropy
- 12.2.1 Company's Key Areas Served
- 12.2.2 Recent Developments
- 12.3. Company Market Share Analysis 2025
- 12.3.1 Top 5 Companies Market Share Analysis
- 12.3.2 Top 3 Companies Market Share Analysis
- 12.4. List of Potential Customers
- 13. Research Methodology
List of Figures
- Figure 1: Global Maritime Market in Netherlands Revenue Breakdown (Million, %) by Region 2025 & 2033
- Figure 2: North America Maritime Market in Netherlands Revenue (Million), by Service 2025 & 2033
- Figure 3: North America Maritime Market in Netherlands Revenue Share (%), by Service 2025 & 2033
- Figure 4: North America Maritime Market in Netherlands Revenue (Million), by Country 2025 & 2033
- Figure 5: North America Maritime Market in Netherlands Revenue Share (%), by Country 2025 & 2033
- Figure 6: South America Maritime Market in Netherlands Revenue (Million), by Service 2025 & 2033
- Figure 7: South America Maritime Market in Netherlands Revenue Share (%), by Service 2025 & 2033
- Figure 8: South America Maritime Market in Netherlands Revenue (Million), by Country 2025 & 2033
- Figure 9: South America Maritime Market in Netherlands Revenue Share (%), by Country 2025 & 2033
- Figure 10: Europe Maritime Market in Netherlands Revenue (Million), by Service 2025 & 2033
- Figure 11: Europe Maritime Market in Netherlands Revenue Share (%), by Service 2025 & 2033
- Figure 12: Europe Maritime Market in Netherlands Revenue (Million), by Country 2025 & 2033
- Figure 13: Europe Maritime Market in Netherlands Revenue Share (%), by Country 2025 & 2033
- Figure 14: Middle East & Africa Maritime Market in Netherlands Revenue (Million), by Service 2025 & 2033
- Figure 15: Middle East & Africa Maritime Market in Netherlands Revenue Share (%), by Service 2025 & 2033
- Figure 16: Middle East & Africa Maritime Market in Netherlands Revenue (Million), by Country 2025 & 2033
- Figure 17: Middle East & Africa Maritime Market in Netherlands Revenue Share (%), by Country 2025 & 2033
- Figure 18: Asia Pacific Maritime Market in Netherlands Revenue (Million), by Service 2025 & 2033
- Figure 19: Asia Pacific Maritime Market in Netherlands Revenue Share (%), by Service 2025 & 2033
- Figure 20: Asia Pacific Maritime Market in Netherlands Revenue (Million), by Country 2025 & 2033
- Figure 21: Asia Pacific Maritime Market in Netherlands Revenue Share (%), by Country 2025 & 2033
List of Tables
- Table 1: Global Maritime Market in Netherlands Revenue Million Forecast, by Service 2020 & 2033
- Table 2: Global Maritime Market in Netherlands Revenue Million Forecast, by Region 2020 & 2033
- Table 3: Global Maritime Market in Netherlands Revenue Million Forecast, by Service 2020 & 2033
- Table 4: Global Maritime Market in Netherlands Revenue Million Forecast, by Country 2020 & 2033
- Table 5: United States Maritime Market in Netherlands Revenue (Million) Forecast, by Application 2020 & 2033
- Table 6: Canada Maritime Market in Netherlands Revenue (Million) Forecast, by Application 2020 & 2033
- Table 7: Mexico Maritime Market in Netherlands Revenue (Million) Forecast, by Application 2020 & 2033
- Table 8: Global Maritime Market in Netherlands Revenue Million Forecast, by Service 2020 & 2033
- Table 9: Global Maritime Market in Netherlands Revenue Million Forecast, by Country 2020 & 2033
- Table 10: Brazil Maritime Market in Netherlands Revenue (Million) Forecast, by Application 2020 & 2033
- Table 11: Argentina Maritime Market in Netherlands Revenue (Million) Forecast, by Application 2020 & 2033
- Table 12: Rest of South America Maritime Market in Netherlands Revenue (Million) Forecast, by Application 2020 & 2033
- Table 13: Global Maritime Market in Netherlands Revenue Million Forecast, by Service 2020 & 2033
- Table 14: Global Maritime Market in Netherlands Revenue Million Forecast, by Country 2020 & 2033
- Table 15: United Kingdom Maritime Market in Netherlands Revenue (Million) Forecast, by Application 2020 & 2033
- Table 16: Germany Maritime Market in Netherlands Revenue (Million) Forecast, by Application 2020 & 2033
- Table 17: France Maritime Market in Netherlands Revenue (Million) Forecast, by Application 2020 & 2033
- Table 18: Italy Maritime Market in Netherlands Revenue (Million) Forecast, by Application 2020 & 2033
- Table 19: Spain Maritime Market in Netherlands Revenue (Million) Forecast, by Application 2020 & 2033
- Table 20: Russia Maritime Market in Netherlands Revenue (Million) Forecast, by Application 2020 & 2033
- Table 21: Benelux Maritime Market in Netherlands Revenue (Million) Forecast, by Application 2020 & 2033
- Table 22: Nordics Maritime Market in Netherlands Revenue (Million) Forecast, by Application 2020 & 2033
- Table 23: Rest of Europe Maritime Market in Netherlands Revenue (Million) Forecast, by Application 2020 & 2033
- Table 24: Global Maritime Market in Netherlands Revenue Million Forecast, by Service 2020 & 2033
- Table 25: Global Maritime Market in Netherlands Revenue Million Forecast, by Country 2020 & 2033
- Table 26: Turkey Maritime Market in Netherlands Revenue (Million) Forecast, by Application 2020 & 2033
- Table 27: Israel Maritime Market in Netherlands Revenue (Million) Forecast, by Application 2020 & 2033
- Table 28: GCC Maritime Market in Netherlands Revenue (Million) Forecast, by Application 2020 & 2033
- Table 29: North Africa Maritime Market in Netherlands Revenue (Million) Forecast, by Application 2020 & 2033
- Table 30: South Africa Maritime Market in Netherlands Revenue (Million) Forecast, by Application 2020 & 2033
- Table 31: Rest of Middle East & Africa Maritime Market in Netherlands Revenue (Million) Forecast, by Application 2020 & 2033
- Table 32: Global Maritime Market in Netherlands Revenue Million Forecast, by Service 2020 & 2033
- Table 33: Global Maritime Market in Netherlands Revenue Million Forecast, by Country 2020 & 2033
- Table 34: China Maritime Market in Netherlands Revenue (Million) Forecast, by Application 2020 & 2033
- Table 35: India Maritime Market in Netherlands Revenue (Million) Forecast, by Application 2020 & 2033
- Table 36: Japan Maritime Market in Netherlands Revenue (Million) Forecast, by Application 2020 & 2033
- Table 37: South Korea Maritime Market in Netherlands Revenue (Million) Forecast, by Application 2020 & 2033
- Table 38: ASEAN Maritime Market in Netherlands Revenue (Million) Forecast, by Application 2020 & 2033
- Table 39: Oceania Maritime Market in Netherlands Revenue (Million) Forecast, by Application 2020 & 2033
- Table 40: Rest of Asia Pacific Maritime Market in Netherlands Revenue (Million) Forecast, by Application 2020 & 2033
Frequently Asked Questions
1. What is the projected Compound Annual Growth Rate (CAGR) of the Maritime Market in Netherlands?
The projected CAGR is approximately 4.40%.
2. Which companies are prominent players in the Maritime Market in Netherlands?
Key companies in the market include Tarbit**List Not Exhaustive, Chemship B V, DFDS, De Poli Tankers Holding BV, Royal Wagenborg, Unifeeder, Nirint Shipping B V, Wilson Agency BV, Arklow Shipping, Interstream Barging.
3. What are the main segments of the Maritime Market in Netherlands?
The market segments include Service.
4. Can you provide details about the market size?
The market size is estimated to be USD 6.04 Million as of 2022.
5. What are some drivers contributing to market growth?
Surge in trade activities boosting the market; Increase in infrastructure development and increasing foreign investments.
6. What are the notable trends driving market growth?
Cross Border E-commerce Growth.
7. Are there any restraints impacting market growth?
Inadequate transportation infrastructure affecting the market; Regulatory challenges affecting the market.
8. Can you provide examples of recent developments in the market?
N/A
9. What pricing options are available for accessing the report?
Pricing options include single-user, multi-user, and enterprise licenses priced at USD 3800, USD 4500, and USD 5800 respectively.
10. Is the market size provided in terms of value or volume?
The market size is provided in terms of value, measured in Million.
11. Are there any specific market keywords associated with the report?
Yes, the market keyword associated with the report is "Maritime Market in Netherlands," which aids in identifying and referencing the specific market segment covered.
12. How do I determine which pricing option suits my needs best?
The pricing options vary based on user requirements and access needs. Individual users may opt for single-user licenses, while businesses requiring broader access may choose multi-user or enterprise licenses for cost-effective access to the report.
13. Are there any additional resources or data provided in the Maritime Market in Netherlands report?
While the report offers comprehensive insights, it's advisable to review the specific contents or supplementary materials provided to ascertain if additional resources or data are available.
14. How can I stay updated on further developments or reports in the Maritime Market in Netherlands?
To stay informed about further developments, trends, and reports in the Maritime Market in Netherlands, consider subscribing to industry newsletters, following relevant companies and organizations, or regularly checking reputable industry news sources and publications.
Methodology
Step 1 - Identification of Relevant Samples Size from Population Database


Step 2 - Approaches for Defining Global Market Size (Value, Volume* & Price*)

Note*: In applicable scenarios
Step 3 - Data Sources
Primary Research
- Web Analytics
- Survey Reports
- Research Institute
- Latest Research Reports
- Opinion Leaders
Secondary Research
- Annual Reports
- White Paper
- Latest Press Release
- Industry Association
- Paid Database
- Investor Presentations

Step 4 - Data Triangulation
Involves using different sources of information in order to increase the validity of a study
These sources are likely to be stakeholders in a program - participants, other researchers, program staff, other community members, and so on.
Then we put all data in single framework & apply various statistical tools to find out the dynamic on the market.
During the analysis stage, feedback from the stakeholder groups would be compared to determine areas of agreement as well as areas of divergence