

Key Insights
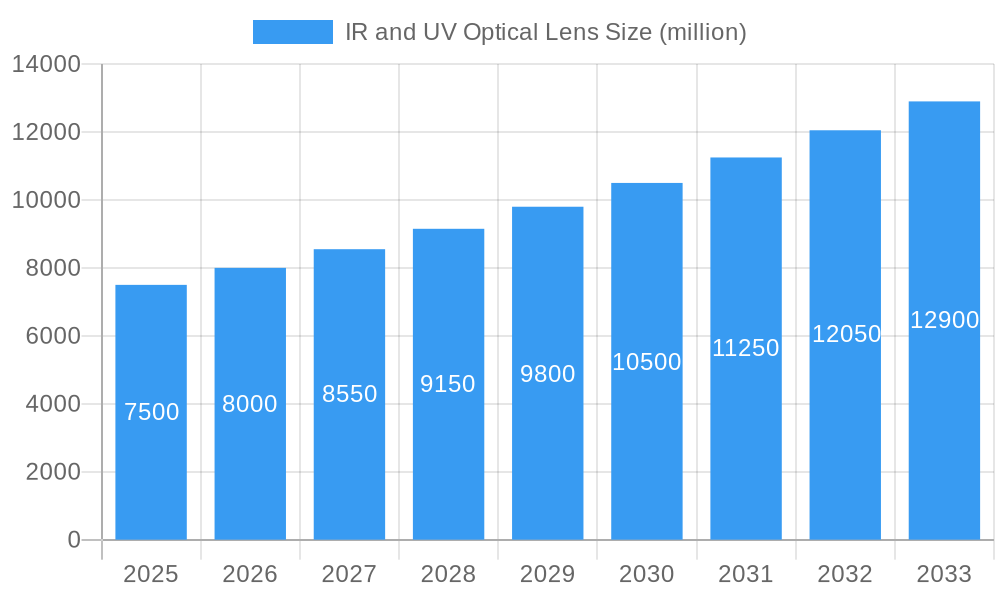
The global IR and UV Optical Lens market is projected for robust expansion, driven by the escalating demand for advanced imaging solutions across various sectors. With a substantial market size estimated at approximately $7.5 billion, the market is anticipated to grow at a Compound Annual Growth Rate (CAGR) of around 6.5% over the forecast period of 2025-2033. This growth is fueled by critical applications in military and national defense, where infrared optics are indispensable for surveillance, target acquisition, and night vision. Similarly, the security systems sector is increasingly adopting both IR and UV lenses for enhanced monitoring and threat detection. The automotive industry's embrace of advanced driver-assistance systems (ADAS) and autonomous driving technologies, which rely on sophisticated sensing capabilities, further bolsters market penetration. Medical treatments, particularly in diagnostics and minimally invasive surgery, are also emerging as significant growth avenues, leveraging the precision and unique properties of these specialized lenses.
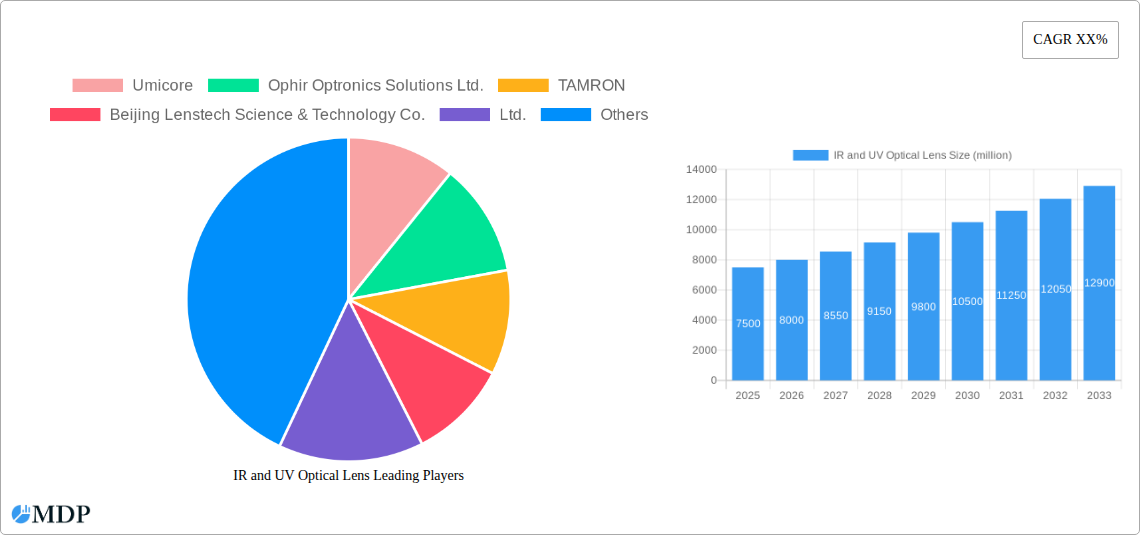
IR and UV Optical Lens Market Size (In Billion)
Emerging trends indicate a significant shift towards miniaturization and enhanced performance in IR and UV optical lenses, catering to the growing demand for compact and portable imaging devices. Innovations in material science are leading to the development of lenses with improved transmission, broader spectral range, and greater durability, thereby expanding their applicability in harsh environments. However, the market faces certain restraints, including the high cost of advanced materials and manufacturing processes, which can impact adoption rates, especially in cost-sensitive applications. Geographically, Asia Pacific is expected to exhibit the highest growth potential, driven by rapid industrialization, increasing defense spending, and a burgeoning automotive sector in countries like China and India. North America and Europe remain significant markets, with a strong emphasis on technological advancements and a well-established demand in defense and automotive sectors. Key players are actively engaged in research and development, strategic partnerships, and mergers and acquisitions to strengthen their market positions and capitalize on emerging opportunities within this dynamic landscape.
IR and UV Optical Lens Company Market Share
Unveiling the Future: A Comprehensive Report on the IR and UV Optical Lens Market (2019-2033)
This in-depth report provides an unparalleled analysis of the global Infrared (IR) and Ultraviolet (UV) Optical Lens market, projected to reach $50,000 million by 2033. Covering the period from 2019 to 2033, with a base and estimated year of 2025 and a forecast period of 2025-2033, this study delves into critical market dynamics, technological advancements, and key growth drivers. Discover how leading companies like Umicore, TAMRON, and Sunny Optical Technology (Group) Company Limited are shaping the landscape across vital applications such as Military and National Defense, Security Systems, Automotive, Medical Treatment, and Industrial Applications. Essential for industry stakeholders, investors, and researchers, this report offers actionable insights into market concentration, innovation trends, regulatory frameworks, and emerging opportunities.
IR and UV Optical Lens Market Dynamics & Concentration
The IR and UV Optical Lens market is characterized by a moderate to high concentration, with a few key players holding significant market share, estimated at 65%. Innovation is primarily driven by advancements in material science, miniaturization, and enhanced spectral performance, leading to a constant stream of new product introductions. Regulatory frameworks, particularly concerning defense and medical applications, play a crucial role in dictating product development and market access. Product substitutes, while present in some niche areas, are generally limited due to the specialized nature of IR and UV optics. End-user trends indicate a rising demand for higher resolution, wider spectral range, and more compact lens designs. Mergers and acquisitions (M&A) activities are on the rise, with approximately 12 major M&A deals recorded in the historical period (2019-2024), aimed at consolidating market position and acquiring new technologies.
- Market Concentration: Dominated by a few key global manufacturers.
- Innovation Drivers: Material science, spectral performance, miniaturization.
- Regulatory Frameworks: Stringent for defense and medical applications.
- Product Substitutes: Limited due to specialized functionality.
- End-User Trends: Demand for higher resolution, wider spectral range, compact designs.
- M&A Activities: Increasing trend for market consolidation and technology acquisition, with an estimated 12 deals in the historical period.
IR and UV Optical Lens Industry Trends & Analysis
The IR and UV Optical Lens industry is poised for significant expansion, driven by a compound annual growth rate (CAGR) of 8.7%. This robust growth is fueled by escalating demand across diverse sectors, including automotive for advanced driver-assistance systems (ADAS) and autonomous driving, security for enhanced surveillance and threat detection, and medical for advanced diagnostic and therapeutic imaging. Technological disruptions are continuously reshaping the market, with innovations in anti-reflective coatings, high-transmittance materials, and adaptive optics enabling more sophisticated applications. Consumer preferences are shifting towards smaller, lighter, and more powerful lens solutions that offer superior performance in challenging environmental conditions. Competitive dynamics are intense, with companies investing heavily in research and development to maintain a competitive edge. Market penetration in emerging economies is steadily increasing, presenting substantial growth opportunities. The development of specialized lenses for night vision, thermal imaging, and germicidal UV applications are key growth areas. Furthermore, advancements in manufacturing techniques are contributing to cost reductions and improved product accessibility. The integration of AI and machine learning in optical system design is also a significant trend.
Leading Markets & Segments in IR and UV Optical Lens
The Military and National Defense segment is currently the dominant market for IR and UV optical lenses, driven by the critical need for advanced surveillance, targeting, and situational awareness technologies. This dominance is underpinned by significant government investment in defense modernization programs and a persistent demand for high-performance imaging solutions. Geographically, North America leads the market, primarily due to its advanced technological infrastructure and substantial defense spending.
- Dominant Application Segment: Military and National Defense, accounting for an estimated 35% of the market.
- Key Drivers: Government R&D funding, geopolitical tensions, border security needs, modernization of military equipment.
- Dominance Analysis: Continuous innovation in thermal imaging, night vision, and targeting systems for aircraft, ground vehicles, and personnel equipment.
- Leading Geographic Market: North America, representing approximately 30% of the global market.
- Key Drivers: Robust defense sector, high adoption of ADAS in the automotive industry, advanced medical research and healthcare infrastructure.
- Dominance Analysis: Strong presence of leading technology companies and significant investment in R&D for both military and civilian applications.
- Key Segment Dominance Drivers:
- Automotive: Increasing adoption of ADAS and autonomous driving features.
- Security Systems: Growing demand for intelligent surveillance and border control.
- Medical Treatment: Advancements in diagnostic imaging, surgical tools, and phototherapy.
- Industrial Applications: Expansion in quality control, process monitoring, and non-destructive testing.
- IR Optical Lens: Critical for thermal imaging and night vision capabilities.
- UV Optical Lens: Essential for sterilization, curing, and specific analytical techniques.
IR and UV Optical Lens Product Developments
Recent product developments in the IR and UV optical lens market are marked by a strong emphasis on enhanced performance and specialized applications. Companies are introducing lenses with wider spectral transmission ranges, improved optical clarity, and superior resistance to extreme environmental conditions. Innovations in material science have led to the development of new optical materials that offer higher refractive indices and lower dispersion, enabling the creation of more compact and powerful lens systems. These advancements are critical for military thermal imaging, automotive ADAS, and advanced medical diagnostics. The competitive advantage lies in achieving higher resolution, lower aberration, and greater durability, catering to the evolving demands of sophisticated end-user applications.
Key Drivers of IR and UV Optical Lens Growth
Several key factors are propelling the growth of the IR and UV optical lens market. The increasing global defense spending and the modernization of military equipment are significant drivers, demanding advanced IR and UV imaging capabilities for surveillance, reconnaissance, and targeting. The rapid adoption of advanced driver-assistance systems (ADAS) and the burgeoning autonomous vehicle market are creating substantial demand for IR lenses that enable reliable operation in low-light and adverse weather conditions. Furthermore, advancements in medical imaging and therapeutic applications, such as UV germicidal irradiation and infrared spectroscopy, are contributing to market expansion. Regulatory support for technological integration in critical sectors also plays a vital role.
- Defense Modernization: Increased investment in advanced surveillance and targeting systems.
- Automotive Advancements: Widespread adoption of ADAS and autonomous driving technologies.
- Medical Innovations: Growth in diagnostic imaging, surgical tools, and UV-based sterilization.
- Industrial Automation: Demand for precise inspection and quality control in manufacturing.
- Technological Progress: Continuous improvements in material science and optical design.
Challenges in the IR and UV Optical Lens Market
Despite its robust growth potential, the IR and UV optical lens market faces several challenges. The high cost of research and development, coupled with the specialized manufacturing processes, can lead to high product prices, potentially limiting adoption in cost-sensitive markets. Stringent regulatory requirements, especially for defense and medical applications, can also create barriers to entry and prolong product approval timelines. Supply chain disruptions, geopolitical uncertainties, and the availability of skilled labor for precision manufacturing can impact production and delivery. Intense competition among established players and emerging manufacturers can also put pressure on profit margins.
Emerging Opportunities in IR and UV Optical Lens
The IR and UV optical lens market presents numerous emerging opportunities for growth. The increasing demand for smart city infrastructure and enhanced security systems is driving the adoption of advanced surveillance technologies. The growing awareness of hygiene and public health is boosting the demand for UV-C disinfection solutions, creating a significant market for UV optical components. Furthermore, the expansion of industrial automation and the need for efficient quality control processes in manufacturing sectors are opening new avenues for IR and UV optical lens applications. Strategic partnerships and collaborations between technology providers and end-users are expected to accelerate innovation and market penetration.
Leading Players in the IR and UV Optical Lens Sector
- Umicore
- Ophir Optronics Solutions Ltd.
- TAMRON
- Beijing Lenstech Science & Technology Co.,Ltd.
- Yunnan Chihong North photoelectric Co.,Ltd.
- Sunny Optical Technology (Group) Company Limited
- Kunming Full-wave Infrared Technology Co.,Ltd.
- LightPath Technologies
- STEMMER IMAGING
- Solaris Optics
Key Milestones in IR and UV Optical Lens Industry
- 2019: Launch of next-generation thermal imaging lenses with enhanced resolution.
- 2020: Significant increase in demand for UV lenses for sterilization applications due to global health concerns.
- 2021: Major automotive manufacturers integrate advanced IR sensors and lenses into ADAS systems.
- 2022: Acquisition of a specialized optical coating company by a leading IR lens manufacturer to enhance performance.
- 2023: Introduction of compact, high-performance UV optical modules for portable medical devices.
- 2024: Increased investment in R&D for AI-integrated optical systems for predictive maintenance in industrial settings.
Strategic Outlook for IR and UV Optical Lens Market
The strategic outlook for the IR and UV optical lens market remains exceptionally strong. Future growth will be accelerated by the continued integration of these technologies in emerging fields like augmented reality (AR) and virtual reality (VR), as well as the expansion of smart manufacturing and IoT applications. Companies that focus on developing highly customized solutions, investing in advanced materials, and establishing strong distribution networks in high-growth regions are well-positioned for success. Strategic collaborations to address evolving technological demands and regulatory landscapes will be crucial for market leadership in the coming years.
IR and UV Optical Lens Segmentation
-
1. Application
- 1.1. Military and National Defense
- 1.2. Security System
- 1.3. Automotive
- 1.4. Medical Treatment
- 1.5. Industrial Applications
-
2. Types
- 2.1. IR Optical Lens
- 2.2. UV Optical Lens
IR and UV Optical Lens Segmentation By Geography
-
1. North America
- 1.1. United States
- 1.2. Canada
- 1.3. Mexico
-
2. South America
- 2.1. Brazil
- 2.2. Argentina
- 2.3. Rest of South America
-
3. Europe
- 3.1. United Kingdom
- 3.2. Germany
- 3.3. France
- 3.4. Italy
- 3.5. Spain
- 3.6. Russia
- 3.7. Benelux
- 3.8. Nordics
- 3.9. Rest of Europe
-
4. Middle East & Africa
- 4.1. Turkey
- 4.2. Israel
- 4.3. GCC
- 4.4. North Africa
- 4.5. South Africa
- 4.6. Rest of Middle East & Africa
-
5. Asia Pacific
- 5.1. China
- 5.2. India
- 5.3. Japan
- 5.4. South Korea
- 5.5. ASEAN
- 5.6. Oceania
- 5.7. Rest of Asia Pacific
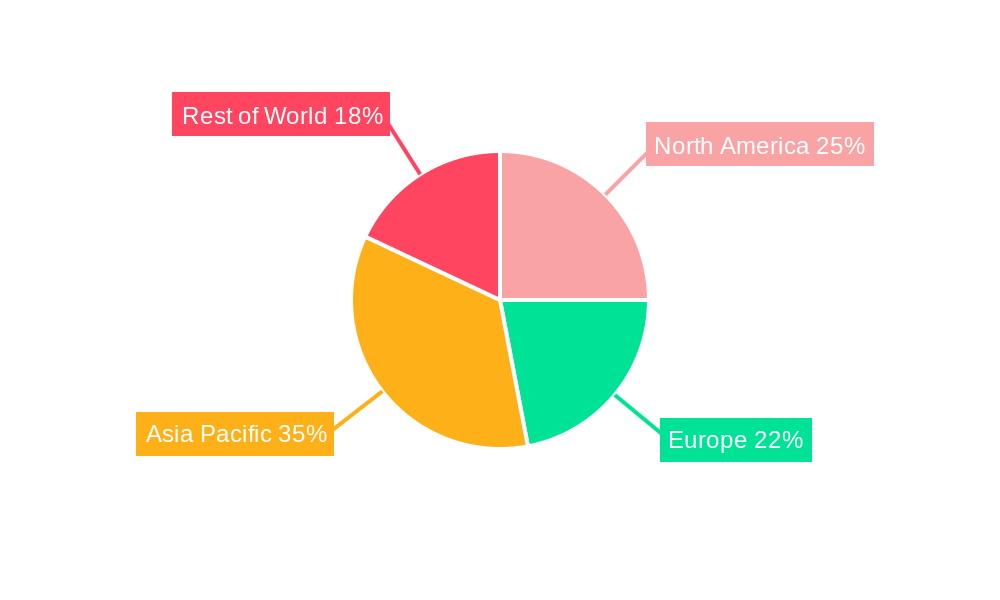
IR and UV Optical Lens Regional Market Share
Geographic Coverage of IR and UV Optical Lens
IR and UV Optical Lens REPORT HIGHLIGHTS
| Aspects | Details |
|---|---|
| Study Period | 2020-2034 |
| Base Year | 2025 |
| Estimated Year | 2026 |
| Forecast Period | 2026-2034 |
| Historical Period | 2020-2025 |
| Growth Rate | CAGR of XX% from 2020-2034 |
| Segmentation |
|
Table of Contents
- 1. Introduction
- 1.1. Research Scope
- 1.2. Market Segmentation
- 1.3. Research Methodology
- 1.4. Definitions and Assumptions
- 2. Executive Summary
- 2.1. Introduction
- 3. Market Dynamics
- 3.1. Introduction
- 3.2. Market Drivers
- 3.3. Market Restrains
- 3.4. Market Trends
- 4. Market Factor Analysis
- 4.1. Porters Five Forces
- 4.2. Supply/Value Chain
- 4.3. PESTEL analysis
- 4.4. Market Entropy
- 4.5. Patent/Trademark Analysis
- 5. Global IR and UV Optical Lens Analysis, Insights and Forecast, 2020-2032
- 5.1. Market Analysis, Insights and Forecast - by Application
- 5.1.1. Military and National Defense
- 5.1.2. Security System
- 5.1.3. Automotive
- 5.1.4. Medical Treatment
- 5.1.5. Industrial Applications
- 5.2. Market Analysis, Insights and Forecast - by Types
- 5.2.1. IR Optical Lens
- 5.2.2. UV Optical Lens
- 5.3. Market Analysis, Insights and Forecast - by Region
- 5.3.1. North America
- 5.3.2. South America
- 5.3.3. Europe
- 5.3.4. Middle East & Africa
- 5.3.5. Asia Pacific
- 5.1. Market Analysis, Insights and Forecast - by Application
- 6. North America IR and UV Optical Lens Analysis, Insights and Forecast, 2020-2032
- 6.1. Market Analysis, Insights and Forecast - by Application
- 6.1.1. Military and National Defense
- 6.1.2. Security System
- 6.1.3. Automotive
- 6.1.4. Medical Treatment
- 6.1.5. Industrial Applications
- 6.2. Market Analysis, Insights and Forecast - by Types
- 6.2.1. IR Optical Lens
- 6.2.2. UV Optical Lens
- 6.1. Market Analysis, Insights and Forecast - by Application
- 7. South America IR and UV Optical Lens Analysis, Insights and Forecast, 2020-2032
- 7.1. Market Analysis, Insights and Forecast - by Application
- 7.1.1. Military and National Defense
- 7.1.2. Security System
- 7.1.3. Automotive
- 7.1.4. Medical Treatment
- 7.1.5. Industrial Applications
- 7.2. Market Analysis, Insights and Forecast - by Types
- 7.2.1. IR Optical Lens
- 7.2.2. UV Optical Lens
- 7.1. Market Analysis, Insights and Forecast - by Application
- 8. Europe IR and UV Optical Lens Analysis, Insights and Forecast, 2020-2032
- 8.1. Market Analysis, Insights and Forecast - by Application
- 8.1.1. Military and National Defense
- 8.1.2. Security System
- 8.1.3. Automotive
- 8.1.4. Medical Treatment
- 8.1.5. Industrial Applications
- 8.2. Market Analysis, Insights and Forecast - by Types
- 8.2.1. IR Optical Lens
- 8.2.2. UV Optical Lens
- 8.1. Market Analysis, Insights and Forecast - by Application
- 9. Middle East & Africa IR and UV Optical Lens Analysis, Insights and Forecast, 2020-2032
- 9.1. Market Analysis, Insights and Forecast - by Application
- 9.1.1. Military and National Defense
- 9.1.2. Security System
- 9.1.3. Automotive
- 9.1.4. Medical Treatment
- 9.1.5. Industrial Applications
- 9.2. Market Analysis, Insights and Forecast - by Types
- 9.2.1. IR Optical Lens
- 9.2.2. UV Optical Lens
- 9.1. Market Analysis, Insights and Forecast - by Application
- 10. Asia Pacific IR and UV Optical Lens Analysis, Insights and Forecast, 2020-2032
- 10.1. Market Analysis, Insights and Forecast - by Application
- 10.1.1. Military and National Defense
- 10.1.2. Security System
- 10.1.3. Automotive
- 10.1.4. Medical Treatment
- 10.1.5. Industrial Applications
- 10.2. Market Analysis, Insights and Forecast - by Types
- 10.2.1. IR Optical Lens
- 10.2.2. UV Optical Lens
- 10.1. Market Analysis, Insights and Forecast - by Application
- 11. Competitive Analysis
- 11.1. Global Market Share Analysis 2025
- 11.2. Company Profiles
- 11.2.1 Umicore
- 11.2.1.1. Overview
- 11.2.1.2. Products
- 11.2.1.3. SWOT Analysis
- 11.2.1.4. Recent Developments
- 11.2.1.5. Financials (Based on Availability)
- 11.2.2 Ophir Optronics Solutions Ltd.
- 11.2.2.1. Overview
- 11.2.2.2. Products
- 11.2.2.3. SWOT Analysis
- 11.2.2.4. Recent Developments
- 11.2.2.5. Financials (Based on Availability)
- 11.2.3 TAMRON
- 11.2.3.1. Overview
- 11.2.3.2. Products
- 11.2.3.3. SWOT Analysis
- 11.2.3.4. Recent Developments
- 11.2.3.5. Financials (Based on Availability)
- 11.2.4 Beijing Lenstech Science & Technology Co.
- 11.2.4.1. Overview
- 11.2.4.2. Products
- 11.2.4.3. SWOT Analysis
- 11.2.4.4. Recent Developments
- 11.2.4.5. Financials (Based on Availability)
- 11.2.5 Ltd.
- 11.2.5.1. Overview
- 11.2.5.2. Products
- 11.2.5.3. SWOT Analysis
- 11.2.5.4. Recent Developments
- 11.2.5.5. Financials (Based on Availability)
- 11.2.6 Yunnan Chihong North photoelectric Co.
- 11.2.6.1. Overview
- 11.2.6.2. Products
- 11.2.6.3. SWOT Analysis
- 11.2.6.4. Recent Developments
- 11.2.6.5. Financials (Based on Availability)
- 11.2.7 Ltd.
- 11.2.7.1. Overview
- 11.2.7.2. Products
- 11.2.7.3. SWOT Analysis
- 11.2.7.4. Recent Developments
- 11.2.7.5. Financials (Based on Availability)
- 11.2.8 Sunny Optical Technology (Group) Company Limited
- 11.2.8.1. Overview
- 11.2.8.2. Products
- 11.2.8.3. SWOT Analysis
- 11.2.8.4. Recent Developments
- 11.2.8.5. Financials (Based on Availability)
- 11.2.9 Kunming Full-wave Infrared Technology Co.
- 11.2.9.1. Overview
- 11.2.9.2. Products
- 11.2.9.3. SWOT Analysis
- 11.2.9.4. Recent Developments
- 11.2.9.5. Financials (Based on Availability)
- 11.2.10 Ltd.
- 11.2.10.1. Overview
- 11.2.10.2. Products
- 11.2.10.3. SWOT Analysis
- 11.2.10.4. Recent Developments
- 11.2.10.5. Financials (Based on Availability)
- 11.2.11 LightPath Technologies
- 11.2.11.1. Overview
- 11.2.11.2. Products
- 11.2.11.3. SWOT Analysis
- 11.2.11.4. Recent Developments
- 11.2.11.5. Financials (Based on Availability)
- 11.2.12 STEMMER IMAGING
- 11.2.12.1. Overview
- 11.2.12.2. Products
- 11.2.12.3. SWOT Analysis
- 11.2.12.4. Recent Developments
- 11.2.12.5. Financials (Based on Availability)
- 11.2.13 Solaris Optics
- 11.2.13.1. Overview
- 11.2.13.2. Products
- 11.2.13.3. SWOT Analysis
- 11.2.13.4. Recent Developments
- 11.2.13.5. Financials (Based on Availability)
- 11.2.1 Umicore
List of Figures
- Figure 1: Global IR and UV Optical Lens Revenue Breakdown (million, %) by Region 2025 & 2033
- Figure 2: North America IR and UV Optical Lens Revenue (million), by Application 2025 & 2033
- Figure 3: North America IR and UV Optical Lens Revenue Share (%), by Application 2025 & 2033
- Figure 4: North America IR and UV Optical Lens Revenue (million), by Types 2025 & 2033
- Figure 5: North America IR and UV Optical Lens Revenue Share (%), by Types 2025 & 2033
- Figure 6: North America IR and UV Optical Lens Revenue (million), by Country 2025 & 2033
- Figure 7: North America IR and UV Optical Lens Revenue Share (%), by Country 2025 & 2033
- Figure 8: South America IR and UV Optical Lens Revenue (million), by Application 2025 & 2033
- Figure 9: South America IR and UV Optical Lens Revenue Share (%), by Application 2025 & 2033
- Figure 10: South America IR and UV Optical Lens Revenue (million), by Types 2025 & 2033
- Figure 11: South America IR and UV Optical Lens Revenue Share (%), by Types 2025 & 2033
- Figure 12: South America IR and UV Optical Lens Revenue (million), by Country 2025 & 2033
- Figure 13: South America IR and UV Optical Lens Revenue Share (%), by Country 2025 & 2033
- Figure 14: Europe IR and UV Optical Lens Revenue (million), by Application 2025 & 2033
- Figure 15: Europe IR and UV Optical Lens Revenue Share (%), by Application 2025 & 2033
- Figure 16: Europe IR and UV Optical Lens Revenue (million), by Types 2025 & 2033
- Figure 17: Europe IR and UV Optical Lens Revenue Share (%), by Types 2025 & 2033
- Figure 18: Europe IR and UV Optical Lens Revenue (million), by Country 2025 & 2033
- Figure 19: Europe IR and UV Optical Lens Revenue Share (%), by Country 2025 & 2033
- Figure 20: Middle East & Africa IR and UV Optical Lens Revenue (million), by Application 2025 & 2033
- Figure 21: Middle East & Africa IR and UV Optical Lens Revenue Share (%), by Application 2025 & 2033
- Figure 22: Middle East & Africa IR and UV Optical Lens Revenue (million), by Types 2025 & 2033
- Figure 23: Middle East & Africa IR and UV Optical Lens Revenue Share (%), by Types 2025 & 2033
- Figure 24: Middle East & Africa IR and UV Optical Lens Revenue (million), by Country 2025 & 2033
- Figure 25: Middle East & Africa IR and UV Optical Lens Revenue Share (%), by Country 2025 & 2033
- Figure 26: Asia Pacific IR and UV Optical Lens Revenue (million), by Application 2025 & 2033
- Figure 27: Asia Pacific IR and UV Optical Lens Revenue Share (%), by Application 2025 & 2033
- Figure 28: Asia Pacific IR and UV Optical Lens Revenue (million), by Types 2025 & 2033
- Figure 29: Asia Pacific IR and UV Optical Lens Revenue Share (%), by Types 2025 & 2033
- Figure 30: Asia Pacific IR and UV Optical Lens Revenue (million), by Country 2025 & 2033
- Figure 31: Asia Pacific IR and UV Optical Lens Revenue Share (%), by Country 2025 & 2033
List of Tables
- Table 1: Global IR and UV Optical Lens Revenue million Forecast, by Application 2020 & 2033
- Table 2: Global IR and UV Optical Lens Revenue million Forecast, by Types 2020 & 2033
- Table 3: Global IR and UV Optical Lens Revenue million Forecast, by Region 2020 & 2033
- Table 4: Global IR and UV Optical Lens Revenue million Forecast, by Application 2020 & 2033
- Table 5: Global IR and UV Optical Lens Revenue million Forecast, by Types 2020 & 2033
- Table 6: Global IR and UV Optical Lens Revenue million Forecast, by Country 2020 & 2033
- Table 7: United States IR and UV Optical Lens Revenue (million) Forecast, by Application 2020 & 2033
- Table 8: Canada IR and UV Optical Lens Revenue (million) Forecast, by Application 2020 & 2033
- Table 9: Mexico IR and UV Optical Lens Revenue (million) Forecast, by Application 2020 & 2033
- Table 10: Global IR and UV Optical Lens Revenue million Forecast, by Application 2020 & 2033
- Table 11: Global IR and UV Optical Lens Revenue million Forecast, by Types 2020 & 2033
- Table 12: Global IR and UV Optical Lens Revenue million Forecast, by Country 2020 & 2033
- Table 13: Brazil IR and UV Optical Lens Revenue (million) Forecast, by Application 2020 & 2033
- Table 14: Argentina IR and UV Optical Lens Revenue (million) Forecast, by Application 2020 & 2033
- Table 15: Rest of South America IR and UV Optical Lens Revenue (million) Forecast, by Application 2020 & 2033
- Table 16: Global IR and UV Optical Lens Revenue million Forecast, by Application 2020 & 2033
- Table 17: Global IR and UV Optical Lens Revenue million Forecast, by Types 2020 & 2033
- Table 18: Global IR and UV Optical Lens Revenue million Forecast, by Country 2020 & 2033
- Table 19: United Kingdom IR and UV Optical Lens Revenue (million) Forecast, by Application 2020 & 2033
- Table 20: Germany IR and UV Optical Lens Revenue (million) Forecast, by Application 2020 & 2033
- Table 21: France IR and UV Optical Lens Revenue (million) Forecast, by Application 2020 & 2033
- Table 22: Italy IR and UV Optical Lens Revenue (million) Forecast, by Application 2020 & 2033
- Table 23: Spain IR and UV Optical Lens Revenue (million) Forecast, by Application 2020 & 2033
- Table 24: Russia IR and UV Optical Lens Revenue (million) Forecast, by Application 2020 & 2033
- Table 25: Benelux IR and UV Optical Lens Revenue (million) Forecast, by Application 2020 & 2033
- Table 26: Nordics IR and UV Optical Lens Revenue (million) Forecast, by Application 2020 & 2033
- Table 27: Rest of Europe IR and UV Optical Lens Revenue (million) Forecast, by Application 2020 & 2033
- Table 28: Global IR and UV Optical Lens Revenue million Forecast, by Application 2020 & 2033
- Table 29: Global IR and UV Optical Lens Revenue million Forecast, by Types 2020 & 2033
- Table 30: Global IR and UV Optical Lens Revenue million Forecast, by Country 2020 & 2033
- Table 31: Turkey IR and UV Optical Lens Revenue (million) Forecast, by Application 2020 & 2033
- Table 32: Israel IR and UV Optical Lens Revenue (million) Forecast, by Application 2020 & 2033
- Table 33: GCC IR and UV Optical Lens Revenue (million) Forecast, by Application 2020 & 2033
- Table 34: North Africa IR and UV Optical Lens Revenue (million) Forecast, by Application 2020 & 2033
- Table 35: South Africa IR and UV Optical Lens Revenue (million) Forecast, by Application 2020 & 2033
- Table 36: Rest of Middle East & Africa IR and UV Optical Lens Revenue (million) Forecast, by Application 2020 & 2033
- Table 37: Global IR and UV Optical Lens Revenue million Forecast, by Application 2020 & 2033
- Table 38: Global IR and UV Optical Lens Revenue million Forecast, by Types 2020 & 2033
- Table 39: Global IR and UV Optical Lens Revenue million Forecast, by Country 2020 & 2033
- Table 40: China IR and UV Optical Lens Revenue (million) Forecast, by Application 2020 & 2033
- Table 41: India IR and UV Optical Lens Revenue (million) Forecast, by Application 2020 & 2033
- Table 42: Japan IR and UV Optical Lens Revenue (million) Forecast, by Application 2020 & 2033
- Table 43: South Korea IR and UV Optical Lens Revenue (million) Forecast, by Application 2020 & 2033
- Table 44: ASEAN IR and UV Optical Lens Revenue (million) Forecast, by Application 2020 & 2033
- Table 45: Oceania IR and UV Optical Lens Revenue (million) Forecast, by Application 2020 & 2033
- Table 46: Rest of Asia Pacific IR and UV Optical Lens Revenue (million) Forecast, by Application 2020 & 2033
Frequently Asked Questions
1. What is the projected Compound Annual Growth Rate (CAGR) of the IR and UV Optical Lens?
The projected CAGR is approximately XX%.
2. Which companies are prominent players in the IR and UV Optical Lens?
Key companies in the market include Umicore, Ophir Optronics Solutions Ltd., TAMRON, Beijing Lenstech Science & Technology Co., Ltd., Yunnan Chihong North photoelectric Co., Ltd., Sunny Optical Technology (Group) Company Limited, Kunming Full-wave Infrared Technology Co., Ltd., LightPath Technologies, STEMMER IMAGING, Solaris Optics.
3. What are the main segments of the IR and UV Optical Lens?
The market segments include Application, Types.
4. Can you provide details about the market size?
The market size is estimated to be USD XXX million as of 2022.
5. What are some drivers contributing to market growth?
N/A
6. What are the notable trends driving market growth?
N/A
7. Are there any restraints impacting market growth?
N/A
8. Can you provide examples of recent developments in the market?
N/A
9. What pricing options are available for accessing the report?
Pricing options include single-user, multi-user, and enterprise licenses priced at USD 2900.00, USD 4350.00, and USD 5800.00 respectively.
10. Is the market size provided in terms of value or volume?
The market size is provided in terms of value, measured in million.
11. Are there any specific market keywords associated with the report?
Yes, the market keyword associated with the report is "IR and UV Optical Lens," which aids in identifying and referencing the specific market segment covered.
12. How do I determine which pricing option suits my needs best?
The pricing options vary based on user requirements and access needs. Individual users may opt for single-user licenses, while businesses requiring broader access may choose multi-user or enterprise licenses for cost-effective access to the report.
13. Are there any additional resources or data provided in the IR and UV Optical Lens report?
While the report offers comprehensive insights, it's advisable to review the specific contents or supplementary materials provided to ascertain if additional resources or data are available.
14. How can I stay updated on further developments or reports in the IR and UV Optical Lens?
To stay informed about further developments, trends, and reports in the IR and UV Optical Lens, consider subscribing to industry newsletters, following relevant companies and organizations, or regularly checking reputable industry news sources and publications.
Methodology
Step 1 - Identification of Relevant Samples Size from Population Database


Step 2 - Approaches for Defining Global Market Size (Value, Volume* & Price*)

Note*: In applicable scenarios
Step 3 - Data Sources
Primary Research
- Web Analytics
- Survey Reports
- Research Institute
- Latest Research Reports
- Opinion Leaders
Secondary Research
- Annual Reports
- White Paper
- Latest Press Release
- Industry Association
- Paid Database
- Investor Presentations

Step 4 - Data Triangulation
Involves using different sources of information in order to increase the validity of a study
These sources are likely to be stakeholders in a program - participants, other researchers, program staff, other community members, and so on.
Then we put all data in single framework & apply various statistical tools to find out the dynamic on the market.
During the analysis stage, feedback from the stakeholder groups would be compared to determine areas of agreement as well as areas of divergence