

Key Insights
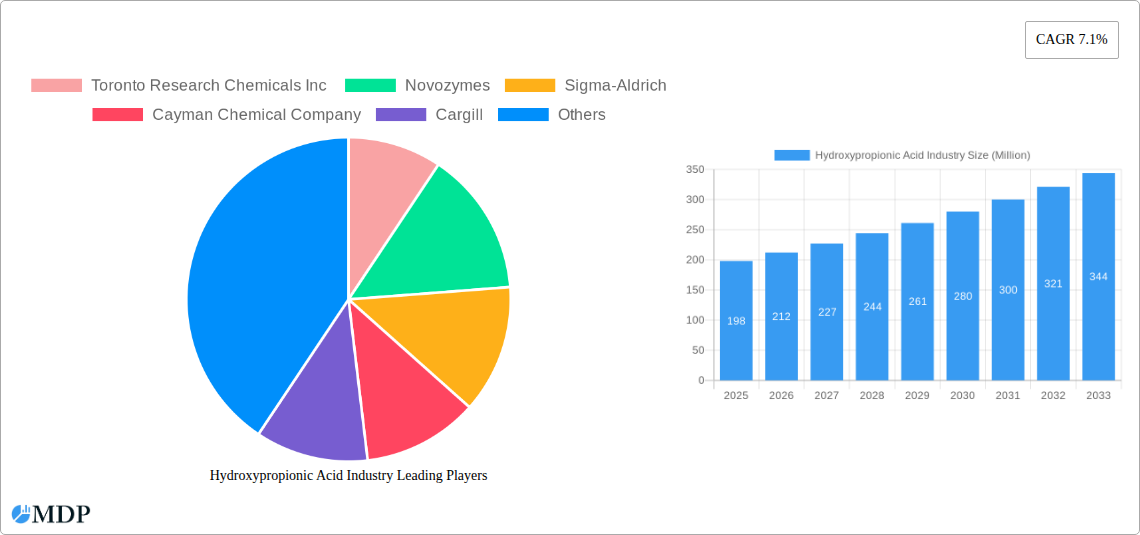
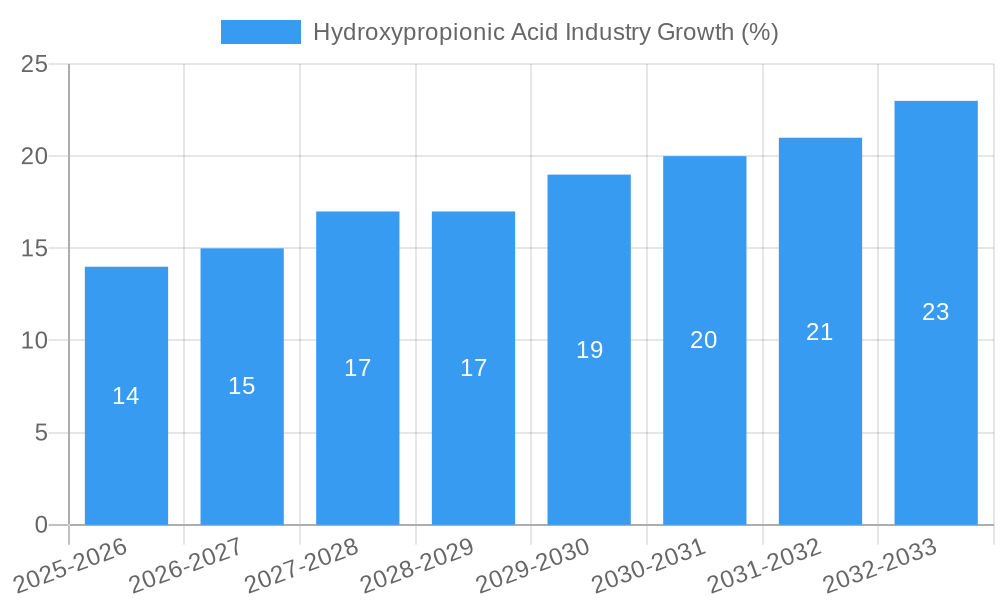
The Hydroxypropionic Acid (HPA) market, valued at $198 million in 2025, is projected to experience robust growth, driven by its increasing applications in diverse sectors. A Compound Annual Growth Rate (CAGR) of 7.1% from 2025 to 2033 indicates a significant market expansion, primarily fueled by the rising demand for high-performance coatings in construction and automotive industries, as well as the growing use of HPA as a key building block in various polymers and adhesives. The liquid form of HPA currently dominates the product segment due to its ease of handling and application in various processes, although powder form is gaining traction due to its advantages in storage and transportation. The paints and coatings application segment represents a major share of the market, followed by the polymer and adhesives and sealants sectors, indicating a strong correlation between HPA market growth and the expansion of these downstream industries. While the market faces challenges related to the potential toxicity of some HPA derivatives and the need for sustainable production methods, ongoing research and development efforts focused on improving the environmental profile and expanding application areas are expected to mitigate these restraints. Geographic expansion, particularly in the Asia-Pacific region driven by increasing industrialization and infrastructure development, presents a significant growth opportunity. Major players such as BASF SE, Sigma-Aldrich, and Novozymes are actively engaged in enhancing their HPA production capacity and diversifying their product portfolio to capture market share.
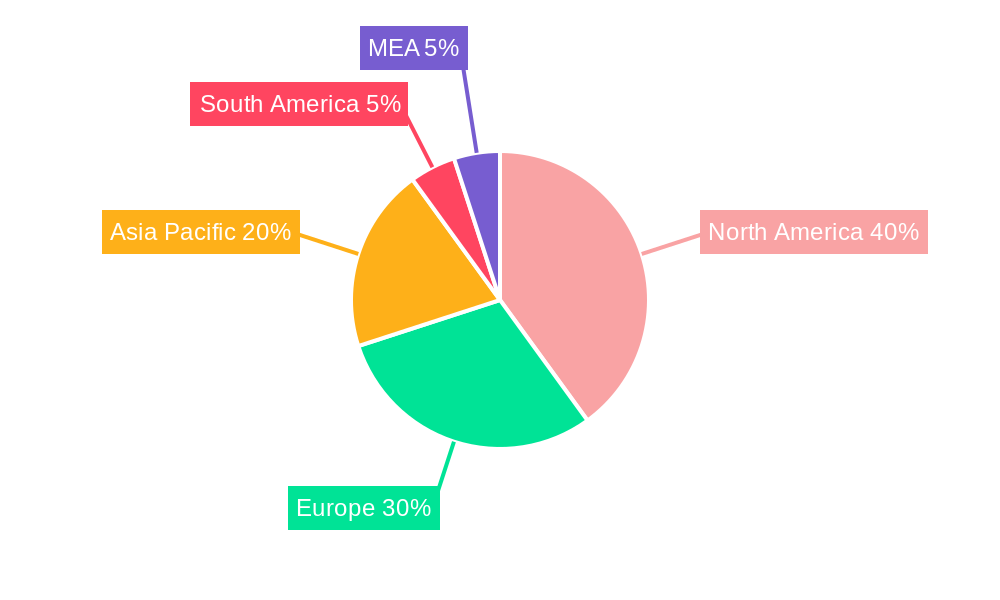
The North American region currently holds a dominant position in the HPA market, largely attributed to established industrial infrastructure and a high demand from established industries. However, the Asia-Pacific region is poised for rapid growth in the coming years due to its burgeoning manufacturing sector and increasing investments in infrastructure projects. European markets are anticipated to maintain a steady growth rate, driven by the region's focus on sustainable materials and the adoption of eco-friendly manufacturing processes. South America and MEA regions, while currently holding smaller market shares, are expected to witness gradual growth driven by increasing industrial activity and rising disposable incomes. The competitive landscape is characterized by the presence of both large multinational chemical companies and specialized chemical manufacturers, leading to innovation in production technologies and product offerings to cater to the evolving needs of various application segments. Continued focus on research and development will play a crucial role in driving further market expansion and diversification.
Hydroxypropionic Acid Industry Market Report: 2019-2033 Forecast
This comprehensive report provides an in-depth analysis of the Hydroxypropionic Acid industry, offering invaluable insights for stakeholders seeking to navigate this dynamic market. With a study period spanning 2019-2033, a base year of 2025, and a forecast period of 2025-2033, this report delivers actionable intelligence for informed decision-making. The report covers key market segments, including Powder and Liquid products, and applications spanning Paints and Coatings, Polymers, Adhesives and Sealants, and Others. Leading players like Toronto Research Chemicals Inc, Novozymes, Sigma-Aldrich, and more are profiled, providing a competitive landscape overview.
Hydroxypropionic Acid Industry Market Dynamics & Concentration
The Hydroxypropionic Acid market exhibits a moderately concentrated structure, with the top 5 players holding an estimated xx% market share in 2025. Innovation is driven primarily by advancements in synthesis techniques and the exploration of novel applications. Regulatory frameworks vary across regions, influencing market access and product approvals. While few direct substitutes exist, competition arises from alternative chemicals with similar functionalities. End-user trends indicate a growing demand from the paints and coatings sector, fueled by increasing construction activities and a preference for high-performance materials. M&A activity has been relatively low in recent years, with approximately xx deals recorded between 2019 and 2024, primarily focused on strengthening supply chains and expanding product portfolios.
- Market Concentration: Top 5 players hold approximately xx% market share (2025).
- Innovation Drivers: Advanced synthesis, novel application exploration.
- Regulatory Landscape: Varies regionally, impacting market access.
- Product Substitutes: Limited direct substitutes, competition from functional alternatives.
- End-User Trends: Growing demand from paints and coatings sector.
- M&A Activity: Approximately xx deals (2019-2024), focused on supply chain and portfolio expansion.
Hydroxypropionic Acid Industry Industry Trends & Analysis
The Hydroxypropionic Acid market is projected to experience a CAGR of xx% during the forecast period (2025-2033), driven by increasing demand from diverse industries. Technological disruptions, such as the development of more efficient and sustainable production methods, are contributing to market growth. Consumer preferences for environmentally friendly and high-performance materials are also influencing market dynamics. Intense competition among key players is leading to product diversification and strategic partnerships. Market penetration in emerging economies is expected to increase significantly, further fueling market expansion. The global market size is estimated at $xx Million in 2025 and is projected to reach $xx Million by 2033.
Leading Markets & Segments in Hydroxypropionic Acid Industry
The Paints and Coatings application segment dominates the Hydroxypropionic Acid market, accounting for approximately xx% of the total market value in 2025. This dominance is primarily attributed to the increasing use of hydroxypropionic acid-based resins and additives to enhance the performance and durability of paints and coatings. The Powder form of the product holds a larger market share compared to Liquid, driven by ease of handling and storage. Geographically, the North American region is currently the leading market, driven by strong demand from the construction industry and robust economic growth.
- Key Drivers for Paints and Coatings Segment: Increased construction activity, demand for high-performance coatings.
- Key Drivers for Powder Segment: Ease of handling, storage advantages.
- Dominant Region: North America (driven by construction and economic growth).
- Dominant Application: Paints and Coatings (xx% market share in 2025).
- Dominant Product Form: Powder
Hydroxypropionic Acid Industry Product Developments
Recent product innovations focus on developing high-purity grades of hydroxypropionic acid and exploring novel derivatives to cater to specific application requirements. This includes the development of modified hydroxypropionic acid-based polymers with enhanced properties, such as improved adhesion, flexibility, and thermal stability. These advancements contribute to the competitive advantage of key players by offering superior products with enhanced performance and cost-effectiveness.
Key Drivers of Hydroxypropionic Acid Industry Growth
The Hydroxypropionic Acid market is propelled by several factors, including the increasing demand for high-performance materials in diverse industries, advancements in synthesis technologies leading to cost reduction, and favorable government regulations promoting the use of sustainable chemicals. Furthermore, the growing construction industry and expanding automotive sector are key drivers of market growth.
Challenges in the Hydroxypropionic Acid Industry Market
The Hydroxypropionic Acid market faces challenges such as price volatility of raw materials, fluctuations in energy costs, and intense competition among numerous players. Regulatory hurdles and environmental concerns also pose challenges to market expansion. These factors can lead to supply chain disruptions and affect profitability.
Emerging Opportunities in Hydroxypropionic Acid Industry
Emerging opportunities lie in the development of new applications in rapidly growing sectors like renewable energy and bio-based materials. Strategic partnerships and collaborations will facilitate market penetration into new geographical regions, creating long-term growth catalysts. Furthermore, technological advancements in production and processing will further enhance efficiency and reduce costs.
Leading Players in the Hydroxypropionic Acid Industry Sector
- Toronto Research Chemicals Inc
- Novozymes
- Sigma-Aldrich
- Cayman Chemical Company
- Cargill
- TCI N V
- BASF SE
- Dalton Research Molecules
- Spectrum Chemical Manufacturing Corp
- Alfa Aesar (Thermo Fisher Scientific)
- SynQuest Laboratories
- Capot chemical
- Oakwood Products Inc
Key Milestones in Hydroxypropionic Acid Industry Industry
- 2020: Introduction of a new, high-purity grade of hydroxypropionic acid by Sigma-Aldrich.
- 2022: Partnership between Novozymes and Cargill to develop sustainable production methods.
- 2023: Launch of a novel hydroxypropionic acid-based polymer by BASF SE.
- 2024: Acquisition of a smaller hydroxypropionic acid producer by Toronto Research Chemicals Inc. (Further specific dates and details would require additional research)
Strategic Outlook for Hydroxypropionic Acid Industry Market
The Hydroxypropionic Acid market presents significant future potential driven by increasing demand across various end-use sectors. Strategic opportunities include expanding into new geographical markets, focusing on innovation and product diversification, and forming strategic partnerships to enhance supply chain efficiency and market access. A focus on sustainability and eco-friendly production methods will be crucial for long-term success.
Hydroxypropionic Acid Industry Segmentation
-
1. Product
- 1.1. Powder
- 1.2. Liquid
-
2. Application
- 2.1. Paints and Coatings
- 2.2. Polymer
- 2.3. Adhesives and Sealants
- 2.4. Others
Hydroxypropionic Acid Industry Segmentation By Geography
-
1. Asia Pacific
- 1.1. China
- 1.2. India
- 1.3. Japan
- 1.4. South Korea
- 1.5. Rest of Asia Pacific
-
2. North America
- 2.1. United States
- 2.2. Canada
- 2.3. Mexico
-
3. Europe
- 3.1. Germany
- 3.2. United Kingdom
- 3.3. France
- 3.4. Italy
- 3.5. Rest of Europe
-
4. South America
- 4.1. Brazil
- 4.2. Argentina
- 4.3. Rest of South America
-
5. Middle East and Africa
- 5.1. Saudi Arabia
- 5.2. South Africa
- 5.3. Rest of Middle East and Africa
Hydroxypropionic Acid Industry REPORT HIGHLIGHTS
| Aspects | Details |
|---|---|
| Study Period | 2019-2033 |
| Base Year | 2024 |
| Estimated Year | 2025 |
| Forecast Period | 2025-2033 |
| Historical Period | 2019-2024 |
| Growth Rate | CAGR of 7.1% from 2019-2033 |
| Segmentation |
|
Table of Contents
- 1. Introduction
- 1.1. Research Scope
- 1.2. Market Segmentation
- 1.3. Research Methodology
- 1.4. Definitions and Assumptions
- 2. Executive Summary
- 2.1. Introduction
- 3. Market Dynamics
- 3.1. Introduction
- 3.2. Market Drivers
- 3.2.1. ; Growing Demand from Paints and Coatings Sector; Other Drivers
- 3.3. Market Restrains
- 3.3.1. ; Unfavorable Conditions Arising Due to COVID-19 Outbreak; Other Restraints
- 3.4. Market Trends
- 3.4.1. Paints and Coatings Sector to Dominate the Market
- 4. Market Factor Analysis
- 4.1. Porters Five Forces
- 4.2. Supply/Value Chain
- 4.3. PESTEL analysis
- 4.4. Market Entropy
- 4.5. Patent/Trademark Analysis
- 5. Global Hydroxypropionic Acid Industry Analysis, Insights and Forecast, 2019-2031
- 5.1. Market Analysis, Insights and Forecast - by Product
- 5.1.1. Powder
- 5.1.2. Liquid
- 5.2. Market Analysis, Insights and Forecast - by Application
- 5.2.1. Paints and Coatings
- 5.2.2. Polymer
- 5.2.3. Adhesives and Sealants
- 5.2.4. Others
- 5.3. Market Analysis, Insights and Forecast - by Region
- 5.3.1. Asia Pacific
- 5.3.2. North America
- 5.3.3. Europe
- 5.3.4. South America
- 5.3.5. Middle East and Africa
- 5.1. Market Analysis, Insights and Forecast - by Product
- 6. Asia Pacific Hydroxypropionic Acid Industry Analysis, Insights and Forecast, 2019-2031
- 6.1. Market Analysis, Insights and Forecast - by Product
- 6.1.1. Powder
- 6.1.2. Liquid
- 6.2. Market Analysis, Insights and Forecast - by Application
- 6.2.1. Paints and Coatings
- 6.2.2. Polymer
- 6.2.3. Adhesives and Sealants
- 6.2.4. Others
- 6.1. Market Analysis, Insights and Forecast - by Product
- 7. North America Hydroxypropionic Acid Industry Analysis, Insights and Forecast, 2019-2031
- 7.1. Market Analysis, Insights and Forecast - by Product
- 7.1.1. Powder
- 7.1.2. Liquid
- 7.2. Market Analysis, Insights and Forecast - by Application
- 7.2.1. Paints and Coatings
- 7.2.2. Polymer
- 7.2.3. Adhesives and Sealants
- 7.2.4. Others
- 7.1. Market Analysis, Insights and Forecast - by Product
- 8. Europe Hydroxypropionic Acid Industry Analysis, Insights and Forecast, 2019-2031
- 8.1. Market Analysis, Insights and Forecast - by Product
- 8.1.1. Powder
- 8.1.2. Liquid
- 8.2. Market Analysis, Insights and Forecast - by Application
- 8.2.1. Paints and Coatings
- 8.2.2. Polymer
- 8.2.3. Adhesives and Sealants
- 8.2.4. Others
- 8.1. Market Analysis, Insights and Forecast - by Product
- 9. South America Hydroxypropionic Acid Industry Analysis, Insights and Forecast, 2019-2031
- 9.1. Market Analysis, Insights and Forecast - by Product
- 9.1.1. Powder
- 9.1.2. Liquid
- 9.2. Market Analysis, Insights and Forecast - by Application
- 9.2.1. Paints and Coatings
- 9.2.2. Polymer
- 9.2.3. Adhesives and Sealants
- 9.2.4. Others
- 9.1. Market Analysis, Insights and Forecast - by Product
- 10. Middle East and Africa Hydroxypropionic Acid Industry Analysis, Insights and Forecast, 2019-2031
- 10.1. Market Analysis, Insights and Forecast - by Product
- 10.1.1. Powder
- 10.1.2. Liquid
- 10.2. Market Analysis, Insights and Forecast - by Application
- 10.2.1. Paints and Coatings
- 10.2.2. Polymer
- 10.2.3. Adhesives and Sealants
- 10.2.4. Others
- 10.1. Market Analysis, Insights and Forecast - by Product
- 11. North America Hydroxypropionic Acid Industry Analysis, Insights and Forecast, 2019-2031
- 11.1. Market Analysis, Insights and Forecast - By Country/Sub-region
- 11.1.1 United States
- 11.1.2 Canada
- 11.1.3 Mexico
- 12. Europe Hydroxypropionic Acid Industry Analysis, Insights and Forecast, 2019-2031
- 12.1. Market Analysis, Insights and Forecast - By Country/Sub-region
- 12.1.1 Germany
- 12.1.2 France
- 12.1.3 Italy
- 12.1.4 United Kingdom
- 12.1.5 Netherlands
- 12.1.6 Rest of Europe
- 13. Asia Pacific Hydroxypropionic Acid Industry Analysis, Insights and Forecast, 2019-2031
- 13.1. Market Analysis, Insights and Forecast - By Country/Sub-region
- 13.1.1 China
- 13.1.2 Japan
- 13.1.3 India
- 13.1.4 South Korea
- 13.1.5 Taiwan
- 13.1.6 Australia
- 13.1.7 Rest of Asia-Pacific
- 14. South America Hydroxypropionic Acid Industry Analysis, Insights and Forecast, 2019-2031
- 14.1. Market Analysis, Insights and Forecast - By Country/Sub-region
- 14.1.1 Brazil
- 14.1.2 Argentina
- 14.1.3 Rest of South America
- 15. MEA Hydroxypropionic Acid Industry Analysis, Insights and Forecast, 2019-2031
- 15.1. Market Analysis, Insights and Forecast - By Country/Sub-region
- 15.1.1 Middle East
- 15.1.2 Africa
- 16. Competitive Analysis
- 16.1. Global Market Share Analysis 2024
- 16.2. Company Profiles
- 16.2.1 Toronto Research Chemicals Inc
- 16.2.1.1. Overview
- 16.2.1.2. Products
- 16.2.1.3. SWOT Analysis
- 16.2.1.4. Recent Developments
- 16.2.1.5. Financials (Based on Availability)
- 16.2.2 Novozymes
- 16.2.2.1. Overview
- 16.2.2.2. Products
- 16.2.2.3. SWOT Analysis
- 16.2.2.4. Recent Developments
- 16.2.2.5. Financials (Based on Availability)
- 16.2.3 Sigma-Aldrich
- 16.2.3.1. Overview
- 16.2.3.2. Products
- 16.2.3.3. SWOT Analysis
- 16.2.3.4. Recent Developments
- 16.2.3.5. Financials (Based on Availability)
- 16.2.4 Cayman Chemical Company
- 16.2.4.1. Overview
- 16.2.4.2. Products
- 16.2.4.3. SWOT Analysis
- 16.2.4.4. Recent Developments
- 16.2.4.5. Financials (Based on Availability)
- 16.2.5 Cargill
- 16.2.5.1. Overview
- 16.2.5.2. Products
- 16.2.5.3. SWOT Analysis
- 16.2.5.4. Recent Developments
- 16.2.5.5. Financials (Based on Availability)
- 16.2.6 TCI N V
- 16.2.6.1. Overview
- 16.2.6.2. Products
- 16.2.6.3. SWOT Analysis
- 16.2.6.4. Recent Developments
- 16.2.6.5. Financials (Based on Availability)
- 16.2.7 BASF SE
- 16.2.7.1. Overview
- 16.2.7.2. Products
- 16.2.7.3. SWOT Analysis
- 16.2.7.4. Recent Developments
- 16.2.7.5. Financials (Based on Availability)
- 16.2.8 Dalton Research Molecules
- 16.2.8.1. Overview
- 16.2.8.2. Products
- 16.2.8.3. SWOT Analysis
- 16.2.8.4. Recent Developments
- 16.2.8.5. Financials (Based on Availability)
- 16.2.9 Spectrum Chemical Manufacturing Corp
- 16.2.9.1. Overview
- 16.2.9.2. Products
- 16.2.9.3. SWOT Analysis
- 16.2.9.4. Recent Developments
- 16.2.9.5. Financials (Based on Availability)
- 16.2.10 Alfa Aesar (Thermo Fisher Scientific)
- 16.2.10.1. Overview
- 16.2.10.2. Products
- 16.2.10.3. SWOT Analysis
- 16.2.10.4. Recent Developments
- 16.2.10.5. Financials (Based on Availability)
- 16.2.11 SynQuest Laboratories
- 16.2.11.1. Overview
- 16.2.11.2. Products
- 16.2.11.3. SWOT Analysis
- 16.2.11.4. Recent Developments
- 16.2.11.5. Financials (Based on Availability)
- 16.2.12 Capot chemical
- 16.2.12.1. Overview
- 16.2.12.2. Products
- 16.2.12.3. SWOT Analysis
- 16.2.12.4. Recent Developments
- 16.2.12.5. Financials (Based on Availability)
- 16.2.13 Oakwood Products Inc
- 16.2.13.1. Overview
- 16.2.13.2. Products
- 16.2.13.3. SWOT Analysis
- 16.2.13.4. Recent Developments
- 16.2.13.5. Financials (Based on Availability)
- 16.2.1 Toronto Research Chemicals Inc
List of Figures
- Figure 1: Global Hydroxypropionic Acid Industry Revenue Breakdown (Million, %) by Region 2024 & 2032
- Figure 2: Global Hydroxypropionic Acid Industry Volume Breakdown (K Tons, %) by Region 2024 & 2032
- Figure 3: North America Hydroxypropionic Acid Industry Revenue (Million), by Country 2024 & 2032
- Figure 4: North America Hydroxypropionic Acid Industry Volume (K Tons), by Country 2024 & 2032
- Figure 5: North America Hydroxypropionic Acid Industry Revenue Share (%), by Country 2024 & 2032
- Figure 6: North America Hydroxypropionic Acid Industry Volume Share (%), by Country 2024 & 2032
- Figure 7: Europe Hydroxypropionic Acid Industry Revenue (Million), by Country 2024 & 2032
- Figure 8: Europe Hydroxypropionic Acid Industry Volume (K Tons), by Country 2024 & 2032
- Figure 9: Europe Hydroxypropionic Acid Industry Revenue Share (%), by Country 2024 & 2032
- Figure 10: Europe Hydroxypropionic Acid Industry Volume Share (%), by Country 2024 & 2032
- Figure 11: Asia Pacific Hydroxypropionic Acid Industry Revenue (Million), by Country 2024 & 2032
- Figure 12: Asia Pacific Hydroxypropionic Acid Industry Volume (K Tons), by Country 2024 & 2032
- Figure 13: Asia Pacific Hydroxypropionic Acid Industry Revenue Share (%), by Country 2024 & 2032
- Figure 14: Asia Pacific Hydroxypropionic Acid Industry Volume Share (%), by Country 2024 & 2032
- Figure 15: South America Hydroxypropionic Acid Industry Revenue (Million), by Country 2024 & 2032
- Figure 16: South America Hydroxypropionic Acid Industry Volume (K Tons), by Country 2024 & 2032
- Figure 17: South America Hydroxypropionic Acid Industry Revenue Share (%), by Country 2024 & 2032
- Figure 18: South America Hydroxypropionic Acid Industry Volume Share (%), by Country 2024 & 2032
- Figure 19: MEA Hydroxypropionic Acid Industry Revenue (Million), by Country 2024 & 2032
- Figure 20: MEA Hydroxypropionic Acid Industry Volume (K Tons), by Country 2024 & 2032
- Figure 21: MEA Hydroxypropionic Acid Industry Revenue Share (%), by Country 2024 & 2032
- Figure 22: MEA Hydroxypropionic Acid Industry Volume Share (%), by Country 2024 & 2032
- Figure 23: Asia Pacific Hydroxypropionic Acid Industry Revenue (Million), by Product 2024 & 2032
- Figure 24: Asia Pacific Hydroxypropionic Acid Industry Volume (K Tons), by Product 2024 & 2032
- Figure 25: Asia Pacific Hydroxypropionic Acid Industry Revenue Share (%), by Product 2024 & 2032
- Figure 26: Asia Pacific Hydroxypropionic Acid Industry Volume Share (%), by Product 2024 & 2032
- Figure 27: Asia Pacific Hydroxypropionic Acid Industry Revenue (Million), by Application 2024 & 2032
- Figure 28: Asia Pacific Hydroxypropionic Acid Industry Volume (K Tons), by Application 2024 & 2032
- Figure 29: Asia Pacific Hydroxypropionic Acid Industry Revenue Share (%), by Application 2024 & 2032
- Figure 30: Asia Pacific Hydroxypropionic Acid Industry Volume Share (%), by Application 2024 & 2032
- Figure 31: Asia Pacific Hydroxypropionic Acid Industry Revenue (Million), by Country 2024 & 2032
- Figure 32: Asia Pacific Hydroxypropionic Acid Industry Volume (K Tons), by Country 2024 & 2032
- Figure 33: Asia Pacific Hydroxypropionic Acid Industry Revenue Share (%), by Country 2024 & 2032
- Figure 34: Asia Pacific Hydroxypropionic Acid Industry Volume Share (%), by Country 2024 & 2032
- Figure 35: North America Hydroxypropionic Acid Industry Revenue (Million), by Product 2024 & 2032
- Figure 36: North America Hydroxypropionic Acid Industry Volume (K Tons), by Product 2024 & 2032
- Figure 37: North America Hydroxypropionic Acid Industry Revenue Share (%), by Product 2024 & 2032
- Figure 38: North America Hydroxypropionic Acid Industry Volume Share (%), by Product 2024 & 2032
- Figure 39: North America Hydroxypropionic Acid Industry Revenue (Million), by Application 2024 & 2032
- Figure 40: North America Hydroxypropionic Acid Industry Volume (K Tons), by Application 2024 & 2032
- Figure 41: North America Hydroxypropionic Acid Industry Revenue Share (%), by Application 2024 & 2032
- Figure 42: North America Hydroxypropionic Acid Industry Volume Share (%), by Application 2024 & 2032
- Figure 43: North America Hydroxypropionic Acid Industry Revenue (Million), by Country 2024 & 2032
- Figure 44: North America Hydroxypropionic Acid Industry Volume (K Tons), by Country 2024 & 2032
- Figure 45: North America Hydroxypropionic Acid Industry Revenue Share (%), by Country 2024 & 2032
- Figure 46: North America Hydroxypropionic Acid Industry Volume Share (%), by Country 2024 & 2032
- Figure 47: Europe Hydroxypropionic Acid Industry Revenue (Million), by Product 2024 & 2032
- Figure 48: Europe Hydroxypropionic Acid Industry Volume (K Tons), by Product 2024 & 2032
- Figure 49: Europe Hydroxypropionic Acid Industry Revenue Share (%), by Product 2024 & 2032
- Figure 50: Europe Hydroxypropionic Acid Industry Volume Share (%), by Product 2024 & 2032
- Figure 51: Europe Hydroxypropionic Acid Industry Revenue (Million), by Application 2024 & 2032
- Figure 52: Europe Hydroxypropionic Acid Industry Volume (K Tons), by Application 2024 & 2032
- Figure 53: Europe Hydroxypropionic Acid Industry Revenue Share (%), by Application 2024 & 2032
- Figure 54: Europe Hydroxypropionic Acid Industry Volume Share (%), by Application 2024 & 2032
- Figure 55: Europe Hydroxypropionic Acid Industry Revenue (Million), by Country 2024 & 2032
- Figure 56: Europe Hydroxypropionic Acid Industry Volume (K Tons), by Country 2024 & 2032
- Figure 57: Europe Hydroxypropionic Acid Industry Revenue Share (%), by Country 2024 & 2032
- Figure 58: Europe Hydroxypropionic Acid Industry Volume Share (%), by Country 2024 & 2032
- Figure 59: South America Hydroxypropionic Acid Industry Revenue (Million), by Product 2024 & 2032
- Figure 60: South America Hydroxypropionic Acid Industry Volume (K Tons), by Product 2024 & 2032
- Figure 61: South America Hydroxypropionic Acid Industry Revenue Share (%), by Product 2024 & 2032
- Figure 62: South America Hydroxypropionic Acid Industry Volume Share (%), by Product 2024 & 2032
- Figure 63: South America Hydroxypropionic Acid Industry Revenue (Million), by Application 2024 & 2032
- Figure 64: South America Hydroxypropionic Acid Industry Volume (K Tons), by Application 2024 & 2032
- Figure 65: South America Hydroxypropionic Acid Industry Revenue Share (%), by Application 2024 & 2032
- Figure 66: South America Hydroxypropionic Acid Industry Volume Share (%), by Application 2024 & 2032
- Figure 67: South America Hydroxypropionic Acid Industry Revenue (Million), by Country 2024 & 2032
- Figure 68: South America Hydroxypropionic Acid Industry Volume (K Tons), by Country 2024 & 2032
- Figure 69: South America Hydroxypropionic Acid Industry Revenue Share (%), by Country 2024 & 2032
- Figure 70: South America Hydroxypropionic Acid Industry Volume Share (%), by Country 2024 & 2032
- Figure 71: Middle East and Africa Hydroxypropionic Acid Industry Revenue (Million), by Product 2024 & 2032
- Figure 72: Middle East and Africa Hydroxypropionic Acid Industry Volume (K Tons), by Product 2024 & 2032
- Figure 73: Middle East and Africa Hydroxypropionic Acid Industry Revenue Share (%), by Product 2024 & 2032
- Figure 74: Middle East and Africa Hydroxypropionic Acid Industry Volume Share (%), by Product 2024 & 2032
- Figure 75: Middle East and Africa Hydroxypropionic Acid Industry Revenue (Million), by Application 2024 & 2032
- Figure 76: Middle East and Africa Hydroxypropionic Acid Industry Volume (K Tons), by Application 2024 & 2032
- Figure 77: Middle East and Africa Hydroxypropionic Acid Industry Revenue Share (%), by Application 2024 & 2032
- Figure 78: Middle East and Africa Hydroxypropionic Acid Industry Volume Share (%), by Application 2024 & 2032
- Figure 79: Middle East and Africa Hydroxypropionic Acid Industry Revenue (Million), by Country 2024 & 2032
- Figure 80: Middle East and Africa Hydroxypropionic Acid Industry Volume (K Tons), by Country 2024 & 2032
- Figure 81: Middle East and Africa Hydroxypropionic Acid Industry Revenue Share (%), by Country 2024 & 2032
- Figure 82: Middle East and Africa Hydroxypropionic Acid Industry Volume Share (%), by Country 2024 & 2032
List of Tables
- Table 1: Global Hydroxypropionic Acid Industry Revenue Million Forecast, by Region 2019 & 2032
- Table 2: Global Hydroxypropionic Acid Industry Volume K Tons Forecast, by Region 2019 & 2032
- Table 3: Global Hydroxypropionic Acid Industry Revenue Million Forecast, by Product 2019 & 2032
- Table 4: Global Hydroxypropionic Acid Industry Volume K Tons Forecast, by Product 2019 & 2032
- Table 5: Global Hydroxypropionic Acid Industry Revenue Million Forecast, by Application 2019 & 2032
- Table 6: Global Hydroxypropionic Acid Industry Volume K Tons Forecast, by Application 2019 & 2032
- Table 7: Global Hydroxypropionic Acid Industry Revenue Million Forecast, by Region 2019 & 2032
- Table 8: Global Hydroxypropionic Acid Industry Volume K Tons Forecast, by Region 2019 & 2032
- Table 9: Global Hydroxypropionic Acid Industry Revenue Million Forecast, by Country 2019 & 2032
- Table 10: Global Hydroxypropionic Acid Industry Volume K Tons Forecast, by Country 2019 & 2032
- Table 11: United States Hydroxypropionic Acid Industry Revenue (Million) Forecast, by Application 2019 & 2032
- Table 12: United States Hydroxypropionic Acid Industry Volume (K Tons) Forecast, by Application 2019 & 2032
- Table 13: Canada Hydroxypropionic Acid Industry Revenue (Million) Forecast, by Application 2019 & 2032
- Table 14: Canada Hydroxypropionic Acid Industry Volume (K Tons) Forecast, by Application 2019 & 2032
- Table 15: Mexico Hydroxypropionic Acid Industry Revenue (Million) Forecast, by Application 2019 & 2032
- Table 16: Mexico Hydroxypropionic Acid Industry Volume (K Tons) Forecast, by Application 2019 & 2032
- Table 17: Global Hydroxypropionic Acid Industry Revenue Million Forecast, by Country 2019 & 2032
- Table 18: Global Hydroxypropionic Acid Industry Volume K Tons Forecast, by Country 2019 & 2032
- Table 19: Germany Hydroxypropionic Acid Industry Revenue (Million) Forecast, by Application 2019 & 2032
- Table 20: Germany Hydroxypropionic Acid Industry Volume (K Tons) Forecast, by Application 2019 & 2032
- Table 21: France Hydroxypropionic Acid Industry Revenue (Million) Forecast, by Application 2019 & 2032
- Table 22: France Hydroxypropionic Acid Industry Volume (K Tons) Forecast, by Application 2019 & 2032
- Table 23: Italy Hydroxypropionic Acid Industry Revenue (Million) Forecast, by Application 2019 & 2032
- Table 24: Italy Hydroxypropionic Acid Industry Volume (K Tons) Forecast, by Application 2019 & 2032
- Table 25: United Kingdom Hydroxypropionic Acid Industry Revenue (Million) Forecast, by Application 2019 & 2032
- Table 26: United Kingdom Hydroxypropionic Acid Industry Volume (K Tons) Forecast, by Application 2019 & 2032
- Table 27: Netherlands Hydroxypropionic Acid Industry Revenue (Million) Forecast, by Application 2019 & 2032
- Table 28: Netherlands Hydroxypropionic Acid Industry Volume (K Tons) Forecast, by Application 2019 & 2032
- Table 29: Rest of Europe Hydroxypropionic Acid Industry Revenue (Million) Forecast, by Application 2019 & 2032
- Table 30: Rest of Europe Hydroxypropionic Acid Industry Volume (K Tons) Forecast, by Application 2019 & 2032
- Table 31: Global Hydroxypropionic Acid Industry Revenue Million Forecast, by Country 2019 & 2032
- Table 32: Global Hydroxypropionic Acid Industry Volume K Tons Forecast, by Country 2019 & 2032
- Table 33: China Hydroxypropionic Acid Industry Revenue (Million) Forecast, by Application 2019 & 2032
- Table 34: China Hydroxypropionic Acid Industry Volume (K Tons) Forecast, by Application 2019 & 2032
- Table 35: Japan Hydroxypropionic Acid Industry Revenue (Million) Forecast, by Application 2019 & 2032
- Table 36: Japan Hydroxypropionic Acid Industry Volume (K Tons) Forecast, by Application 2019 & 2032
- Table 37: India Hydroxypropionic Acid Industry Revenue (Million) Forecast, by Application 2019 & 2032
- Table 38: India Hydroxypropionic Acid Industry Volume (K Tons) Forecast, by Application 2019 & 2032
- Table 39: South Korea Hydroxypropionic Acid Industry Revenue (Million) Forecast, by Application 2019 & 2032
- Table 40: South Korea Hydroxypropionic Acid Industry Volume (K Tons) Forecast, by Application 2019 & 2032
- Table 41: Taiwan Hydroxypropionic Acid Industry Revenue (Million) Forecast, by Application 2019 & 2032
- Table 42: Taiwan Hydroxypropionic Acid Industry Volume (K Tons) Forecast, by Application 2019 & 2032
- Table 43: Australia Hydroxypropionic Acid Industry Revenue (Million) Forecast, by Application 2019 & 2032
- Table 44: Australia Hydroxypropionic Acid Industry Volume (K Tons) Forecast, by Application 2019 & 2032
- Table 45: Rest of Asia-Pacific Hydroxypropionic Acid Industry Revenue (Million) Forecast, by Application 2019 & 2032
- Table 46: Rest of Asia-Pacific Hydroxypropionic Acid Industry Volume (K Tons) Forecast, by Application 2019 & 2032
- Table 47: Global Hydroxypropionic Acid Industry Revenue Million Forecast, by Country 2019 & 2032
- Table 48: Global Hydroxypropionic Acid Industry Volume K Tons Forecast, by Country 2019 & 2032
- Table 49: Brazil Hydroxypropionic Acid Industry Revenue (Million) Forecast, by Application 2019 & 2032
- Table 50: Brazil Hydroxypropionic Acid Industry Volume (K Tons) Forecast, by Application 2019 & 2032
- Table 51: Argentina Hydroxypropionic Acid Industry Revenue (Million) Forecast, by Application 2019 & 2032
- Table 52: Argentina Hydroxypropionic Acid Industry Volume (K Tons) Forecast, by Application 2019 & 2032
- Table 53: Rest of South America Hydroxypropionic Acid Industry Revenue (Million) Forecast, by Application 2019 & 2032
- Table 54: Rest of South America Hydroxypropionic Acid Industry Volume (K Tons) Forecast, by Application 2019 & 2032
- Table 55: Global Hydroxypropionic Acid Industry Revenue Million Forecast, by Country 2019 & 2032
- Table 56: Global Hydroxypropionic Acid Industry Volume K Tons Forecast, by Country 2019 & 2032
- Table 57: Middle East Hydroxypropionic Acid Industry Revenue (Million) Forecast, by Application 2019 & 2032
- Table 58: Middle East Hydroxypropionic Acid Industry Volume (K Tons) Forecast, by Application 2019 & 2032
- Table 59: Africa Hydroxypropionic Acid Industry Revenue (Million) Forecast, by Application 2019 & 2032
- Table 60: Africa Hydroxypropionic Acid Industry Volume (K Tons) Forecast, by Application 2019 & 2032
- Table 61: Global Hydroxypropionic Acid Industry Revenue Million Forecast, by Product 2019 & 2032
- Table 62: Global Hydroxypropionic Acid Industry Volume K Tons Forecast, by Product 2019 & 2032
- Table 63: Global Hydroxypropionic Acid Industry Revenue Million Forecast, by Application 2019 & 2032
- Table 64: Global Hydroxypropionic Acid Industry Volume K Tons Forecast, by Application 2019 & 2032
- Table 65: Global Hydroxypropionic Acid Industry Revenue Million Forecast, by Country 2019 & 2032
- Table 66: Global Hydroxypropionic Acid Industry Volume K Tons Forecast, by Country 2019 & 2032
- Table 67: China Hydroxypropionic Acid Industry Revenue (Million) Forecast, by Application 2019 & 2032
- Table 68: China Hydroxypropionic Acid Industry Volume (K Tons) Forecast, by Application 2019 & 2032
- Table 69: India Hydroxypropionic Acid Industry Revenue (Million) Forecast, by Application 2019 & 2032
- Table 70: India Hydroxypropionic Acid Industry Volume (K Tons) Forecast, by Application 2019 & 2032
- Table 71: Japan Hydroxypropionic Acid Industry Revenue (Million) Forecast, by Application 2019 & 2032
- Table 72: Japan Hydroxypropionic Acid Industry Volume (K Tons) Forecast, by Application 2019 & 2032
- Table 73: South Korea Hydroxypropionic Acid Industry Revenue (Million) Forecast, by Application 2019 & 2032
- Table 74: South Korea Hydroxypropionic Acid Industry Volume (K Tons) Forecast, by Application 2019 & 2032
- Table 75: Rest of Asia Pacific Hydroxypropionic Acid Industry Revenue (Million) Forecast, by Application 2019 & 2032
- Table 76: Rest of Asia Pacific Hydroxypropionic Acid Industry Volume (K Tons) Forecast, by Application 2019 & 2032
- Table 77: Global Hydroxypropionic Acid Industry Revenue Million Forecast, by Product 2019 & 2032
- Table 78: Global Hydroxypropionic Acid Industry Volume K Tons Forecast, by Product 2019 & 2032
- Table 79: Global Hydroxypropionic Acid Industry Revenue Million Forecast, by Application 2019 & 2032
- Table 80: Global Hydroxypropionic Acid Industry Volume K Tons Forecast, by Application 2019 & 2032
- Table 81: Global Hydroxypropionic Acid Industry Revenue Million Forecast, by Country 2019 & 2032
- Table 82: Global Hydroxypropionic Acid Industry Volume K Tons Forecast, by Country 2019 & 2032
- Table 83: United States Hydroxypropionic Acid Industry Revenue (Million) Forecast, by Application 2019 & 2032
- Table 84: United States Hydroxypropionic Acid Industry Volume (K Tons) Forecast, by Application 2019 & 2032
- Table 85: Canada Hydroxypropionic Acid Industry Revenue (Million) Forecast, by Application 2019 & 2032
- Table 86: Canada Hydroxypropionic Acid Industry Volume (K Tons) Forecast, by Application 2019 & 2032
- Table 87: Mexico Hydroxypropionic Acid Industry Revenue (Million) Forecast, by Application 2019 & 2032
- Table 88: Mexico Hydroxypropionic Acid Industry Volume (K Tons) Forecast, by Application 2019 & 2032
- Table 89: Global Hydroxypropionic Acid Industry Revenue Million Forecast, by Product 2019 & 2032
- Table 90: Global Hydroxypropionic Acid Industry Volume K Tons Forecast, by Product 2019 & 2032
- Table 91: Global Hydroxypropionic Acid Industry Revenue Million Forecast, by Application 2019 & 2032
- Table 92: Global Hydroxypropionic Acid Industry Volume K Tons Forecast, by Application 2019 & 2032
- Table 93: Global Hydroxypropionic Acid Industry Revenue Million Forecast, by Country 2019 & 2032
- Table 94: Global Hydroxypropionic Acid Industry Volume K Tons Forecast, by Country 2019 & 2032
- Table 95: Germany Hydroxypropionic Acid Industry Revenue (Million) Forecast, by Application 2019 & 2032
- Table 96: Germany Hydroxypropionic Acid Industry Volume (K Tons) Forecast, by Application 2019 & 2032
- Table 97: United Kingdom Hydroxypropionic Acid Industry Revenue (Million) Forecast, by Application 2019 & 2032
- Table 98: United Kingdom Hydroxypropionic Acid Industry Volume (K Tons) Forecast, by Application 2019 & 2032
- Table 99: France Hydroxypropionic Acid Industry Revenue (Million) Forecast, by Application 2019 & 2032
- Table 100: France Hydroxypropionic Acid Industry Volume (K Tons) Forecast, by Application 2019 & 2032
- Table 101: Italy Hydroxypropionic Acid Industry Revenue (Million) Forecast, by Application 2019 & 2032
- Table 102: Italy Hydroxypropionic Acid Industry Volume (K Tons) Forecast, by Application 2019 & 2032
- Table 103: Rest of Europe Hydroxypropionic Acid Industry Revenue (Million) Forecast, by Application 2019 & 2032
- Table 104: Rest of Europe Hydroxypropionic Acid Industry Volume (K Tons) Forecast, by Application 2019 & 2032
- Table 105: Global Hydroxypropionic Acid Industry Revenue Million Forecast, by Product 2019 & 2032
- Table 106: Global Hydroxypropionic Acid Industry Volume K Tons Forecast, by Product 2019 & 2032
- Table 107: Global Hydroxypropionic Acid Industry Revenue Million Forecast, by Application 2019 & 2032
- Table 108: Global Hydroxypropionic Acid Industry Volume K Tons Forecast, by Application 2019 & 2032
- Table 109: Global Hydroxypropionic Acid Industry Revenue Million Forecast, by Country 2019 & 2032
- Table 110: Global Hydroxypropionic Acid Industry Volume K Tons Forecast, by Country 2019 & 2032
- Table 111: Brazil Hydroxypropionic Acid Industry Revenue (Million) Forecast, by Application 2019 & 2032
- Table 112: Brazil Hydroxypropionic Acid Industry Volume (K Tons) Forecast, by Application 2019 & 2032
- Table 113: Argentina Hydroxypropionic Acid Industry Revenue (Million) Forecast, by Application 2019 & 2032
- Table 114: Argentina Hydroxypropionic Acid Industry Volume (K Tons) Forecast, by Application 2019 & 2032
- Table 115: Rest of South America Hydroxypropionic Acid Industry Revenue (Million) Forecast, by Application 2019 & 2032
- Table 116: Rest of South America Hydroxypropionic Acid Industry Volume (K Tons) Forecast, by Application 2019 & 2032
- Table 117: Global Hydroxypropionic Acid Industry Revenue Million Forecast, by Product 2019 & 2032
- Table 118: Global Hydroxypropionic Acid Industry Volume K Tons Forecast, by Product 2019 & 2032
- Table 119: Global Hydroxypropionic Acid Industry Revenue Million Forecast, by Application 2019 & 2032
- Table 120: Global Hydroxypropionic Acid Industry Volume K Tons Forecast, by Application 2019 & 2032
- Table 121: Global Hydroxypropionic Acid Industry Revenue Million Forecast, by Country 2019 & 2032
- Table 122: Global Hydroxypropionic Acid Industry Volume K Tons Forecast, by Country 2019 & 2032
- Table 123: Saudi Arabia Hydroxypropionic Acid Industry Revenue (Million) Forecast, by Application 2019 & 2032
- Table 124: Saudi Arabia Hydroxypropionic Acid Industry Volume (K Tons) Forecast, by Application 2019 & 2032
- Table 125: South Africa Hydroxypropionic Acid Industry Revenue (Million) Forecast, by Application 2019 & 2032
- Table 126: South Africa Hydroxypropionic Acid Industry Volume (K Tons) Forecast, by Application 2019 & 2032
- Table 127: Rest of Middle East and Africa Hydroxypropionic Acid Industry Revenue (Million) Forecast, by Application 2019 & 2032
- Table 128: Rest of Middle East and Africa Hydroxypropionic Acid Industry Volume (K Tons) Forecast, by Application 2019 & 2032
Frequently Asked Questions
1. What is the projected Compound Annual Growth Rate (CAGR) of the Hydroxypropionic Acid Industry?
The projected CAGR is approximately 7.1%.
2. Which companies are prominent players in the Hydroxypropionic Acid Industry?
Key companies in the market include Toronto Research Chemicals Inc , Novozymes, Sigma-Aldrich, Cayman Chemical Company, Cargill, TCI N V, BASF SE, Dalton Research Molecules, Spectrum Chemical Manufacturing Corp, Alfa Aesar (Thermo Fisher Scientific), SynQuest Laboratories, Capot chemical, Oakwood Products Inc.
3. What are the main segments of the Hydroxypropionic Acid Industry?
The market segments include Product, Application.
4. Can you provide details about the market size?
The market size is estimated to be USD 198 Million as of 2022.
5. What are some drivers contributing to market growth?
; Growing Demand from Paints and Coatings Sector; Other Drivers.
6. What are the notable trends driving market growth?
Paints and Coatings Sector to Dominate the Market.
7. Are there any restraints impacting market growth?
; Unfavorable Conditions Arising Due to COVID-19 Outbreak; Other Restraints.
8. Can you provide examples of recent developments in the market?
N/A
9. What pricing options are available for accessing the report?
Pricing options include single-user, multi-user, and enterprise licenses priced at USD 4750, USD 5250, and USD 8750 respectively.
10. Is the market size provided in terms of value or volume?
The market size is provided in terms of value, measured in Million and volume, measured in K Tons.
11. Are there any specific market keywords associated with the report?
Yes, the market keyword associated with the report is "Hydroxypropionic Acid Industry," which aids in identifying and referencing the specific market segment covered.
12. How do I determine which pricing option suits my needs best?
The pricing options vary based on user requirements and access needs. Individual users may opt for single-user licenses, while businesses requiring broader access may choose multi-user or enterprise licenses for cost-effective access to the report.
13. Are there any additional resources or data provided in the Hydroxypropionic Acid Industry report?
While the report offers comprehensive insights, it's advisable to review the specific contents or supplementary materials provided to ascertain if additional resources or data are available.
14. How can I stay updated on further developments or reports in the Hydroxypropionic Acid Industry?
To stay informed about further developments, trends, and reports in the Hydroxypropionic Acid Industry, consider subscribing to industry newsletters, following relevant companies and organizations, or regularly checking reputable industry news sources and publications.
Methodology
Step 1 - Identification of Relevant Samples Size from Population Database


Step 2 - Approaches for Defining Global Market Size (Value, Volume* & Price*)

Note*: In applicable scenarios
Step 3 - Data Sources
Primary Research
- Web Analytics
- Survey Reports
- Research Institute
- Latest Research Reports
- Opinion Leaders
Secondary Research
- Annual Reports
- White Paper
- Latest Press Release
- Industry Association
- Paid Database
- Investor Presentations

Step 4 - Data Triangulation
Involves using different sources of information in order to increase the validity of a study
These sources are likely to be stakeholders in a program - participants, other researchers, program staff, other community members, and so on.
Then we put all data in single framework & apply various statistical tools to find out the dynamic on the market.
During the analysis stage, feedback from the stakeholder groups would be compared to determine areas of agreement as well as areas of divergence
