

Key Insights
The global gems industry is poised for significant expansion, projected to reach $12.7 billion by 2033, driven by a compound annual growth rate (CAGR) of 6.3% from the base year of 2025. Key growth catalysts include rising disposable incomes in emerging economies, particularly in Asia-Pacific, which are fueling demand for luxury goods and fine jewelry. Evolving consumer preferences, emphasizing personalized and ethically sourced products, are also shaping market dynamics. The increasing adoption of online retail channels enhances accessibility and convenience, further accelerating market growth. Industry restraints include potential economic downturns impacting discretionary spending and fluctuations in raw material prices. Market segmentation indicates sustained demand for rings, necklaces, and earrings, with online retail channels emerging as a significant growth area challenging traditional brick-and-mortar stores. Leading companies like The Swatch Group AG, Pandora, and LVMH Group are capitalizing on brand recognition and extensive distribution networks to maintain leadership. North America and Asia-Pacific are expected to remain dominant markets due to robust consumer demand and established retail infrastructure. The forecast period (2025-2033) anticipates continued positive growth, albeit with potential uncertainties stemming from economic volatility. Strategic initiatives such as acquisitions, brand extensions, and innovative product design will be crucial for maintaining competitive advantage.
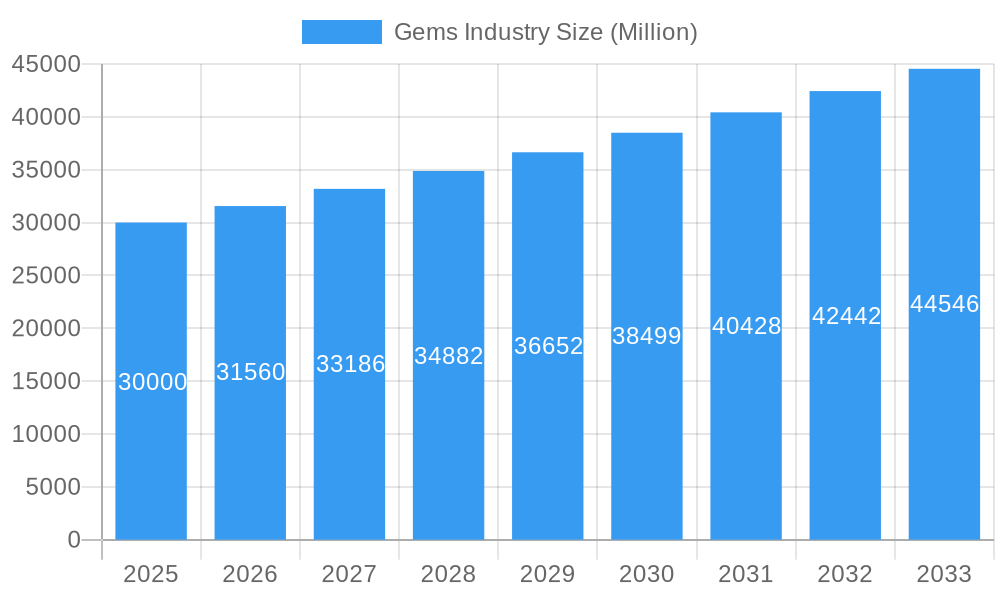
Gems Industry Market Size (In Billion)
The trajectory of the gems industry is intrinsically linked to global economic health and consumer confidence. While an upward trend is anticipated, economic slowdowns or geopolitical instability could impact demand. Long-term industry success hinges on key players' ability to adapt to changing consumer expectations, embrace sustainable sourcing, and leverage technology to enhance customer experiences. The expanding role of e-commerce will be pivotal in shaping the industry's future landscape. Therefore, effective supply chain management and a commitment to ethical sourcing practices are paramount for mitigating risks and ensuring sustained growth in this dynamic market.
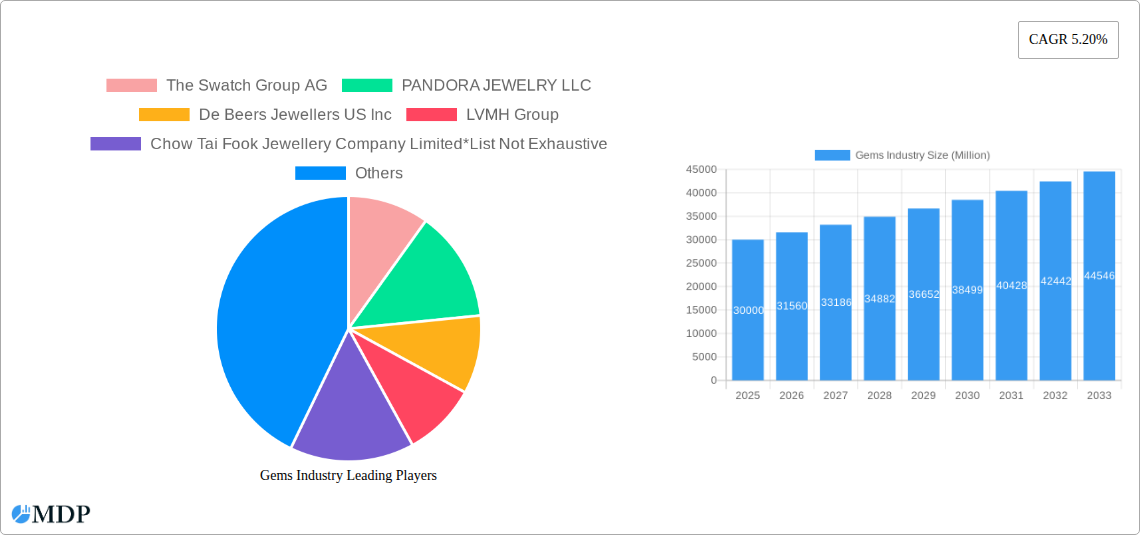
Gems Industry Company Market Share
Gems Industry Market Analysis: 2025-2033
This comprehensive market report offers deep insights into the global gems industry, forecasting a market value exceeding $12.7 billion by 2033. Our analysis covers the base year (2025) and the forecast period (2025-2033), providing actionable intelligence for all industry participants involved in the production, distribution, and retail of gems and jewelry.
Gems Industry Market Dynamics & Concentration
The global gems industry, valued at $XX Million in 2024, is experiencing significant shifts driven by evolving consumer preferences, technological advancements, and regulatory changes. Market concentration is moderate, with several key players holding substantial shares. The Swatch Group AG, PANDORA JEWELRY LLC, De Beers Jewellers US Inc, LVMH Group, and Richemont SA are among the leading companies, although the market features numerous smaller players and independent jewelers. The industry is characterized by a complex supply chain, from mining and processing raw materials to designing, manufacturing, and retailing finished jewelry.
- Market Share: The top 5 players collectively hold an estimated xx% of the global market share in 2024.
- M&A Activity: The past five years have witnessed xx M&A deals, primarily focused on expanding distribution networks and acquiring specialized skills.
- Innovation Drivers: Technological advancements in gemstone creation, 3D printing for jewelry design, and personalized jewelry experiences are driving innovation.
- Regulatory Frameworks: Regulations concerning ethical sourcing, conflict-free diamonds, and environmental impact are shaping industry practices.
- Product Substitutes: The emergence of lab-grown diamonds and other synthetic gemstones presents a significant competitive challenge, impacting pricing and demand for natural gems.
- End-User Trends: Millennials and Gen Z are driving demand for sustainable, ethically sourced, and personalized jewelry, impacting the industry’s focus on sustainability and traceability.
Gems Industry Industry Trends & Analysis
The gems industry is projected to exhibit a CAGR of xx% during the forecast period (2025-2033), driven by increasing disposable incomes in emerging markets, changing consumer preferences towards luxury goods, and the rise of e-commerce. Market penetration of online retail channels is steadily increasing, while traditional offline stores remain crucial. Technological advancements such as 3D printing and advanced materials are transforming the manufacturing process, leading to increased efficiency and customization options. Consumer preferences are shifting towards unique designs, personalized experiences, and ethically sourced products. Intense competition amongst established players and the emergence of new entrants is shaping market dynamics.
Leading Markets & Segments in Gems Industry
The Asia-Pacific region currently dominates the gems industry, fueled by strong economic growth in countries like China and India. Within product types, rings and necklaces hold the largest market share, followed by earrings and bracelets. Offline retail stores continue to be the dominant distribution channel, although online sales are witnessing significant growth.
- Key Drivers for Asia-Pacific Dominance:
- Robust economic growth and rising disposable incomes.
- Strong cultural affinity for jewelry and gemstones.
- Well-established jewelry manufacturing and retail infrastructure.
- Dominant Product Types: Rings and necklaces hold the largest market share due to their versatile nature and cultural significance.
- Distribution Channel Analysis: While offline retail stores still dominate, the online channel's growth is reshaping the industry landscape.
Gems Industry Product Developments
Recent product innovations focus on sustainability, ethical sourcing, and personalization. Lab-grown diamonds are gaining traction, offering a more affordable and environmentally friendly alternative to mined diamonds. Technological advancements in 3D printing are enabling customized jewelry designs and intricate detailing, catering to the growing demand for personalized products. The industry is also emphasizing the use of recycled metals and sustainable packaging.
Key Drivers of Gems Industry Growth
Several factors fuel the gems industry's growth trajectory. Rising disposable incomes in emerging economies, particularly in Asia, stimulate demand for luxury goods like jewelry. The increasing popularity of personalized and customized jewelry, alongside the adoption of e-commerce platforms, expands market reach. Technological advancements, such as 3D printing and lab-grown gems, provide new opportunities for innovation and efficiency.
Challenges in the Gems Industry Market
The gems industry faces several challenges. Fluctuations in raw material prices, particularly for precious metals and gemstones, impact profitability. Supply chain disruptions and ethical sourcing concerns require continuous monitoring. The emergence of lab-grown gemstones creates price competition and necessitates innovation in natural gem differentiation. Stricter environmental regulations and counterfeiting issues add further complexity.
Emerging Opportunities in Gems Industry
The industry presents significant opportunities for growth. Expanding into emerging markets with high growth potential remains a key strategy. Technological advancements, such as blockchain technology for enhancing traceability and transparency, offer solutions to ethical sourcing challenges. Strategic partnerships and collaborations among industry players, including miners, manufacturers, and retailers, enhance the supply chain efficiency and strengthen ethical practices. The increased focus on sustainable and ethically sourced products is creating new market opportunities.
Leading Players in the Gems Industry Sector
- The Swatch Group AG
- PANDORA JEWELRY LLC
- De Beers Jewellers US Inc
- LVMH Group
- Chow Tai Fook Jewellery Company Limited
- Richemont SA
- Swarovski Crystal Online AG
- Chow Tai Fook Jewelry Company Limited
- Tata Sons Private Ltd
- Signet Jewelers
Key Milestones in Gems Industry Industry
- August 2022: Pandora launched 'Pandora Brilliance,' featuring lab-grown diamonds from 100% renewable energy. This highlights the growing market for sustainable alternatives.
- August 2022: Louis Vuitton launched its Empreinte Fine Jewelry collection, showcasing the brand's design heritage and high-end market focus.
- September 2022: Tanishq launched 'The Chola' collection, capitalizing on cultural heritage and historical themes to resonate with a specific consumer base.
Strategic Outlook for Gems Industry Market
The gems industry’s future hinges on adaptability and innovation. Embracing sustainable practices, investing in technological advancements, and focusing on personalized experiences will be crucial. Expanding into new markets and forging strategic partnerships will unlock long-term growth opportunities. The industry's ability to address ethical sourcing concerns and adapt to shifting consumer preferences will determine its long-term success.
Gems Industry Segmentation
-
1. Product Type
- 1.1. Rings
- 1.2. Necklaces
- 1.3. Earrings
- 1.4. Bracelets
- 1.5. Chains and Pendants
- 1.6. Other Product Types
-
2. Distribution Channel
- 2.1. Offline Retail Stores
- 2.2. Online Retail Stores
Gems Industry Segmentation By Geography
-
1. North America
- 1.1. United States
- 1.2. Canada
- 1.3. Mexico
- 1.4. Rest of North America
-
2. Europe
- 2.1. Spain
- 2.2. United Kingdom
- 2.3. France
- 2.4. Germany
- 2.5. Russia
- 2.6. Italy
- 2.7. Rest of Europe
-
3. Asia Pacific
- 3.1. China
- 3.2. Japan
- 3.3. India
- 3.4. Australia
- 3.5. Rest of Asia Pacific
-
4. South America
- 4.1. Brazil
- 4.2. Argentina
- 4.3. Rest of South America
-
5. Middle East and Africa
- 5.1. South Africa
- 5.2. United Arab Emirates
- 5.3. Rest of Middle East and Africa
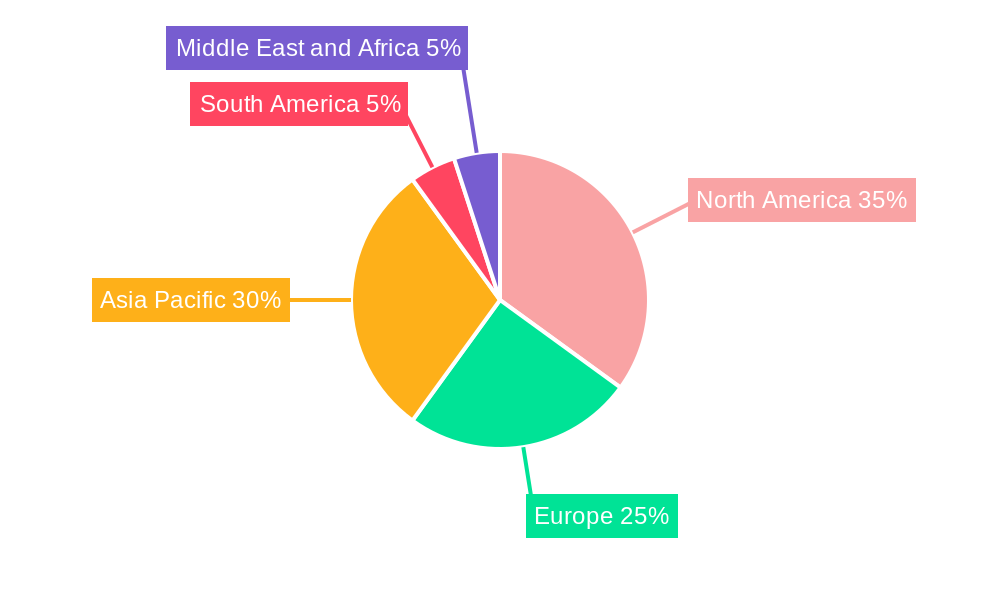
Gems Industry Regional Market Share
Geographic Coverage of Gems Industry
Gems Industry REPORT HIGHLIGHTS
| Aspects | Details |
|---|---|
| Study Period | 2020-2034 |
| Base Year | 2025 |
| Estimated Year | 2026 |
| Forecast Period | 2026-2034 |
| Historical Period | 2020-2025 |
| Growth Rate | CAGR of 6.3% from 2020-2034 |
| Segmentation |
|
Table of Contents
- 1. Introduction
- 1.1. Research Scope
- 1.2. Market Segmentation
- 1.3. Research Objective
- 1.4. Definitions and Assumptions
- 2. Executive Summary
- 2.1. Market Snapshot
- 3. Market Dynamics
- 3.1. Market Drivers
- 3.2. Market Restrains
- 3.3. Market Trends
- 3.4. Market Opportunities
- 4. Market Factor Analysis
- 4.1. Porters Five Forces
- 4.1.1. Bargaining Power of Suppliers
- 4.1.2. Bargaining Power of Buyers
- 4.1.3. Threat of New Entrants
- 4.1.4. Threat of Substitutes
- 4.1.5. Competitive Rivalry
- 4.2. PESTEL analysis
- 4.3. BCG Analysis
- 4.3.1. Stars (High Growth, High Market Share)
- 4.3.2. Cash Cows (Low Growth, High Market Share)
- 4.3.3. Question Mark (High Growth, Low Market Share)
- 4.3.4. Dogs (Low Growth, Low Market Share)
- 4.4. Ansoff Matrix Analysis
- 4.5. Supply Chain Analysis
- 4.6. Regulatory Landscape
- 4.7. Current Market Potential and Opportunity Assessment (TAM–SAM–SOM Framework)
- 4.8. MDP Analyst Note
- 4.1. Porters Five Forces
- 5. Market Analysis, Insights and Forecast 2021-2033
- 5.1. Market Analysis, Insights and Forecast - by Product Type
- 5.1.1. Rings
- 5.1.2. Necklaces
- 5.1.3. Earrings
- 5.1.4. Bracelets
- 5.1.5. Chains and Pendants
- 5.1.6. Other Product Types
- 5.2. Market Analysis, Insights and Forecast - by Distribution Channel
- 5.2.1. Offline Retail Stores
- 5.2.2. Online Retail Stores
- 5.3. Market Analysis, Insights and Forecast - by Region
- 5.3.1. North America
- 5.3.2. Europe
- 5.3.3. Asia Pacific
- 5.3.4. South America
- 5.3.5. Middle East and Africa
- 5.1. Market Analysis, Insights and Forecast - by Product Type
- 6. Global Gems Industry Analysis, Insights and Forecast, 2021-2033
- 6.1. Market Analysis, Insights and Forecast - by Product Type
- 6.1.1. Rings
- 6.1.2. Necklaces
- 6.1.3. Earrings
- 6.1.4. Bracelets
- 6.1.5. Chains and Pendants
- 6.1.6. Other Product Types
- 6.2. Market Analysis, Insights and Forecast - by Distribution Channel
- 6.2.1. Offline Retail Stores
- 6.2.2. Online Retail Stores
- 6.1. Market Analysis, Insights and Forecast - by Product Type
- 7. North America Gems Industry Analysis, Insights and Forecast, 2020-2032
- 7.1. Market Analysis, Insights and Forecast - by Product Type
- 7.1.1. Rings
- 7.1.2. Necklaces
- 7.1.3. Earrings
- 7.1.4. Bracelets
- 7.1.5. Chains and Pendants
- 7.1.6. Other Product Types
- 7.2. Market Analysis, Insights and Forecast - by Distribution Channel
- 7.2.1. Offline Retail Stores
- 7.2.2. Online Retail Stores
- 7.1. Market Analysis, Insights and Forecast - by Product Type
- 8. Europe Gems Industry Analysis, Insights and Forecast, 2020-2032
- 8.1. Market Analysis, Insights and Forecast - by Product Type
- 8.1.1. Rings
- 8.1.2. Necklaces
- 8.1.3. Earrings
- 8.1.4. Bracelets
- 8.1.5. Chains and Pendants
- 8.1.6. Other Product Types
- 8.2. Market Analysis, Insights and Forecast - by Distribution Channel
- 8.2.1. Offline Retail Stores
- 8.2.2. Online Retail Stores
- 8.1. Market Analysis, Insights and Forecast - by Product Type
- 9. Asia Pacific Gems Industry Analysis, Insights and Forecast, 2020-2032
- 9.1. Market Analysis, Insights and Forecast - by Product Type
- 9.1.1. Rings
- 9.1.2. Necklaces
- 9.1.3. Earrings
- 9.1.4. Bracelets
- 9.1.5. Chains and Pendants
- 9.1.6. Other Product Types
- 9.2. Market Analysis, Insights and Forecast - by Distribution Channel
- 9.2.1. Offline Retail Stores
- 9.2.2. Online Retail Stores
- 9.1. Market Analysis, Insights and Forecast - by Product Type
- 10. South America Gems Industry Analysis, Insights and Forecast, 2020-2032
- 10.1. Market Analysis, Insights and Forecast - by Product Type
- 10.1.1. Rings
- 10.1.2. Necklaces
- 10.1.3. Earrings
- 10.1.4. Bracelets
- 10.1.5. Chains and Pendants
- 10.1.6. Other Product Types
- 10.2. Market Analysis, Insights and Forecast - by Distribution Channel
- 10.2.1. Offline Retail Stores
- 10.2.2. Online Retail Stores
- 10.1. Market Analysis, Insights and Forecast - by Product Type
- 11. Middle East and Africa Gems Industry Analysis, Insights and Forecast, 2020-2032
- 11.1. Market Analysis, Insights and Forecast - by Product Type
- 11.1.1. Rings
- 11.1.2. Necklaces
- 11.1.3. Earrings
- 11.1.4. Bracelets
- 11.1.5. Chains and Pendants
- 11.1.6. Other Product Types
- 11.2. Market Analysis, Insights and Forecast - by Distribution Channel
- 11.2.1. Offline Retail Stores
- 11.2.2. Online Retail Stores
- 11.1. Market Analysis, Insights and Forecast - by Product Type
- 12. Competitive Analysis
- 12.1. Company Profiles
- 12.1.1 The Swatch Group AG
- 12.1.1.1. Company Overview
- 12.1.1.2. Products
- 12.1.1.3. Company Financials
- 12.1.1.4. SWOT Analysis
- 12.1.2 PANDORA JEWELRY LLC
- 12.1.2.1. Company Overview
- 12.1.2.2. Products
- 12.1.2.3. Company Financials
- 12.1.2.4. SWOT Analysis
- 12.1.3 De Beers Jewellers US Inc
- 12.1.3.1. Company Overview
- 12.1.3.2. Products
- 12.1.3.3. Company Financials
- 12.1.3.4. SWOT Analysis
- 12.1.4 LVMH Group
- 12.1.4.1. Company Overview
- 12.1.4.2. Products
- 12.1.4.3. Company Financials
- 12.1.4.4. SWOT Analysis
- 12.1.5 Chow Tai Fook Jewellery Company Limited*List Not Exhaustive
- 12.1.5.1. Company Overview
- 12.1.5.2. Products
- 12.1.5.3. Company Financials
- 12.1.5.4. SWOT Analysis
- 12.1.6 Richemont SA
- 12.1.6.1. Company Overview
- 12.1.6.2. Products
- 12.1.6.3. Company Financials
- 12.1.6.4. SWOT Analysis
- 12.1.7 Swarovski Crystal Online AG
- 12.1.7.1. Company Overview
- 12.1.7.2. Products
- 12.1.7.3. Company Financials
- 12.1.7.4. SWOT Analysis
- 12.1.8 Chow Tai Fook Jewelry Company Limited
- 12.1.8.1. Company Overview
- 12.1.8.2. Products
- 12.1.8.3. Company Financials
- 12.1.8.4. SWOT Analysis
- 12.1.9 Tata Sons Private Ltd
- 12.1.9.1. Company Overview
- 12.1.9.2. Products
- 12.1.9.3. Company Financials
- 12.1.9.4. SWOT Analysis
- 12.1.10 Signet Jewelers
- 12.1.10.1. Company Overview
- 12.1.10.2. Products
- 12.1.10.3. Company Financials
- 12.1.10.4. SWOT Analysis
- 12.1.1 The Swatch Group AG
- 12.2. Market Entropy
- 12.2.1 Company's Key Areas Served
- 12.2.2 Recent Developments
- 12.3. Company Market Share Analysis 2025
- 12.3.1 Top 5 Companies Market Share Analysis
- 12.3.2 Top 3 Companies Market Share Analysis
- 12.4. List of Potential Customers
- 13. Research Methodology
List of Figures
- Figure 1: Global Gems Industry Revenue Breakdown (billion, %) by Region 2025 & 2033
- Figure 2: North America Gems Industry Revenue (billion), by Product Type 2025 & 2033
- Figure 3: North America Gems Industry Revenue Share (%), by Product Type 2025 & 2033
- Figure 4: North America Gems Industry Revenue (billion), by Distribution Channel 2025 & 2033
- Figure 5: North America Gems Industry Revenue Share (%), by Distribution Channel 2025 & 2033
- Figure 6: North America Gems Industry Revenue (billion), by Country 2025 & 2033
- Figure 7: North America Gems Industry Revenue Share (%), by Country 2025 & 2033
- Figure 8: Europe Gems Industry Revenue (billion), by Product Type 2025 & 2033
- Figure 9: Europe Gems Industry Revenue Share (%), by Product Type 2025 & 2033
- Figure 10: Europe Gems Industry Revenue (billion), by Distribution Channel 2025 & 2033
- Figure 11: Europe Gems Industry Revenue Share (%), by Distribution Channel 2025 & 2033
- Figure 12: Europe Gems Industry Revenue (billion), by Country 2025 & 2033
- Figure 13: Europe Gems Industry Revenue Share (%), by Country 2025 & 2033
- Figure 14: Asia Pacific Gems Industry Revenue (billion), by Product Type 2025 & 2033
- Figure 15: Asia Pacific Gems Industry Revenue Share (%), by Product Type 2025 & 2033
- Figure 16: Asia Pacific Gems Industry Revenue (billion), by Distribution Channel 2025 & 2033
- Figure 17: Asia Pacific Gems Industry Revenue Share (%), by Distribution Channel 2025 & 2033
- Figure 18: Asia Pacific Gems Industry Revenue (billion), by Country 2025 & 2033
- Figure 19: Asia Pacific Gems Industry Revenue Share (%), by Country 2025 & 2033
- Figure 20: South America Gems Industry Revenue (billion), by Product Type 2025 & 2033
- Figure 21: South America Gems Industry Revenue Share (%), by Product Type 2025 & 2033
- Figure 22: South America Gems Industry Revenue (billion), by Distribution Channel 2025 & 2033
- Figure 23: South America Gems Industry Revenue Share (%), by Distribution Channel 2025 & 2033
- Figure 24: South America Gems Industry Revenue (billion), by Country 2025 & 2033
- Figure 25: South America Gems Industry Revenue Share (%), by Country 2025 & 2033
- Figure 26: Middle East and Africa Gems Industry Revenue (billion), by Product Type 2025 & 2033
- Figure 27: Middle East and Africa Gems Industry Revenue Share (%), by Product Type 2025 & 2033
- Figure 28: Middle East and Africa Gems Industry Revenue (billion), by Distribution Channel 2025 & 2033
- Figure 29: Middle East and Africa Gems Industry Revenue Share (%), by Distribution Channel 2025 & 2033
- Figure 30: Middle East and Africa Gems Industry Revenue (billion), by Country 2025 & 2033
- Figure 31: Middle East and Africa Gems Industry Revenue Share (%), by Country 2025 & 2033
List of Tables
- Table 1: Global Gems Industry Revenue billion Forecast, by Product Type 2020 & 2033
- Table 2: Global Gems Industry Revenue billion Forecast, by Distribution Channel 2020 & 2033
- Table 3: Global Gems Industry Revenue billion Forecast, by Region 2020 & 2033
- Table 4: Global Gems Industry Revenue billion Forecast, by Product Type 2020 & 2033
- Table 5: Global Gems Industry Revenue billion Forecast, by Distribution Channel 2020 & 2033
- Table 6: Global Gems Industry Revenue billion Forecast, by Country 2020 & 2033
- Table 7: United States Gems Industry Revenue (billion) Forecast, by Application 2020 & 2033
- Table 8: Canada Gems Industry Revenue (billion) Forecast, by Application 2020 & 2033
- Table 9: Mexico Gems Industry Revenue (billion) Forecast, by Application 2020 & 2033
- Table 10: Rest of North America Gems Industry Revenue (billion) Forecast, by Application 2020 & 2033
- Table 11: Global Gems Industry Revenue billion Forecast, by Product Type 2020 & 2033
- Table 12: Global Gems Industry Revenue billion Forecast, by Distribution Channel 2020 & 2033
- Table 13: Global Gems Industry Revenue billion Forecast, by Country 2020 & 2033
- Table 14: Spain Gems Industry Revenue (billion) Forecast, by Application 2020 & 2033
- Table 15: United Kingdom Gems Industry Revenue (billion) Forecast, by Application 2020 & 2033
- Table 16: France Gems Industry Revenue (billion) Forecast, by Application 2020 & 2033
- Table 17: Germany Gems Industry Revenue (billion) Forecast, by Application 2020 & 2033
- Table 18: Russia Gems Industry Revenue (billion) Forecast, by Application 2020 & 2033
- Table 19: Italy Gems Industry Revenue (billion) Forecast, by Application 2020 & 2033
- Table 20: Rest of Europe Gems Industry Revenue (billion) Forecast, by Application 2020 & 2033
- Table 21: Global Gems Industry Revenue billion Forecast, by Product Type 2020 & 2033
- Table 22: Global Gems Industry Revenue billion Forecast, by Distribution Channel 2020 & 2033
- Table 23: Global Gems Industry Revenue billion Forecast, by Country 2020 & 2033
- Table 24: China Gems Industry Revenue (billion) Forecast, by Application 2020 & 2033
- Table 25: Japan Gems Industry Revenue (billion) Forecast, by Application 2020 & 2033
- Table 26: India Gems Industry Revenue (billion) Forecast, by Application 2020 & 2033
- Table 27: Australia Gems Industry Revenue (billion) Forecast, by Application 2020 & 2033
- Table 28: Rest of Asia Pacific Gems Industry Revenue (billion) Forecast, by Application 2020 & 2033
- Table 29: Global Gems Industry Revenue billion Forecast, by Product Type 2020 & 2033
- Table 30: Global Gems Industry Revenue billion Forecast, by Distribution Channel 2020 & 2033
- Table 31: Global Gems Industry Revenue billion Forecast, by Country 2020 & 2033
- Table 32: Brazil Gems Industry Revenue (billion) Forecast, by Application 2020 & 2033
- Table 33: Argentina Gems Industry Revenue (billion) Forecast, by Application 2020 & 2033
- Table 34: Rest of South America Gems Industry Revenue (billion) Forecast, by Application 2020 & 2033
- Table 35: Global Gems Industry Revenue billion Forecast, by Product Type 2020 & 2033
- Table 36: Global Gems Industry Revenue billion Forecast, by Distribution Channel 2020 & 2033
- Table 37: Global Gems Industry Revenue billion Forecast, by Country 2020 & 2033
- Table 38: South Africa Gems Industry Revenue (billion) Forecast, by Application 2020 & 2033
- Table 39: United Arab Emirates Gems Industry Revenue (billion) Forecast, by Application 2020 & 2033
- Table 40: Rest of Middle East and Africa Gems Industry Revenue (billion) Forecast, by Application 2020 & 2033
Frequently Asked Questions
1. What is the projected Compound Annual Growth Rate (CAGR) of the Gems Industry?
The projected CAGR is approximately 6.3%.
2. Which companies are prominent players in the Gems Industry?
Key companies in the market include The Swatch Group AG, PANDORA JEWELRY LLC, De Beers Jewellers US Inc, LVMH Group, Chow Tai Fook Jewellery Company Limited*List Not Exhaustive, Richemont SA, Swarovski Crystal Online AG, Chow Tai Fook Jewelry Company Limited, Tata Sons Private Ltd, Signet Jewelers.
3. What are the main segments of the Gems Industry?
The market segments include Product Type, Distribution Channel.
4. Can you provide details about the market size?
The market size is estimated to be USD 12.7 billion as of 2022.
5. What are some drivers contributing to market growth?
Product Innovations to Drive Demand for Watches; Rising Demand for Premium Fashion Items.
6. What are the notable trends driving market growth?
Rising Demand for Gems & Jewellery Owing to the Emerging Middle Class.
7. Are there any restraints impacting market growth?
Presence of Counterfeit Products.
8. Can you provide examples of recent developments in the market?
September 2022: As an ode to the Chola Dynasty, which is considered a golden age of Indian history, Tanishq launched its new exclusive collection The Chola, which is an ode to the dynasty.
9. What pricing options are available for accessing the report?
Pricing options include single-user, multi-user, and enterprise licenses priced at USD 4750, USD 5250, and USD 8750 respectively.
10. Is the market size provided in terms of value or volume?
The market size is provided in terms of value, measured in billion.
11. Are there any specific market keywords associated with the report?
Yes, the market keyword associated with the report is "Gems Industry," which aids in identifying and referencing the specific market segment covered.
12. How do I determine which pricing option suits my needs best?
The pricing options vary based on user requirements and access needs. Individual users may opt for single-user licenses, while businesses requiring broader access may choose multi-user or enterprise licenses for cost-effective access to the report.
13. Are there any additional resources or data provided in the Gems Industry report?
While the report offers comprehensive insights, it's advisable to review the specific contents or supplementary materials provided to ascertain if additional resources or data are available.
14. How can I stay updated on further developments or reports in the Gems Industry?
To stay informed about further developments, trends, and reports in the Gems Industry, consider subscribing to industry newsletters, following relevant companies and organizations, or regularly checking reputable industry news sources and publications.
Methodology
Step 1 - Identification of Relevant Samples Size from Population Database


Step 2 - Approaches for Defining Global Market Size (Value, Volume* & Price*)

Note*: In applicable scenarios
Step 3 - Data Sources
Primary Research
- Web Analytics
- Survey Reports
- Research Institute
- Latest Research Reports
- Opinion Leaders
Secondary Research
- Annual Reports
- White Paper
- Latest Press Release
- Industry Association
- Paid Database
- Investor Presentations

Step 4 - Data Triangulation
Involves using different sources of information in order to increase the validity of a study
These sources are likely to be stakeholders in a program - participants, other researchers, program staff, other community members, and so on.
Then we put all data in single framework & apply various statistical tools to find out the dynamic on the market.
During the analysis stage, feedback from the stakeholder groups would be compared to determine areas of agreement as well as areas of divergence