

Key Insights
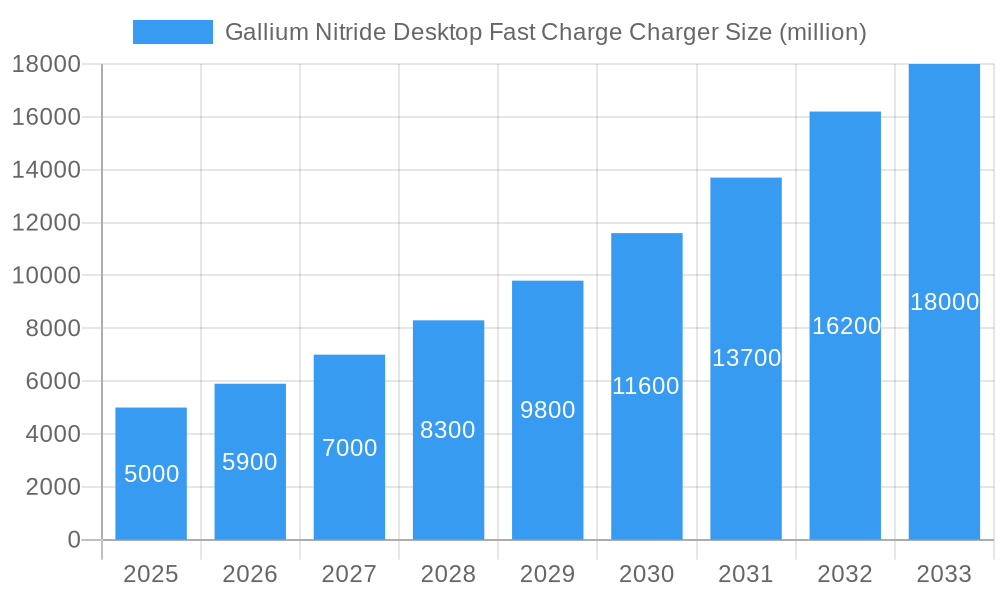
The Gallium Nitride (GaN) desktop fast charge charger market is experiencing robust growth, driven by increasing demand for faster charging speeds and smaller, more efficient power adapters. The market, estimated at $5 billion in 2025, is projected to exhibit a Compound Annual Growth Rate (CAGR) of 18% from 2025 to 2033, reaching approximately $18 billion by 2033. This significant expansion is fueled by several key factors. Firstly, the inherent advantages of GaN technology, such as higher power density and efficiency compared to traditional silicon-based chargers, are attracting both consumers and manufacturers. Secondly, the rising adoption of high-power devices like laptops and tablets necessitates faster charging capabilities, further boosting GaN charger demand. The market segmentation reveals a strong preference for higher wattage chargers (65W, 100W, and 240W) within both household and commercial applications, indicating a shift towards devices needing rapid charging solutions. Leading brands like Dell, Lenovo, Samsung, and Anker are actively investing in GaN charger technology, driving innovation and market competition. Geographic distribution shows North America and Asia Pacific as dominant regions, reflecting high consumer electronics adoption rates and strong manufacturing bases. However, restraints like higher initial manufacturing costs compared to silicon-based chargers and potential supply chain challenges remain. Nevertheless, ongoing technological advancements and decreasing production costs are expected to mitigate these challenges, sustaining the market's impressive growth trajectory.
Gallium Nitride Desktop Fast Charge Charger Market Size (In Billion)
The competitive landscape is marked by a mix of established electronics giants and specialized charger manufacturers. While major brands leverage their existing distribution networks to reach wider audiences, smaller specialized companies are focusing on innovation and niche market segments, offering diverse product ranges and price points. The market's future growth hinges on the continuous improvement of GaN technology, leading to even faster charging speeds, smaller form factors, and enhanced power efficiency. Furthermore, strategic partnerships between charger manufacturers and device manufacturers are vital to ensuring seamless integration and promoting GaN adoption. Expansion into emerging markets and increasing awareness about the benefits of GaN chargers among consumers are also key factors that will propel market growth in the coming years.
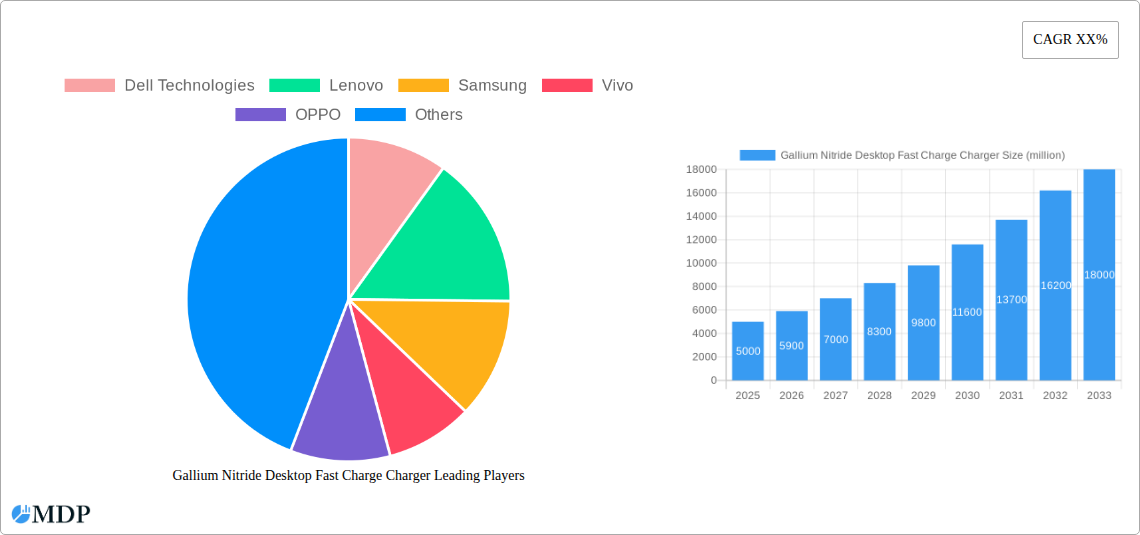
Gallium Nitride Desktop Fast Charge Charger Company Market Share
Gallium Nitride Desktop Fast Charge Charger Market Report: 2019-2033
Uncover the explosive growth potential of the Gallium Nitride (GaN) Desktop Fast Charge Charger market with this comprehensive report. This in-depth analysis provides a detailed overview of the market dynamics, industry trends, leading players (including Dell Technologies, Lenovo, Samsung, Vivo, OPPO, Anker, Belkin, Baseus, Ugreen, Spigen, Motorola, Xiaomi, Shenzhen Blue Times Technology, and TEKA Technology), and future growth opportunities from 2019 to 2033. With a focus on key segments (30W, 65W, 100W, 240W chargers) and applications (Household and Commercial), this report is an essential resource for industry stakeholders, investors, and anyone seeking to understand this rapidly evolving market. The report utilizes data from 2019-2024 (Historical Period), with a base year of 2025 and forecasts extending to 2033 (Forecast Period).
Gallium Nitride Desktop Fast Charge Charger Market Dynamics & Concentration
The Gallium Nitride Desktop Fast Charge Charger market is experiencing rapid expansion, driven by increasing demand for faster charging solutions and the inherent advantages of GaN technology. Market concentration is currently moderate, with several key players holding significant shares, but the landscape is dynamic with ongoing mergers and acquisitions (M&A) activities. The estimated market value in 2025 is $xx million.
- Market Concentration: The top 5 players are estimated to hold approximately 45% of the market share in 2025. This is projected to slightly decrease to 40% by 2033 due to increased competition from emerging players.
- Innovation Drivers: Continuous advancements in GaN technology, leading to higher power density, efficiency, and smaller charger sizes, are major drivers.
- Regulatory Frameworks: Government regulations promoting energy efficiency and reduced carbon footprints are indirectly boosting GaN charger adoption.
- Product Substitutes: Traditional silicon-based chargers remain a substitute, but their inferior performance and larger size limit their market share.
- End-User Trends: The increasing preference for portable devices and fast-charging capabilities among consumers is a key driving force.
- M&A Activities: The estimated number of M&A deals in the GaN charger sector between 2019 and 2024 was 20, with an expected increase to 30 deals by 2033.
Gallium Nitride Desktop Fast Charge Charger Industry Trends & Analysis
The GaN desktop fast charge charger market is witnessing robust growth, with a projected Compound Annual Growth Rate (CAGR) of xx% from 2025 to 2033. This growth is fueled by several factors:
- The rising adoption of smartphones and other portable electronic devices which has increased consumer demand for faster charging. Market penetration of GaN chargers is steadily increasing, with an estimated xx% penetration in 2025, expected to reach xx% by 2033.
- Technological advancements are resulting in higher power densities, improved efficiency, and smaller form factors for GaN chargers, making them increasingly attractive to consumers and manufacturers.
- Consumer preference for smaller, more efficient, and faster-charging options are driving the market shift toward GaN technology.
- Intense competition among key players is leading to innovations in product design, features, and pricing strategies, further stimulating market expansion.
Leading Markets & Segments in Gallium Nitride Desktop Fast Charge Charger
The North American market currently holds a dominant position, largely due to high consumer spending on electronic devices and a strong emphasis on technological advancements. However, the Asia-Pacific region is projected to witness the fastest growth, particularly in countries like China and India, fueled by rising smartphone adoption and increasing disposable income.
- Dominant Region: North America
- Key Drivers in North America: High consumer spending power, early adoption of new technologies.
- Key Drivers in Asia-Pacific: Rapid growth in smartphone sales, expanding middle class, government initiatives promoting technological advancements.
- Dominant Segment (Application): Household (due to the widespread use of smartphones and tablets)
- Dominant Segment (Type): 65W chargers are presently the most popular due to their balance between charging speed and compatibility. However, 100W and 240W segments are predicted to experience significant growth.
Gallium Nitride Desktop Fast Charge Charger Product Developments
Recent product innovations focus on increasing power output, improving charging efficiency, and integrating advanced features like multiple port charging and smart power management. The introduction of smaller and more aesthetically pleasing designs is enhancing market appeal. Competitive advantages are centered around charging speed, efficiency, and the incorporation of smart features. The trend is towards higher wattage options for faster charging of laptops and other power-hungry devices.
Key Drivers of Gallium Nitride Desktop Fast Charge Charger Growth
The market's growth is fueled by technological advancements in GaN technology, resulting in smaller, more efficient chargers. Economic factors like rising disposable incomes and increased consumer spending on electronics are also significant contributors. Government regulations encouraging energy efficiency play a supporting role.
Challenges in the Gallium Nitride Desktop Fast Charge Charger Market
Challenges include maintaining a stable supply chain for GaN components, which may experience fluctuating prices. Competitive pressures from established and emerging players pose an ongoing challenge. The high initial cost of GaN chargers compared to silicon-based alternatives can also limit adoption.
Emerging Opportunities in Gallium Nitride Desktop Fast Charge Charger
Significant opportunities exist in expanding into emerging markets, developing higher-wattage chargers for laptops and other high-power devices, and forging strategic partnerships for wider market penetration and distribution. Technological breakthroughs promise further improvements in charging speed and efficiency.
Key Milestones in Gallium Nitride Desktop Fast Charge Charger Industry
- 2020-Q3: Anker launches its first 100W GaN charger.
- 2021-Q4: Samsung integrates GaN technology into its flagship phone chargers.
- 2022-Q2: A significant M&A deal occurs between two major GaN charger manufacturers. (xx million USD deal).
- 2023-Q1: Several key players release GaN chargers with multiple USB-C ports and advanced power management.
Strategic Outlook for Gallium Nitride Desktop Fast Charge Charger Market
The GaN desktop fast charge charger market exhibits strong potential for continued expansion. Strategic partnerships, continuous technological advancements, and penetration into emerging markets will be key growth accelerators. The focus on higher wattage chargers and improved charging efficiency will shape the future market landscape.
Gallium Nitride Desktop Fast Charge Charger Segmentation
-
1. Application
- 1.1. Household
- 1.2. Commercial
-
2. Types
- 2.1. 30W
- 2.2. 65W
- 2.3. 100W
- 2.4. 240W
Gallium Nitride Desktop Fast Charge Charger Segmentation By Geography
-
1. North America
- 1.1. United States
- 1.2. Canada
- 1.3. Mexico
-
2. South America
- 2.1. Brazil
- 2.2. Argentina
- 2.3. Rest of South America
-
3. Europe
- 3.1. United Kingdom
- 3.2. Germany
- 3.3. France
- 3.4. Italy
- 3.5. Spain
- 3.6. Russia
- 3.7. Benelux
- 3.8. Nordics
- 3.9. Rest of Europe
-
4. Middle East & Africa
- 4.1. Turkey
- 4.2. Israel
- 4.3. GCC
- 4.4. North Africa
- 4.5. South Africa
- 4.6. Rest of Middle East & Africa
-
5. Asia Pacific
- 5.1. China
- 5.2. India
- 5.3. Japan
- 5.4. South Korea
- 5.5. ASEAN
- 5.6. Oceania
- 5.7. Rest of Asia Pacific
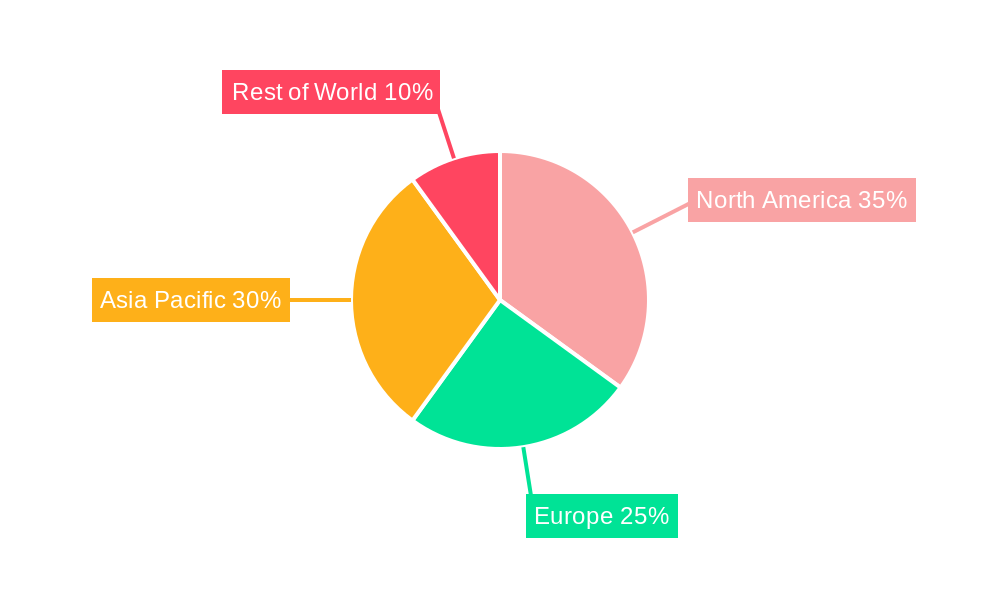
Gallium Nitride Desktop Fast Charge Charger Regional Market Share
Geographic Coverage of Gallium Nitride Desktop Fast Charge Charger
Gallium Nitride Desktop Fast Charge Charger REPORT HIGHLIGHTS
| Aspects | Details |
|---|---|
| Study Period | 2020-2034 |
| Base Year | 2025 |
| Estimated Year | 2026 |
| Forecast Period | 2026-2034 |
| Historical Period | 2020-2025 |
| Growth Rate | CAGR of XX% from 2020-2034 |
| Segmentation |
|
Table of Contents
- 1. Introduction
- 1.1. Research Scope
- 1.2. Market Segmentation
- 1.3. Research Methodology
- 1.4. Definitions and Assumptions
- 2. Executive Summary
- 2.1. Introduction
- 3. Market Dynamics
- 3.1. Introduction
- 3.2. Market Drivers
- 3.3. Market Restrains
- 3.4. Market Trends
- 4. Market Factor Analysis
- 4.1. Porters Five Forces
- 4.2. Supply/Value Chain
- 4.3. PESTEL analysis
- 4.4. Market Entropy
- 4.5. Patent/Trademark Analysis
- 5. Global Gallium Nitride Desktop Fast Charge Charger Analysis, Insights and Forecast, 2020-2032
- 5.1. Market Analysis, Insights and Forecast - by Application
- 5.1.1. Household
- 5.1.2. Commercial
- 5.2. Market Analysis, Insights and Forecast - by Types
- 5.2.1. 30W
- 5.2.2. 65W
- 5.2.3. 100W
- 5.2.4. 240W
- 5.3. Market Analysis, Insights and Forecast - by Region
- 5.3.1. North America
- 5.3.2. South America
- 5.3.3. Europe
- 5.3.4. Middle East & Africa
- 5.3.5. Asia Pacific
- 5.1. Market Analysis, Insights and Forecast - by Application
- 6. North America Gallium Nitride Desktop Fast Charge Charger Analysis, Insights and Forecast, 2020-2032
- 6.1. Market Analysis, Insights and Forecast - by Application
- 6.1.1. Household
- 6.1.2. Commercial
- 6.2. Market Analysis, Insights and Forecast - by Types
- 6.2.1. 30W
- 6.2.2. 65W
- 6.2.3. 100W
- 6.2.4. 240W
- 6.1. Market Analysis, Insights and Forecast - by Application
- 7. South America Gallium Nitride Desktop Fast Charge Charger Analysis, Insights and Forecast, 2020-2032
- 7.1. Market Analysis, Insights and Forecast - by Application
- 7.1.1. Household
- 7.1.2. Commercial
- 7.2. Market Analysis, Insights and Forecast - by Types
- 7.2.1. 30W
- 7.2.2. 65W
- 7.2.3. 100W
- 7.2.4. 240W
- 7.1. Market Analysis, Insights and Forecast - by Application
- 8. Europe Gallium Nitride Desktop Fast Charge Charger Analysis, Insights and Forecast, 2020-2032
- 8.1. Market Analysis, Insights and Forecast - by Application
- 8.1.1. Household
- 8.1.2. Commercial
- 8.2. Market Analysis, Insights and Forecast - by Types
- 8.2.1. 30W
- 8.2.2. 65W
- 8.2.3. 100W
- 8.2.4. 240W
- 8.1. Market Analysis, Insights and Forecast - by Application
- 9. Middle East & Africa Gallium Nitride Desktop Fast Charge Charger Analysis, Insights and Forecast, 2020-2032
- 9.1. Market Analysis, Insights and Forecast - by Application
- 9.1.1. Household
- 9.1.2. Commercial
- 9.2. Market Analysis, Insights and Forecast - by Types
- 9.2.1. 30W
- 9.2.2. 65W
- 9.2.3. 100W
- 9.2.4. 240W
- 9.1. Market Analysis, Insights and Forecast - by Application
- 10. Asia Pacific Gallium Nitride Desktop Fast Charge Charger Analysis, Insights and Forecast, 2020-2032
- 10.1. Market Analysis, Insights and Forecast - by Application
- 10.1.1. Household
- 10.1.2. Commercial
- 10.2. Market Analysis, Insights and Forecast - by Types
- 10.2.1. 30W
- 10.2.2. 65W
- 10.2.3. 100W
- 10.2.4. 240W
- 10.1. Market Analysis, Insights and Forecast - by Application
- 11. Competitive Analysis
- 11.1. Global Market Share Analysis 2025
- 11.2. Company Profiles
- 11.2.1 Dell Technologies
- 11.2.1.1. Overview
- 11.2.1.2. Products
- 11.2.1.3. SWOT Analysis
- 11.2.1.4. Recent Developments
- 11.2.1.5. Financials (Based on Availability)
- 11.2.2 Lenovo
- 11.2.2.1. Overview
- 11.2.2.2. Products
- 11.2.2.3. SWOT Analysis
- 11.2.2.4. Recent Developments
- 11.2.2.5. Financials (Based on Availability)
- 11.2.3 Samsung
- 11.2.3.1. Overview
- 11.2.3.2. Products
- 11.2.3.3. SWOT Analysis
- 11.2.3.4. Recent Developments
- 11.2.3.5. Financials (Based on Availability)
- 11.2.4 Vivo
- 11.2.4.1. Overview
- 11.2.4.2. Products
- 11.2.4.3. SWOT Analysis
- 11.2.4.4. Recent Developments
- 11.2.4.5. Financials (Based on Availability)
- 11.2.5 OPPO
- 11.2.5.1. Overview
- 11.2.5.2. Products
- 11.2.5.3. SWOT Analysis
- 11.2.5.4. Recent Developments
- 11.2.5.5. Financials (Based on Availability)
- 11.2.6 Anker
- 11.2.6.1. Overview
- 11.2.6.2. Products
- 11.2.6.3. SWOT Analysis
- 11.2.6.4. Recent Developments
- 11.2.6.5. Financials (Based on Availability)
- 11.2.7 Belkin
- 11.2.7.1. Overview
- 11.2.7.2. Products
- 11.2.7.3. SWOT Analysis
- 11.2.7.4. Recent Developments
- 11.2.7.5. Financials (Based on Availability)
- 11.2.8 Baseus
- 11.2.8.1. Overview
- 11.2.8.2. Products
- 11.2.8.3. SWOT Analysis
- 11.2.8.4. Recent Developments
- 11.2.8.5. Financials (Based on Availability)
- 11.2.9 Ugreen
- 11.2.9.1. Overview
- 11.2.9.2. Products
- 11.2.9.3. SWOT Analysis
- 11.2.9.4. Recent Developments
- 11.2.9.5. Financials (Based on Availability)
- 11.2.10 Spigen
- 11.2.10.1. Overview
- 11.2.10.2. Products
- 11.2.10.3. SWOT Analysis
- 11.2.10.4. Recent Developments
- 11.2.10.5. Financials (Based on Availability)
- 11.2.11 Motorola
- 11.2.11.1. Overview
- 11.2.11.2. Products
- 11.2.11.3. SWOT Analysis
- 11.2.11.4. Recent Developments
- 11.2.11.5. Financials (Based on Availability)
- 11.2.12 Xiaomi
- 11.2.12.1. Overview
- 11.2.12.2. Products
- 11.2.12.3. SWOT Analysis
- 11.2.12.4. Recent Developments
- 11.2.12.5. Financials (Based on Availability)
- 11.2.13 Shenzhen Blue times Technology
- 11.2.13.1. Overview
- 11.2.13.2. Products
- 11.2.13.3. SWOT Analysis
- 11.2.13.4. Recent Developments
- 11.2.13.5. Financials (Based on Availability)
- 11.2.14 TEKA Technology
- 11.2.14.1. Overview
- 11.2.14.2. Products
- 11.2.14.3. SWOT Analysis
- 11.2.14.4. Recent Developments
- 11.2.14.5. Financials (Based on Availability)
- 11.2.1 Dell Technologies
List of Figures
- Figure 1: Global Gallium Nitride Desktop Fast Charge Charger Revenue Breakdown (million, %) by Region 2025 & 2033
- Figure 2: Global Gallium Nitride Desktop Fast Charge Charger Volume Breakdown (K, %) by Region 2025 & 2033
- Figure 3: North America Gallium Nitride Desktop Fast Charge Charger Revenue (million), by Application 2025 & 2033
- Figure 4: North America Gallium Nitride Desktop Fast Charge Charger Volume (K), by Application 2025 & 2033
- Figure 5: North America Gallium Nitride Desktop Fast Charge Charger Revenue Share (%), by Application 2025 & 2033
- Figure 6: North America Gallium Nitride Desktop Fast Charge Charger Volume Share (%), by Application 2025 & 2033
- Figure 7: North America Gallium Nitride Desktop Fast Charge Charger Revenue (million), by Types 2025 & 2033
- Figure 8: North America Gallium Nitride Desktop Fast Charge Charger Volume (K), by Types 2025 & 2033
- Figure 9: North America Gallium Nitride Desktop Fast Charge Charger Revenue Share (%), by Types 2025 & 2033
- Figure 10: North America Gallium Nitride Desktop Fast Charge Charger Volume Share (%), by Types 2025 & 2033
- Figure 11: North America Gallium Nitride Desktop Fast Charge Charger Revenue (million), by Country 2025 & 2033
- Figure 12: North America Gallium Nitride Desktop Fast Charge Charger Volume (K), by Country 2025 & 2033
- Figure 13: North America Gallium Nitride Desktop Fast Charge Charger Revenue Share (%), by Country 2025 & 2033
- Figure 14: North America Gallium Nitride Desktop Fast Charge Charger Volume Share (%), by Country 2025 & 2033
- Figure 15: South America Gallium Nitride Desktop Fast Charge Charger Revenue (million), by Application 2025 & 2033
- Figure 16: South America Gallium Nitride Desktop Fast Charge Charger Volume (K), by Application 2025 & 2033
- Figure 17: South America Gallium Nitride Desktop Fast Charge Charger Revenue Share (%), by Application 2025 & 2033
- Figure 18: South America Gallium Nitride Desktop Fast Charge Charger Volume Share (%), by Application 2025 & 2033
- Figure 19: South America Gallium Nitride Desktop Fast Charge Charger Revenue (million), by Types 2025 & 2033
- Figure 20: South America Gallium Nitride Desktop Fast Charge Charger Volume (K), by Types 2025 & 2033
- Figure 21: South America Gallium Nitride Desktop Fast Charge Charger Revenue Share (%), by Types 2025 & 2033
- Figure 22: South America Gallium Nitride Desktop Fast Charge Charger Volume Share (%), by Types 2025 & 2033
- Figure 23: South America Gallium Nitride Desktop Fast Charge Charger Revenue (million), by Country 2025 & 2033
- Figure 24: South America Gallium Nitride Desktop Fast Charge Charger Volume (K), by Country 2025 & 2033
- Figure 25: South America Gallium Nitride Desktop Fast Charge Charger Revenue Share (%), by Country 2025 & 2033
- Figure 26: South America Gallium Nitride Desktop Fast Charge Charger Volume Share (%), by Country 2025 & 2033
- Figure 27: Europe Gallium Nitride Desktop Fast Charge Charger Revenue (million), by Application 2025 & 2033
- Figure 28: Europe Gallium Nitride Desktop Fast Charge Charger Volume (K), by Application 2025 & 2033
- Figure 29: Europe Gallium Nitride Desktop Fast Charge Charger Revenue Share (%), by Application 2025 & 2033
- Figure 30: Europe Gallium Nitride Desktop Fast Charge Charger Volume Share (%), by Application 2025 & 2033
- Figure 31: Europe Gallium Nitride Desktop Fast Charge Charger Revenue (million), by Types 2025 & 2033
- Figure 32: Europe Gallium Nitride Desktop Fast Charge Charger Volume (K), by Types 2025 & 2033
- Figure 33: Europe Gallium Nitride Desktop Fast Charge Charger Revenue Share (%), by Types 2025 & 2033
- Figure 34: Europe Gallium Nitride Desktop Fast Charge Charger Volume Share (%), by Types 2025 & 2033
- Figure 35: Europe Gallium Nitride Desktop Fast Charge Charger Revenue (million), by Country 2025 & 2033
- Figure 36: Europe Gallium Nitride Desktop Fast Charge Charger Volume (K), by Country 2025 & 2033
- Figure 37: Europe Gallium Nitride Desktop Fast Charge Charger Revenue Share (%), by Country 2025 & 2033
- Figure 38: Europe Gallium Nitride Desktop Fast Charge Charger Volume Share (%), by Country 2025 & 2033
- Figure 39: Middle East & Africa Gallium Nitride Desktop Fast Charge Charger Revenue (million), by Application 2025 & 2033
- Figure 40: Middle East & Africa Gallium Nitride Desktop Fast Charge Charger Volume (K), by Application 2025 & 2033
- Figure 41: Middle East & Africa Gallium Nitride Desktop Fast Charge Charger Revenue Share (%), by Application 2025 & 2033
- Figure 42: Middle East & Africa Gallium Nitride Desktop Fast Charge Charger Volume Share (%), by Application 2025 & 2033
- Figure 43: Middle East & Africa Gallium Nitride Desktop Fast Charge Charger Revenue (million), by Types 2025 & 2033
- Figure 44: Middle East & Africa Gallium Nitride Desktop Fast Charge Charger Volume (K), by Types 2025 & 2033
- Figure 45: Middle East & Africa Gallium Nitride Desktop Fast Charge Charger Revenue Share (%), by Types 2025 & 2033
- Figure 46: Middle East & Africa Gallium Nitride Desktop Fast Charge Charger Volume Share (%), by Types 2025 & 2033
- Figure 47: Middle East & Africa Gallium Nitride Desktop Fast Charge Charger Revenue (million), by Country 2025 & 2033
- Figure 48: Middle East & Africa Gallium Nitride Desktop Fast Charge Charger Volume (K), by Country 2025 & 2033
- Figure 49: Middle East & Africa Gallium Nitride Desktop Fast Charge Charger Revenue Share (%), by Country 2025 & 2033
- Figure 50: Middle East & Africa Gallium Nitride Desktop Fast Charge Charger Volume Share (%), by Country 2025 & 2033
- Figure 51: Asia Pacific Gallium Nitride Desktop Fast Charge Charger Revenue (million), by Application 2025 & 2033
- Figure 52: Asia Pacific Gallium Nitride Desktop Fast Charge Charger Volume (K), by Application 2025 & 2033
- Figure 53: Asia Pacific Gallium Nitride Desktop Fast Charge Charger Revenue Share (%), by Application 2025 & 2033
- Figure 54: Asia Pacific Gallium Nitride Desktop Fast Charge Charger Volume Share (%), by Application 2025 & 2033
- Figure 55: Asia Pacific Gallium Nitride Desktop Fast Charge Charger Revenue (million), by Types 2025 & 2033
- Figure 56: Asia Pacific Gallium Nitride Desktop Fast Charge Charger Volume (K), by Types 2025 & 2033
- Figure 57: Asia Pacific Gallium Nitride Desktop Fast Charge Charger Revenue Share (%), by Types 2025 & 2033
- Figure 58: Asia Pacific Gallium Nitride Desktop Fast Charge Charger Volume Share (%), by Types 2025 & 2033
- Figure 59: Asia Pacific Gallium Nitride Desktop Fast Charge Charger Revenue (million), by Country 2025 & 2033
- Figure 60: Asia Pacific Gallium Nitride Desktop Fast Charge Charger Volume (K), by Country 2025 & 2033
- Figure 61: Asia Pacific Gallium Nitride Desktop Fast Charge Charger Revenue Share (%), by Country 2025 & 2033
- Figure 62: Asia Pacific Gallium Nitride Desktop Fast Charge Charger Volume Share (%), by Country 2025 & 2033
List of Tables
- Table 1: Global Gallium Nitride Desktop Fast Charge Charger Revenue million Forecast, by Application 2020 & 2033
- Table 2: Global Gallium Nitride Desktop Fast Charge Charger Volume K Forecast, by Application 2020 & 2033
- Table 3: Global Gallium Nitride Desktop Fast Charge Charger Revenue million Forecast, by Types 2020 & 2033
- Table 4: Global Gallium Nitride Desktop Fast Charge Charger Volume K Forecast, by Types 2020 & 2033
- Table 5: Global Gallium Nitride Desktop Fast Charge Charger Revenue million Forecast, by Region 2020 & 2033
- Table 6: Global Gallium Nitride Desktop Fast Charge Charger Volume K Forecast, by Region 2020 & 2033
- Table 7: Global Gallium Nitride Desktop Fast Charge Charger Revenue million Forecast, by Application 2020 & 2033
- Table 8: Global Gallium Nitride Desktop Fast Charge Charger Volume K Forecast, by Application 2020 & 2033
- Table 9: Global Gallium Nitride Desktop Fast Charge Charger Revenue million Forecast, by Types 2020 & 2033
- Table 10: Global Gallium Nitride Desktop Fast Charge Charger Volume K Forecast, by Types 2020 & 2033
- Table 11: Global Gallium Nitride Desktop Fast Charge Charger Revenue million Forecast, by Country 2020 & 2033
- Table 12: Global Gallium Nitride Desktop Fast Charge Charger Volume K Forecast, by Country 2020 & 2033
- Table 13: United States Gallium Nitride Desktop Fast Charge Charger Revenue (million) Forecast, by Application 2020 & 2033
- Table 14: United States Gallium Nitride Desktop Fast Charge Charger Volume (K) Forecast, by Application 2020 & 2033
- Table 15: Canada Gallium Nitride Desktop Fast Charge Charger Revenue (million) Forecast, by Application 2020 & 2033
- Table 16: Canada Gallium Nitride Desktop Fast Charge Charger Volume (K) Forecast, by Application 2020 & 2033
- Table 17: Mexico Gallium Nitride Desktop Fast Charge Charger Revenue (million) Forecast, by Application 2020 & 2033
- Table 18: Mexico Gallium Nitride Desktop Fast Charge Charger Volume (K) Forecast, by Application 2020 & 2033
- Table 19: Global Gallium Nitride Desktop Fast Charge Charger Revenue million Forecast, by Application 2020 & 2033
- Table 20: Global Gallium Nitride Desktop Fast Charge Charger Volume K Forecast, by Application 2020 & 2033
- Table 21: Global Gallium Nitride Desktop Fast Charge Charger Revenue million Forecast, by Types 2020 & 2033
- Table 22: Global Gallium Nitride Desktop Fast Charge Charger Volume K Forecast, by Types 2020 & 2033
- Table 23: Global Gallium Nitride Desktop Fast Charge Charger Revenue million Forecast, by Country 2020 & 2033
- Table 24: Global Gallium Nitride Desktop Fast Charge Charger Volume K Forecast, by Country 2020 & 2033
- Table 25: Brazil Gallium Nitride Desktop Fast Charge Charger Revenue (million) Forecast, by Application 2020 & 2033
- Table 26: Brazil Gallium Nitride Desktop Fast Charge Charger Volume (K) Forecast, by Application 2020 & 2033
- Table 27: Argentina Gallium Nitride Desktop Fast Charge Charger Revenue (million) Forecast, by Application 2020 & 2033
- Table 28: Argentina Gallium Nitride Desktop Fast Charge Charger Volume (K) Forecast, by Application 2020 & 2033
- Table 29: Rest of South America Gallium Nitride Desktop Fast Charge Charger Revenue (million) Forecast, by Application 2020 & 2033
- Table 30: Rest of South America Gallium Nitride Desktop Fast Charge Charger Volume (K) Forecast, by Application 2020 & 2033
- Table 31: Global Gallium Nitride Desktop Fast Charge Charger Revenue million Forecast, by Application 2020 & 2033
- Table 32: Global Gallium Nitride Desktop Fast Charge Charger Volume K Forecast, by Application 2020 & 2033
- Table 33: Global Gallium Nitride Desktop Fast Charge Charger Revenue million Forecast, by Types 2020 & 2033
- Table 34: Global Gallium Nitride Desktop Fast Charge Charger Volume K Forecast, by Types 2020 & 2033
- Table 35: Global Gallium Nitride Desktop Fast Charge Charger Revenue million Forecast, by Country 2020 & 2033
- Table 36: Global Gallium Nitride Desktop Fast Charge Charger Volume K Forecast, by Country 2020 & 2033
- Table 37: United Kingdom Gallium Nitride Desktop Fast Charge Charger Revenue (million) Forecast, by Application 2020 & 2033
- Table 38: United Kingdom Gallium Nitride Desktop Fast Charge Charger Volume (K) Forecast, by Application 2020 & 2033
- Table 39: Germany Gallium Nitride Desktop Fast Charge Charger Revenue (million) Forecast, by Application 2020 & 2033
- Table 40: Germany Gallium Nitride Desktop Fast Charge Charger Volume (K) Forecast, by Application 2020 & 2033
- Table 41: France Gallium Nitride Desktop Fast Charge Charger Revenue (million) Forecast, by Application 2020 & 2033
- Table 42: France Gallium Nitride Desktop Fast Charge Charger Volume (K) Forecast, by Application 2020 & 2033
- Table 43: Italy Gallium Nitride Desktop Fast Charge Charger Revenue (million) Forecast, by Application 2020 & 2033
- Table 44: Italy Gallium Nitride Desktop Fast Charge Charger Volume (K) Forecast, by Application 2020 & 2033
- Table 45: Spain Gallium Nitride Desktop Fast Charge Charger Revenue (million) Forecast, by Application 2020 & 2033
- Table 46: Spain Gallium Nitride Desktop Fast Charge Charger Volume (K) Forecast, by Application 2020 & 2033
- Table 47: Russia Gallium Nitride Desktop Fast Charge Charger Revenue (million) Forecast, by Application 2020 & 2033
- Table 48: Russia Gallium Nitride Desktop Fast Charge Charger Volume (K) Forecast, by Application 2020 & 2033
- Table 49: Benelux Gallium Nitride Desktop Fast Charge Charger Revenue (million) Forecast, by Application 2020 & 2033
- Table 50: Benelux Gallium Nitride Desktop Fast Charge Charger Volume (K) Forecast, by Application 2020 & 2033
- Table 51: Nordics Gallium Nitride Desktop Fast Charge Charger Revenue (million) Forecast, by Application 2020 & 2033
- Table 52: Nordics Gallium Nitride Desktop Fast Charge Charger Volume (K) Forecast, by Application 2020 & 2033
- Table 53: Rest of Europe Gallium Nitride Desktop Fast Charge Charger Revenue (million) Forecast, by Application 2020 & 2033
- Table 54: Rest of Europe Gallium Nitride Desktop Fast Charge Charger Volume (K) Forecast, by Application 2020 & 2033
- Table 55: Global Gallium Nitride Desktop Fast Charge Charger Revenue million Forecast, by Application 2020 & 2033
- Table 56: Global Gallium Nitride Desktop Fast Charge Charger Volume K Forecast, by Application 2020 & 2033
- Table 57: Global Gallium Nitride Desktop Fast Charge Charger Revenue million Forecast, by Types 2020 & 2033
- Table 58: Global Gallium Nitride Desktop Fast Charge Charger Volume K Forecast, by Types 2020 & 2033
- Table 59: Global Gallium Nitride Desktop Fast Charge Charger Revenue million Forecast, by Country 2020 & 2033
- Table 60: Global Gallium Nitride Desktop Fast Charge Charger Volume K Forecast, by Country 2020 & 2033
- Table 61: Turkey Gallium Nitride Desktop Fast Charge Charger Revenue (million) Forecast, by Application 2020 & 2033
- Table 62: Turkey Gallium Nitride Desktop Fast Charge Charger Volume (K) Forecast, by Application 2020 & 2033
- Table 63: Israel Gallium Nitride Desktop Fast Charge Charger Revenue (million) Forecast, by Application 2020 & 2033
- Table 64: Israel Gallium Nitride Desktop Fast Charge Charger Volume (K) Forecast, by Application 2020 & 2033
- Table 65: GCC Gallium Nitride Desktop Fast Charge Charger Revenue (million) Forecast, by Application 2020 & 2033
- Table 66: GCC Gallium Nitride Desktop Fast Charge Charger Volume (K) Forecast, by Application 2020 & 2033
- Table 67: North Africa Gallium Nitride Desktop Fast Charge Charger Revenue (million) Forecast, by Application 2020 & 2033
- Table 68: North Africa Gallium Nitride Desktop Fast Charge Charger Volume (K) Forecast, by Application 2020 & 2033
- Table 69: South Africa Gallium Nitride Desktop Fast Charge Charger Revenue (million) Forecast, by Application 2020 & 2033
- Table 70: South Africa Gallium Nitride Desktop Fast Charge Charger Volume (K) Forecast, by Application 2020 & 2033
- Table 71: Rest of Middle East & Africa Gallium Nitride Desktop Fast Charge Charger Revenue (million) Forecast, by Application 2020 & 2033
- Table 72: Rest of Middle East & Africa Gallium Nitride Desktop Fast Charge Charger Volume (K) Forecast, by Application 2020 & 2033
- Table 73: Global Gallium Nitride Desktop Fast Charge Charger Revenue million Forecast, by Application 2020 & 2033
- Table 74: Global Gallium Nitride Desktop Fast Charge Charger Volume K Forecast, by Application 2020 & 2033
- Table 75: Global Gallium Nitride Desktop Fast Charge Charger Revenue million Forecast, by Types 2020 & 2033
- Table 76: Global Gallium Nitride Desktop Fast Charge Charger Volume K Forecast, by Types 2020 & 2033
- Table 77: Global Gallium Nitride Desktop Fast Charge Charger Revenue million Forecast, by Country 2020 & 2033
- Table 78: Global Gallium Nitride Desktop Fast Charge Charger Volume K Forecast, by Country 2020 & 2033
- Table 79: China Gallium Nitride Desktop Fast Charge Charger Revenue (million) Forecast, by Application 2020 & 2033
- Table 80: China Gallium Nitride Desktop Fast Charge Charger Volume (K) Forecast, by Application 2020 & 2033
- Table 81: India Gallium Nitride Desktop Fast Charge Charger Revenue (million) Forecast, by Application 2020 & 2033
- Table 82: India Gallium Nitride Desktop Fast Charge Charger Volume (K) Forecast, by Application 2020 & 2033
- Table 83: Japan Gallium Nitride Desktop Fast Charge Charger Revenue (million) Forecast, by Application 2020 & 2033
- Table 84: Japan Gallium Nitride Desktop Fast Charge Charger Volume (K) Forecast, by Application 2020 & 2033
- Table 85: South Korea Gallium Nitride Desktop Fast Charge Charger Revenue (million) Forecast, by Application 2020 & 2033
- Table 86: South Korea Gallium Nitride Desktop Fast Charge Charger Volume (K) Forecast, by Application 2020 & 2033
- Table 87: ASEAN Gallium Nitride Desktop Fast Charge Charger Revenue (million) Forecast, by Application 2020 & 2033
- Table 88: ASEAN Gallium Nitride Desktop Fast Charge Charger Volume (K) Forecast, by Application 2020 & 2033
- Table 89: Oceania Gallium Nitride Desktop Fast Charge Charger Revenue (million) Forecast, by Application 2020 & 2033
- Table 90: Oceania Gallium Nitride Desktop Fast Charge Charger Volume (K) Forecast, by Application 2020 & 2033
- Table 91: Rest of Asia Pacific Gallium Nitride Desktop Fast Charge Charger Revenue (million) Forecast, by Application 2020 & 2033
- Table 92: Rest of Asia Pacific Gallium Nitride Desktop Fast Charge Charger Volume (K) Forecast, by Application 2020 & 2033
Frequently Asked Questions
1. What is the projected Compound Annual Growth Rate (CAGR) of the Gallium Nitride Desktop Fast Charge Charger?
The projected CAGR is approximately XX%.
2. Which companies are prominent players in the Gallium Nitride Desktop Fast Charge Charger?
Key companies in the market include Dell Technologies, Lenovo, Samsung, Vivo, OPPO, Anker, Belkin, Baseus, Ugreen, Spigen, Motorola, Xiaomi, Shenzhen Blue times Technology, TEKA Technology.
3. What are the main segments of the Gallium Nitride Desktop Fast Charge Charger?
The market segments include Application, Types.
4. Can you provide details about the market size?
The market size is estimated to be USD XXX million as of 2022.
5. What are some drivers contributing to market growth?
N/A
6. What are the notable trends driving market growth?
N/A
7. Are there any restraints impacting market growth?
N/A
8. Can you provide examples of recent developments in the market?
N/A
9. What pricing options are available for accessing the report?
Pricing options include single-user, multi-user, and enterprise licenses priced at USD 3350.00, USD 5025.00, and USD 6700.00 respectively.
10. Is the market size provided in terms of value or volume?
The market size is provided in terms of value, measured in million and volume, measured in K.
11. Are there any specific market keywords associated with the report?
Yes, the market keyword associated with the report is "Gallium Nitride Desktop Fast Charge Charger," which aids in identifying and referencing the specific market segment covered.
12. How do I determine which pricing option suits my needs best?
The pricing options vary based on user requirements and access needs. Individual users may opt for single-user licenses, while businesses requiring broader access may choose multi-user or enterprise licenses for cost-effective access to the report.
13. Are there any additional resources or data provided in the Gallium Nitride Desktop Fast Charge Charger report?
While the report offers comprehensive insights, it's advisable to review the specific contents or supplementary materials provided to ascertain if additional resources or data are available.
14. How can I stay updated on further developments or reports in the Gallium Nitride Desktop Fast Charge Charger?
To stay informed about further developments, trends, and reports in the Gallium Nitride Desktop Fast Charge Charger, consider subscribing to industry newsletters, following relevant companies and organizations, or regularly checking reputable industry news sources and publications.
Methodology
Step 1 - Identification of Relevant Samples Size from Population Database


Step 2 - Approaches for Defining Global Market Size (Value, Volume* & Price*)

Note*: In applicable scenarios
Step 3 - Data Sources
Primary Research
- Web Analytics
- Survey Reports
- Research Institute
- Latest Research Reports
- Opinion Leaders
Secondary Research
- Annual Reports
- White Paper
- Latest Press Release
- Industry Association
- Paid Database
- Investor Presentations

Step 4 - Data Triangulation
Involves using different sources of information in order to increase the validity of a study
These sources are likely to be stakeholders in a program - participants, other researchers, program staff, other community members, and so on.
Then we put all data in single framework & apply various statistical tools to find out the dynamic on the market.
During the analysis stage, feedback from the stakeholder groups would be compared to determine areas of agreement as well as areas of divergence