

Key Insights
The global electronic thermal conductive double-sided tape market is poised for significant expansion, propelled by the escalating demand for advanced electronic devices and their increasing miniaturization. Key growth drivers include the widespread adoption of consumer electronics such as smartphones and laptops, requiring efficient thermal management for enhanced performance and longevity. The automotive sector's shift to electric and hybrid vehicles further stimulates demand for these thermal solutions, particularly for power electronics and battery systems. Advancements in the semiconductor industry, including integrated circuits and high-power processors, also necessitate superior thermal interface materials. Additionally, the growing use of LED lighting contributes to market growth. The market is segmented by application (electronic appliances, LED, semiconductor, others) and type (with substrate, no substrate), with each segment influenced by technological innovation and evolving application needs. Industry leaders like 3M, Nitto Denko, and Tesa are actively investing in R&D to develop products with superior thermal conductivity, adhesion, and durability, fostering a competitive and expanding market.
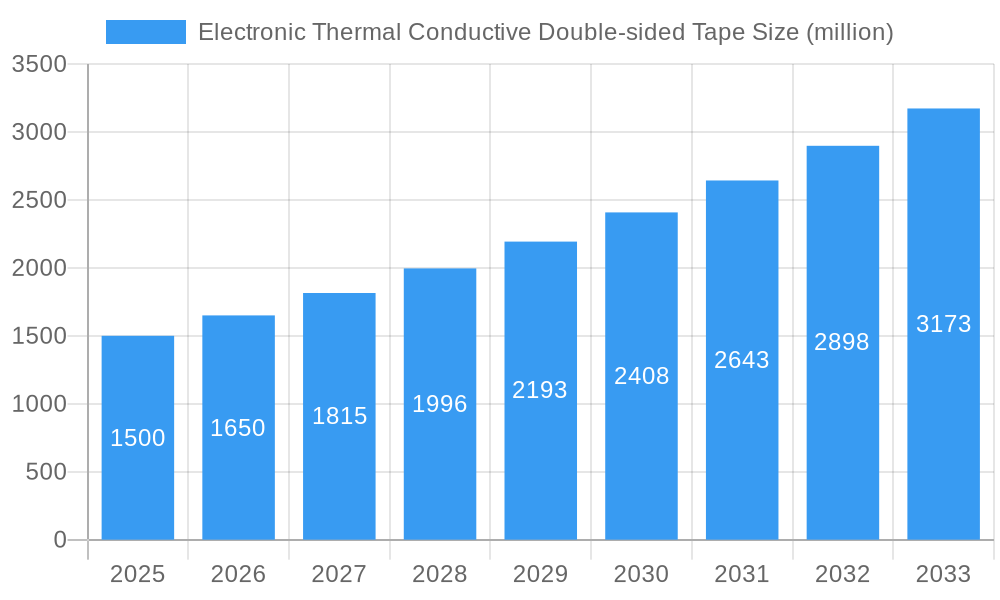
Electronic Thermal Conductive Double-sided Tape Market Size (In Billion)
Despite a positive growth trajectory, the market faces challenges, including fluctuating raw material costs and global economic instability, which can affect production expenses and market equilibrium. Stringent environmental regulations also require the development of sustainable adhesive alternatives, driving innovation in eco-friendly materials. Competitive pressures from new entrants and regional market variations present additional hurdles. Nevertheless, the market is projected to sustain its growth, with particular strength anticipated in Asia Pacific due to rapid industrialization and rising consumer electronics penetration. The forecast period, 2025 to 2033, presents substantial opportunities, especially in high-power density electronics and advanced packaging. Future market development will hinge on continued technological advancements, particularly in materials science, to enhance performance and address sustainability imperatives. The market size is projected to reach $14.56 billion by 2033, with a Compound Annual Growth Rate (CAGR) of 6.09% from the base year 2025.
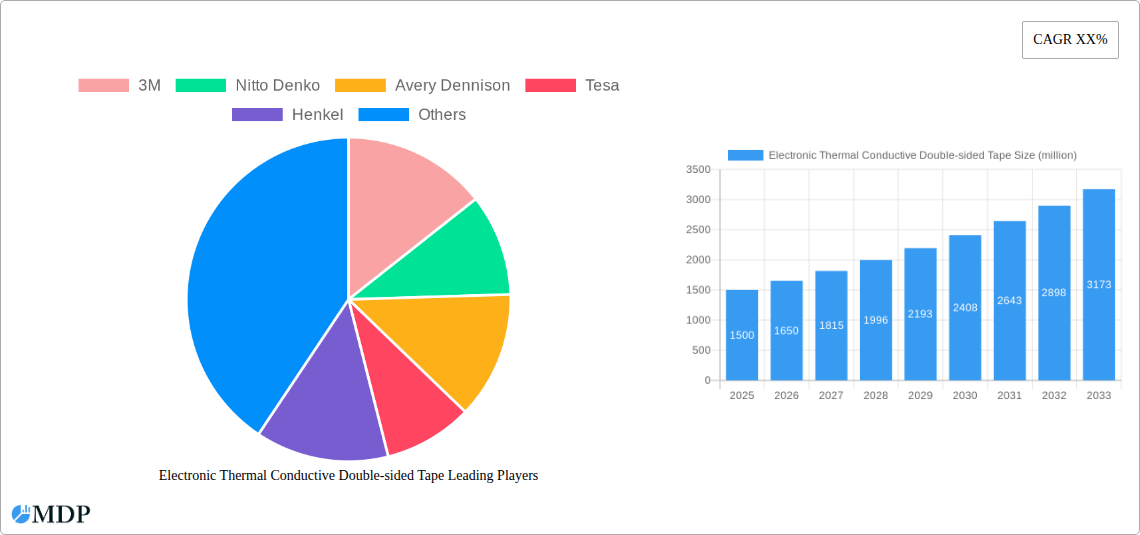
Electronic Thermal Conductive Double-sided Tape Company Market Share
Electronic Thermal Conductive Double-Sided Tape Market Report: 2019-2033
This comprehensive report provides a detailed analysis of the global electronic thermal conductive double-sided tape market, offering invaluable insights for industry stakeholders, investors, and strategic decision-makers. With a study period spanning 2019-2033, a base year of 2025, and a forecast period of 2025-2033, this report leverages rigorous research methodologies to paint a clear picture of market dynamics, trends, and future growth potential. The market is projected to reach xx million by 2033, experiencing a CAGR of xx% during the forecast period.
Electronic Thermal Conductive Double-sided Tape Market Dynamics & Concentration
The global electronic thermal conductive double-sided tape market is characterized by a moderately concentrated landscape, with key players such as 3M, Nitto Denko, and Avery Dennison holding significant market share. The market's concentration ratio (CR4) is estimated at xx%, indicating a degree of consolidation among the leading players. Innovation is a primary driver, with companies continuously developing tapes with improved thermal conductivity, adhesion, and durability to meet the evolving needs of electronic device manufacturers. Stringent regulatory frameworks regarding material safety and environmental compliance further shape market dynamics. Product substitutes, such as thermal pastes and adhesives, pose competitive challenges, while industry mergers and acquisitions (M&A) activities are expected to continue shaping the market landscape. Over the historical period (2019-2024), an estimated xx million deals were recorded in the sector. The estimated market share of 3M is xx%, Nitto Denko is xx%, and Avery Dennison is xx%.
- Market Concentration: CR4 estimated at xx% (2025).
- Innovation Drivers: Improved thermal conductivity, enhanced adhesion, and durable materials.
- Regulatory Frameworks: Focus on material safety and environmental impact.
- Product Substitutes: Thermal pastes and other adhesives.
- End-User Trends: Increasing demand from electronics, LED, and semiconductor industries.
- M&A Activity: xx million deals (2019-2024), with ongoing consolidation expected.
Electronic Thermal Conductive Double-sided Tape Industry Trends & Analysis
The electronic thermal conductive double-sided tape market is experiencing robust growth driven by the increasing demand for high-performance electronic devices with enhanced heat dissipation capabilities. Miniaturization and increased power density in electronic devices are key factors driving market expansion. Technological advancements in tape materials, such as the use of advanced polymers and fillers, are further boosting market growth. Consumer preference for smaller, more efficient, and reliable electronic products is fueling demand. Competitive dynamics are intense, with manufacturers focusing on product differentiation through innovation and superior performance characteristics. The market is expected to witness significant technological disruptions, with the introduction of new materials and manufacturing processes impacting production costs and efficiency. The market penetration of electronic thermal conductive double-sided tapes in various applications is expected to increase significantly during the forecast period, reaching xx% by 2033.
Leading Markets & Segments in Electronic Thermal Conductive Double-sided Tape
The Asia-Pacific region is currently the dominant market for electronic thermal conductive double-sided tape, driven by rapid growth in the electronics manufacturing industry, particularly in China and other Southeast Asian countries. Within applications, the semiconductor segment exhibits the highest growth rate, followed by LED and electronic appliances. The “with substrate” type currently holds a larger market share compared to the “no substrate” type.
- Key Drivers in Asia-Pacific:
- Strong growth in electronics manufacturing.
- Increasing investments in semiconductor and LED industries.
- Favorable government policies supporting technological advancements.
- Dominant Segment: Semiconductor applications demonstrate the fastest growth, followed by LED and electronic appliances. "With substrate" tape holds the largest market share.
- Country-level Analysis: China accounts for the largest share of the market within the Asia-Pacific region.
Electronic Thermal Conductive Double-sided Tape Product Developments
Recent product innovations focus on enhancing thermal conductivity, improving adhesion strength, and increasing durability. New materials and manufacturing processes are leading to cost-effective solutions while improving performance. These advancements cater to specific industry requirements in applications like high-power density electronics and advanced semiconductor packaging, offering significant competitive advantages.
Key Drivers of Electronic Thermal Conductive Double-sided Tape Growth
The growth of the electronic thermal conductive double-sided tape market is primarily driven by technological advancements, expanding electronic device applications, and the growing demand for efficient heat dissipation solutions. Miniaturization of electronics, increasing power density in devices, and stringent thermal management requirements are key factors. Government regulations promoting energy efficiency and sustainable electronics further contribute to market expansion.
Challenges in the Electronic Thermal Conductive Double-sided Tape Market
The market faces challenges including fluctuations in raw material prices, complex supply chain dynamics, and intense competition from alternative thermal management solutions. Regulatory compliance requirements and potential environmental concerns related to certain materials also pose limitations. These factors could impact the market's growth trajectory and profitability for manufacturers. Supply chain disruptions are estimated to have resulted in a xx million loss in revenue in 2022.
Emerging Opportunities in Electronic Thermal Conductive Double-sided Tape
Significant growth opportunities exist in the development of next-generation materials with even higher thermal conductivity, improved reliability, and better environmental profiles. Strategic partnerships and collaborations between material manufacturers and electronic device manufacturers are anticipated to drive innovation and accelerate market penetration in emerging applications, such as electric vehicles and renewable energy technologies. Expansion into new geographical markets presents further opportunities.
Leading Players in the Electronic Thermal Conductive Double-sided Tape Sector
- 3M
- Nitto Denko
- Avery Dennison
- Tesa
- Henkel
- Berry Plastics
- Intertape Polymer
- LINTEC Corporation
- Scapa
- Shurtape Technologies
- Lohmann
- ORAFOL Europe GmbH
- Jiarifengtai Electronic Technology
- Suzhou Xingchen Technology Co., Ltd
- Anhui Fuyin New Materials Co
Key Milestones in Electronic Thermal Conductive Double-sided Tape Industry
- 2020: 3M launches a new high-performance thermal conductive tape with enhanced thermal conductivity.
- 2021: Nitto Denko introduces a new environmentally friendly thermal tape.
- 2022: A major merger between two smaller players results in increased market consolidation.
- 2023: Avery Dennison introduces a new line of tapes specifically designed for the semiconductor industry. (Further milestones can be added based on actual data.)
Strategic Outlook for Electronic Thermal Conductive Double-sided Tape Market
The future of the electronic thermal conductive double-sided tape market looks promising, driven by continuous technological advancements and the expanding demand for high-performance electronics. Strategic partnerships, focus on sustainability, and expansion into new application areas will play crucial roles in shaping future market growth. The market is poised for continued expansion, with significant growth potential across various segments and geographical regions.
Electronic Thermal Conductive Double-sided Tape Segmentation
-
1. Application
- 1.1. Electronic Appliances
- 1.2. LED
- 1.3. Semiconductor
- 1.4. Others
-
2. Types
- 2.1. With Substrate
- 2.2. No Substrate
Electronic Thermal Conductive Double-sided Tape Segmentation By Geography
-
1. North America
- 1.1. United States
- 1.2. Canada
- 1.3. Mexico
-
2. South America
- 2.1. Brazil
- 2.2. Argentina
- 2.3. Rest of South America
-
3. Europe
- 3.1. United Kingdom
- 3.2. Germany
- 3.3. France
- 3.4. Italy
- 3.5. Spain
- 3.6. Russia
- 3.7. Benelux
- 3.8. Nordics
- 3.9. Rest of Europe
-
4. Middle East & Africa
- 4.1. Turkey
- 4.2. Israel
- 4.3. GCC
- 4.4. North Africa
- 4.5. South Africa
- 4.6. Rest of Middle East & Africa
-
5. Asia Pacific
- 5.1. China
- 5.2. India
- 5.3. Japan
- 5.4. South Korea
- 5.5. ASEAN
- 5.6. Oceania
- 5.7. Rest of Asia Pacific
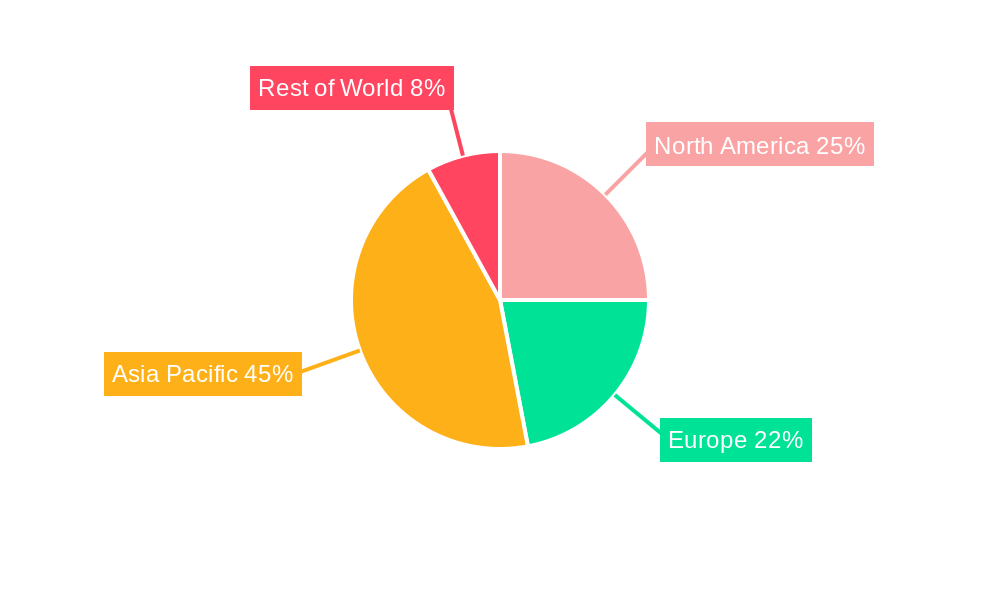
Electronic Thermal Conductive Double-sided Tape Regional Market Share
Geographic Coverage of Electronic Thermal Conductive Double-sided Tape
Electronic Thermal Conductive Double-sided Tape REPORT HIGHLIGHTS
| Aspects | Details |
|---|---|
| Study Period | 2020-2034 |
| Base Year | 2025 |
| Estimated Year | 2026 |
| Forecast Period | 2026-2034 |
| Historical Period | 2020-2025 |
| Growth Rate | CAGR of 6.09% from 2020-2034 |
| Segmentation |
|
Table of Contents
- 1. Introduction
- 1.1. Research Scope
- 1.2. Market Segmentation
- 1.3. Research Methodology
- 1.4. Definitions and Assumptions
- 2. Executive Summary
- 2.1. Introduction
- 3. Market Dynamics
- 3.1. Introduction
- 3.2. Market Drivers
- 3.3. Market Restrains
- 3.4. Market Trends
- 4. Market Factor Analysis
- 4.1. Porters Five Forces
- 4.2. Supply/Value Chain
- 4.3. PESTEL analysis
- 4.4. Market Entropy
- 4.5. Patent/Trademark Analysis
- 5. Global Electronic Thermal Conductive Double-sided Tape Analysis, Insights and Forecast, 2020-2032
- 5.1. Market Analysis, Insights and Forecast - by Application
- 5.1.1. Electronic Appliances
- 5.1.2. LED
- 5.1.3. Semiconductor
- 5.1.4. Others
- 5.2. Market Analysis, Insights and Forecast - by Types
- 5.2.1. With Substrate
- 5.2.2. No Substrate
- 5.3. Market Analysis, Insights and Forecast - by Region
- 5.3.1. North America
- 5.3.2. South America
- 5.3.3. Europe
- 5.3.4. Middle East & Africa
- 5.3.5. Asia Pacific
- 5.1. Market Analysis, Insights and Forecast - by Application
- 6. North America Electronic Thermal Conductive Double-sided Tape Analysis, Insights and Forecast, 2020-2032
- 6.1. Market Analysis, Insights and Forecast - by Application
- 6.1.1. Electronic Appliances
- 6.1.2. LED
- 6.1.3. Semiconductor
- 6.1.4. Others
- 6.2. Market Analysis, Insights and Forecast - by Types
- 6.2.1. With Substrate
- 6.2.2. No Substrate
- 6.1. Market Analysis, Insights and Forecast - by Application
- 7. South America Electronic Thermal Conductive Double-sided Tape Analysis, Insights and Forecast, 2020-2032
- 7.1. Market Analysis, Insights and Forecast - by Application
- 7.1.1. Electronic Appliances
- 7.1.2. LED
- 7.1.3. Semiconductor
- 7.1.4. Others
- 7.2. Market Analysis, Insights and Forecast - by Types
- 7.2.1. With Substrate
- 7.2.2. No Substrate
- 7.1. Market Analysis, Insights and Forecast - by Application
- 8. Europe Electronic Thermal Conductive Double-sided Tape Analysis, Insights and Forecast, 2020-2032
- 8.1. Market Analysis, Insights and Forecast - by Application
- 8.1.1. Electronic Appliances
- 8.1.2. LED
- 8.1.3. Semiconductor
- 8.1.4. Others
- 8.2. Market Analysis, Insights and Forecast - by Types
- 8.2.1. With Substrate
- 8.2.2. No Substrate
- 8.1. Market Analysis, Insights and Forecast - by Application
- 9. Middle East & Africa Electronic Thermal Conductive Double-sided Tape Analysis, Insights and Forecast, 2020-2032
- 9.1. Market Analysis, Insights and Forecast - by Application
- 9.1.1. Electronic Appliances
- 9.1.2. LED
- 9.1.3. Semiconductor
- 9.1.4. Others
- 9.2. Market Analysis, Insights and Forecast - by Types
- 9.2.1. With Substrate
- 9.2.2. No Substrate
- 9.1. Market Analysis, Insights and Forecast - by Application
- 10. Asia Pacific Electronic Thermal Conductive Double-sided Tape Analysis, Insights and Forecast, 2020-2032
- 10.1. Market Analysis, Insights and Forecast - by Application
- 10.1.1. Electronic Appliances
- 10.1.2. LED
- 10.1.3. Semiconductor
- 10.1.4. Others
- 10.2. Market Analysis, Insights and Forecast - by Types
- 10.2.1. With Substrate
- 10.2.2. No Substrate
- 10.1. Market Analysis, Insights and Forecast - by Application
- 11. Competitive Analysis
- 11.1. Global Market Share Analysis 2025
- 11.2. Company Profiles
- 11.2.1 3M
- 11.2.1.1. Overview
- 11.2.1.2. Products
- 11.2.1.3. SWOT Analysis
- 11.2.1.4. Recent Developments
- 11.2.1.5. Financials (Based on Availability)
- 11.2.2 Nitto Denko
- 11.2.2.1. Overview
- 11.2.2.2. Products
- 11.2.2.3. SWOT Analysis
- 11.2.2.4. Recent Developments
- 11.2.2.5. Financials (Based on Availability)
- 11.2.3 Avery Dennison
- 11.2.3.1. Overview
- 11.2.3.2. Products
- 11.2.3.3. SWOT Analysis
- 11.2.3.4. Recent Developments
- 11.2.3.5. Financials (Based on Availability)
- 11.2.4 Tesa
- 11.2.4.1. Overview
- 11.2.4.2. Products
- 11.2.4.3. SWOT Analysis
- 11.2.4.4. Recent Developments
- 11.2.4.5. Financials (Based on Availability)
- 11.2.5 Henkel
- 11.2.5.1. Overview
- 11.2.5.2. Products
- 11.2.5.3. SWOT Analysis
- 11.2.5.4. Recent Developments
- 11.2.5.5. Financials (Based on Availability)
- 11.2.6 Berry Plastics
- 11.2.6.1. Overview
- 11.2.6.2. Products
- 11.2.6.3. SWOT Analysis
- 11.2.6.4. Recent Developments
- 11.2.6.5. Financials (Based on Availability)
- 11.2.7 Intertape Polymer
- 11.2.7.1. Overview
- 11.2.7.2. Products
- 11.2.7.3. SWOT Analysis
- 11.2.7.4. Recent Developments
- 11.2.7.5. Financials (Based on Availability)
- 11.2.8 LINTEC Corporation
- 11.2.8.1. Overview
- 11.2.8.2. Products
- 11.2.8.3. SWOT Analysis
- 11.2.8.4. Recent Developments
- 11.2.8.5. Financials (Based on Availability)
- 11.2.9 Scapa
- 11.2.9.1. Overview
- 11.2.9.2. Products
- 11.2.9.3. SWOT Analysis
- 11.2.9.4. Recent Developments
- 11.2.9.5. Financials (Based on Availability)
- 11.2.10 Shurtape Technologies
- 11.2.10.1. Overview
- 11.2.10.2. Products
- 11.2.10.3. SWOT Analysis
- 11.2.10.4. Recent Developments
- 11.2.10.5. Financials (Based on Availability)
- 11.2.11 Lohmann
- 11.2.11.1. Overview
- 11.2.11.2. Products
- 11.2.11.3. SWOT Analysis
- 11.2.11.4. Recent Developments
- 11.2.11.5. Financials (Based on Availability)
- 11.2.12 ORAFOL Europe GmbH
- 11.2.12.1. Overview
- 11.2.12.2. Products
- 11.2.12.3. SWOT Analysis
- 11.2.12.4. Recent Developments
- 11.2.12.5. Financials (Based on Availability)
- 11.2.13 Jiarifengtai Electronic Technology
- 11.2.13.1. Overview
- 11.2.13.2. Products
- 11.2.13.3. SWOT Analysis
- 11.2.13.4. Recent Developments
- 11.2.13.5. Financials (Based on Availability)
- 11.2.14 Suzhou Xingchen Technology Co. Ltd
- 11.2.14.1. Overview
- 11.2.14.2. Products
- 11.2.14.3. SWOT Analysis
- 11.2.14.4. Recent Developments
- 11.2.14.5. Financials (Based on Availability)
- 11.2.15 Anhui Fuyin New Materials Co
- 11.2.15.1. Overview
- 11.2.15.2. Products
- 11.2.15.3. SWOT Analysis
- 11.2.15.4. Recent Developments
- 11.2.15.5. Financials (Based on Availability)
- 11.2.1 3M
List of Figures
- Figure 1: Global Electronic Thermal Conductive Double-sided Tape Revenue Breakdown (billion, %) by Region 2025 & 2033
- Figure 2: Global Electronic Thermal Conductive Double-sided Tape Volume Breakdown (K, %) by Region 2025 & 2033
- Figure 3: North America Electronic Thermal Conductive Double-sided Tape Revenue (billion), by Application 2025 & 2033
- Figure 4: North America Electronic Thermal Conductive Double-sided Tape Volume (K), by Application 2025 & 2033
- Figure 5: North America Electronic Thermal Conductive Double-sided Tape Revenue Share (%), by Application 2025 & 2033
- Figure 6: North America Electronic Thermal Conductive Double-sided Tape Volume Share (%), by Application 2025 & 2033
- Figure 7: North America Electronic Thermal Conductive Double-sided Tape Revenue (billion), by Types 2025 & 2033
- Figure 8: North America Electronic Thermal Conductive Double-sided Tape Volume (K), by Types 2025 & 2033
- Figure 9: North America Electronic Thermal Conductive Double-sided Tape Revenue Share (%), by Types 2025 & 2033
- Figure 10: North America Electronic Thermal Conductive Double-sided Tape Volume Share (%), by Types 2025 & 2033
- Figure 11: North America Electronic Thermal Conductive Double-sided Tape Revenue (billion), by Country 2025 & 2033
- Figure 12: North America Electronic Thermal Conductive Double-sided Tape Volume (K), by Country 2025 & 2033
- Figure 13: North America Electronic Thermal Conductive Double-sided Tape Revenue Share (%), by Country 2025 & 2033
- Figure 14: North America Electronic Thermal Conductive Double-sided Tape Volume Share (%), by Country 2025 & 2033
- Figure 15: South America Electronic Thermal Conductive Double-sided Tape Revenue (billion), by Application 2025 & 2033
- Figure 16: South America Electronic Thermal Conductive Double-sided Tape Volume (K), by Application 2025 & 2033
- Figure 17: South America Electronic Thermal Conductive Double-sided Tape Revenue Share (%), by Application 2025 & 2033
- Figure 18: South America Electronic Thermal Conductive Double-sided Tape Volume Share (%), by Application 2025 & 2033
- Figure 19: South America Electronic Thermal Conductive Double-sided Tape Revenue (billion), by Types 2025 & 2033
- Figure 20: South America Electronic Thermal Conductive Double-sided Tape Volume (K), by Types 2025 & 2033
- Figure 21: South America Electronic Thermal Conductive Double-sided Tape Revenue Share (%), by Types 2025 & 2033
- Figure 22: South America Electronic Thermal Conductive Double-sided Tape Volume Share (%), by Types 2025 & 2033
- Figure 23: South America Electronic Thermal Conductive Double-sided Tape Revenue (billion), by Country 2025 & 2033
- Figure 24: South America Electronic Thermal Conductive Double-sided Tape Volume (K), by Country 2025 & 2033
- Figure 25: South America Electronic Thermal Conductive Double-sided Tape Revenue Share (%), by Country 2025 & 2033
- Figure 26: South America Electronic Thermal Conductive Double-sided Tape Volume Share (%), by Country 2025 & 2033
- Figure 27: Europe Electronic Thermal Conductive Double-sided Tape Revenue (billion), by Application 2025 & 2033
- Figure 28: Europe Electronic Thermal Conductive Double-sided Tape Volume (K), by Application 2025 & 2033
- Figure 29: Europe Electronic Thermal Conductive Double-sided Tape Revenue Share (%), by Application 2025 & 2033
- Figure 30: Europe Electronic Thermal Conductive Double-sided Tape Volume Share (%), by Application 2025 & 2033
- Figure 31: Europe Electronic Thermal Conductive Double-sided Tape Revenue (billion), by Types 2025 & 2033
- Figure 32: Europe Electronic Thermal Conductive Double-sided Tape Volume (K), by Types 2025 & 2033
- Figure 33: Europe Electronic Thermal Conductive Double-sided Tape Revenue Share (%), by Types 2025 & 2033
- Figure 34: Europe Electronic Thermal Conductive Double-sided Tape Volume Share (%), by Types 2025 & 2033
- Figure 35: Europe Electronic Thermal Conductive Double-sided Tape Revenue (billion), by Country 2025 & 2033
- Figure 36: Europe Electronic Thermal Conductive Double-sided Tape Volume (K), by Country 2025 & 2033
- Figure 37: Europe Electronic Thermal Conductive Double-sided Tape Revenue Share (%), by Country 2025 & 2033
- Figure 38: Europe Electronic Thermal Conductive Double-sided Tape Volume Share (%), by Country 2025 & 2033
- Figure 39: Middle East & Africa Electronic Thermal Conductive Double-sided Tape Revenue (billion), by Application 2025 & 2033
- Figure 40: Middle East & Africa Electronic Thermal Conductive Double-sided Tape Volume (K), by Application 2025 & 2033
- Figure 41: Middle East & Africa Electronic Thermal Conductive Double-sided Tape Revenue Share (%), by Application 2025 & 2033
- Figure 42: Middle East & Africa Electronic Thermal Conductive Double-sided Tape Volume Share (%), by Application 2025 & 2033
- Figure 43: Middle East & Africa Electronic Thermal Conductive Double-sided Tape Revenue (billion), by Types 2025 & 2033
- Figure 44: Middle East & Africa Electronic Thermal Conductive Double-sided Tape Volume (K), by Types 2025 & 2033
- Figure 45: Middle East & Africa Electronic Thermal Conductive Double-sided Tape Revenue Share (%), by Types 2025 & 2033
- Figure 46: Middle East & Africa Electronic Thermal Conductive Double-sided Tape Volume Share (%), by Types 2025 & 2033
- Figure 47: Middle East & Africa Electronic Thermal Conductive Double-sided Tape Revenue (billion), by Country 2025 & 2033
- Figure 48: Middle East & Africa Electronic Thermal Conductive Double-sided Tape Volume (K), by Country 2025 & 2033
- Figure 49: Middle East & Africa Electronic Thermal Conductive Double-sided Tape Revenue Share (%), by Country 2025 & 2033
- Figure 50: Middle East & Africa Electronic Thermal Conductive Double-sided Tape Volume Share (%), by Country 2025 & 2033
- Figure 51: Asia Pacific Electronic Thermal Conductive Double-sided Tape Revenue (billion), by Application 2025 & 2033
- Figure 52: Asia Pacific Electronic Thermal Conductive Double-sided Tape Volume (K), by Application 2025 & 2033
- Figure 53: Asia Pacific Electronic Thermal Conductive Double-sided Tape Revenue Share (%), by Application 2025 & 2033
- Figure 54: Asia Pacific Electronic Thermal Conductive Double-sided Tape Volume Share (%), by Application 2025 & 2033
- Figure 55: Asia Pacific Electronic Thermal Conductive Double-sided Tape Revenue (billion), by Types 2025 & 2033
- Figure 56: Asia Pacific Electronic Thermal Conductive Double-sided Tape Volume (K), by Types 2025 & 2033
- Figure 57: Asia Pacific Electronic Thermal Conductive Double-sided Tape Revenue Share (%), by Types 2025 & 2033
- Figure 58: Asia Pacific Electronic Thermal Conductive Double-sided Tape Volume Share (%), by Types 2025 & 2033
- Figure 59: Asia Pacific Electronic Thermal Conductive Double-sided Tape Revenue (billion), by Country 2025 & 2033
- Figure 60: Asia Pacific Electronic Thermal Conductive Double-sided Tape Volume (K), by Country 2025 & 2033
- Figure 61: Asia Pacific Electronic Thermal Conductive Double-sided Tape Revenue Share (%), by Country 2025 & 2033
- Figure 62: Asia Pacific Electronic Thermal Conductive Double-sided Tape Volume Share (%), by Country 2025 & 2033
List of Tables
- Table 1: Global Electronic Thermal Conductive Double-sided Tape Revenue billion Forecast, by Application 2020 & 2033
- Table 2: Global Electronic Thermal Conductive Double-sided Tape Volume K Forecast, by Application 2020 & 2033
- Table 3: Global Electronic Thermal Conductive Double-sided Tape Revenue billion Forecast, by Types 2020 & 2033
- Table 4: Global Electronic Thermal Conductive Double-sided Tape Volume K Forecast, by Types 2020 & 2033
- Table 5: Global Electronic Thermal Conductive Double-sided Tape Revenue billion Forecast, by Region 2020 & 2033
- Table 6: Global Electronic Thermal Conductive Double-sided Tape Volume K Forecast, by Region 2020 & 2033
- Table 7: Global Electronic Thermal Conductive Double-sided Tape Revenue billion Forecast, by Application 2020 & 2033
- Table 8: Global Electronic Thermal Conductive Double-sided Tape Volume K Forecast, by Application 2020 & 2033
- Table 9: Global Electronic Thermal Conductive Double-sided Tape Revenue billion Forecast, by Types 2020 & 2033
- Table 10: Global Electronic Thermal Conductive Double-sided Tape Volume K Forecast, by Types 2020 & 2033
- Table 11: Global Electronic Thermal Conductive Double-sided Tape Revenue billion Forecast, by Country 2020 & 2033
- Table 12: Global Electronic Thermal Conductive Double-sided Tape Volume K Forecast, by Country 2020 & 2033
- Table 13: United States Electronic Thermal Conductive Double-sided Tape Revenue (billion) Forecast, by Application 2020 & 2033
- Table 14: United States Electronic Thermal Conductive Double-sided Tape Volume (K) Forecast, by Application 2020 & 2033
- Table 15: Canada Electronic Thermal Conductive Double-sided Tape Revenue (billion) Forecast, by Application 2020 & 2033
- Table 16: Canada Electronic Thermal Conductive Double-sided Tape Volume (K) Forecast, by Application 2020 & 2033
- Table 17: Mexico Electronic Thermal Conductive Double-sided Tape Revenue (billion) Forecast, by Application 2020 & 2033
- Table 18: Mexico Electronic Thermal Conductive Double-sided Tape Volume (K) Forecast, by Application 2020 & 2033
- Table 19: Global Electronic Thermal Conductive Double-sided Tape Revenue billion Forecast, by Application 2020 & 2033
- Table 20: Global Electronic Thermal Conductive Double-sided Tape Volume K Forecast, by Application 2020 & 2033
- Table 21: Global Electronic Thermal Conductive Double-sided Tape Revenue billion Forecast, by Types 2020 & 2033
- Table 22: Global Electronic Thermal Conductive Double-sided Tape Volume K Forecast, by Types 2020 & 2033
- Table 23: Global Electronic Thermal Conductive Double-sided Tape Revenue billion Forecast, by Country 2020 & 2033
- Table 24: Global Electronic Thermal Conductive Double-sided Tape Volume K Forecast, by Country 2020 & 2033
- Table 25: Brazil Electronic Thermal Conductive Double-sided Tape Revenue (billion) Forecast, by Application 2020 & 2033
- Table 26: Brazil Electronic Thermal Conductive Double-sided Tape Volume (K) Forecast, by Application 2020 & 2033
- Table 27: Argentina Electronic Thermal Conductive Double-sided Tape Revenue (billion) Forecast, by Application 2020 & 2033
- Table 28: Argentina Electronic Thermal Conductive Double-sided Tape Volume (K) Forecast, by Application 2020 & 2033
- Table 29: Rest of South America Electronic Thermal Conductive Double-sided Tape Revenue (billion) Forecast, by Application 2020 & 2033
- Table 30: Rest of South America Electronic Thermal Conductive Double-sided Tape Volume (K) Forecast, by Application 2020 & 2033
- Table 31: Global Electronic Thermal Conductive Double-sided Tape Revenue billion Forecast, by Application 2020 & 2033
- Table 32: Global Electronic Thermal Conductive Double-sided Tape Volume K Forecast, by Application 2020 & 2033
- Table 33: Global Electronic Thermal Conductive Double-sided Tape Revenue billion Forecast, by Types 2020 & 2033
- Table 34: Global Electronic Thermal Conductive Double-sided Tape Volume K Forecast, by Types 2020 & 2033
- Table 35: Global Electronic Thermal Conductive Double-sided Tape Revenue billion Forecast, by Country 2020 & 2033
- Table 36: Global Electronic Thermal Conductive Double-sided Tape Volume K Forecast, by Country 2020 & 2033
- Table 37: United Kingdom Electronic Thermal Conductive Double-sided Tape Revenue (billion) Forecast, by Application 2020 & 2033
- Table 38: United Kingdom Electronic Thermal Conductive Double-sided Tape Volume (K) Forecast, by Application 2020 & 2033
- Table 39: Germany Electronic Thermal Conductive Double-sided Tape Revenue (billion) Forecast, by Application 2020 & 2033
- Table 40: Germany Electronic Thermal Conductive Double-sided Tape Volume (K) Forecast, by Application 2020 & 2033
- Table 41: France Electronic Thermal Conductive Double-sided Tape Revenue (billion) Forecast, by Application 2020 & 2033
- Table 42: France Electronic Thermal Conductive Double-sided Tape Volume (K) Forecast, by Application 2020 & 2033
- Table 43: Italy Electronic Thermal Conductive Double-sided Tape Revenue (billion) Forecast, by Application 2020 & 2033
- Table 44: Italy Electronic Thermal Conductive Double-sided Tape Volume (K) Forecast, by Application 2020 & 2033
- Table 45: Spain Electronic Thermal Conductive Double-sided Tape Revenue (billion) Forecast, by Application 2020 & 2033
- Table 46: Spain Electronic Thermal Conductive Double-sided Tape Volume (K) Forecast, by Application 2020 & 2033
- Table 47: Russia Electronic Thermal Conductive Double-sided Tape Revenue (billion) Forecast, by Application 2020 & 2033
- Table 48: Russia Electronic Thermal Conductive Double-sided Tape Volume (K) Forecast, by Application 2020 & 2033
- Table 49: Benelux Electronic Thermal Conductive Double-sided Tape Revenue (billion) Forecast, by Application 2020 & 2033
- Table 50: Benelux Electronic Thermal Conductive Double-sided Tape Volume (K) Forecast, by Application 2020 & 2033
- Table 51: Nordics Electronic Thermal Conductive Double-sided Tape Revenue (billion) Forecast, by Application 2020 & 2033
- Table 52: Nordics Electronic Thermal Conductive Double-sided Tape Volume (K) Forecast, by Application 2020 & 2033
- Table 53: Rest of Europe Electronic Thermal Conductive Double-sided Tape Revenue (billion) Forecast, by Application 2020 & 2033
- Table 54: Rest of Europe Electronic Thermal Conductive Double-sided Tape Volume (K) Forecast, by Application 2020 & 2033
- Table 55: Global Electronic Thermal Conductive Double-sided Tape Revenue billion Forecast, by Application 2020 & 2033
- Table 56: Global Electronic Thermal Conductive Double-sided Tape Volume K Forecast, by Application 2020 & 2033
- Table 57: Global Electronic Thermal Conductive Double-sided Tape Revenue billion Forecast, by Types 2020 & 2033
- Table 58: Global Electronic Thermal Conductive Double-sided Tape Volume K Forecast, by Types 2020 & 2033
- Table 59: Global Electronic Thermal Conductive Double-sided Tape Revenue billion Forecast, by Country 2020 & 2033
- Table 60: Global Electronic Thermal Conductive Double-sided Tape Volume K Forecast, by Country 2020 & 2033
- Table 61: Turkey Electronic Thermal Conductive Double-sided Tape Revenue (billion) Forecast, by Application 2020 & 2033
- Table 62: Turkey Electronic Thermal Conductive Double-sided Tape Volume (K) Forecast, by Application 2020 & 2033
- Table 63: Israel Electronic Thermal Conductive Double-sided Tape Revenue (billion) Forecast, by Application 2020 & 2033
- Table 64: Israel Electronic Thermal Conductive Double-sided Tape Volume (K) Forecast, by Application 2020 & 2033
- Table 65: GCC Electronic Thermal Conductive Double-sided Tape Revenue (billion) Forecast, by Application 2020 & 2033
- Table 66: GCC Electronic Thermal Conductive Double-sided Tape Volume (K) Forecast, by Application 2020 & 2033
- Table 67: North Africa Electronic Thermal Conductive Double-sided Tape Revenue (billion) Forecast, by Application 2020 & 2033
- Table 68: North Africa Electronic Thermal Conductive Double-sided Tape Volume (K) Forecast, by Application 2020 & 2033
- Table 69: South Africa Electronic Thermal Conductive Double-sided Tape Revenue (billion) Forecast, by Application 2020 & 2033
- Table 70: South Africa Electronic Thermal Conductive Double-sided Tape Volume (K) Forecast, by Application 2020 & 2033
- Table 71: Rest of Middle East & Africa Electronic Thermal Conductive Double-sided Tape Revenue (billion) Forecast, by Application 2020 & 2033
- Table 72: Rest of Middle East & Africa Electronic Thermal Conductive Double-sided Tape Volume (K) Forecast, by Application 2020 & 2033
- Table 73: Global Electronic Thermal Conductive Double-sided Tape Revenue billion Forecast, by Application 2020 & 2033
- Table 74: Global Electronic Thermal Conductive Double-sided Tape Volume K Forecast, by Application 2020 & 2033
- Table 75: Global Electronic Thermal Conductive Double-sided Tape Revenue billion Forecast, by Types 2020 & 2033
- Table 76: Global Electronic Thermal Conductive Double-sided Tape Volume K Forecast, by Types 2020 & 2033
- Table 77: Global Electronic Thermal Conductive Double-sided Tape Revenue billion Forecast, by Country 2020 & 2033
- Table 78: Global Electronic Thermal Conductive Double-sided Tape Volume K Forecast, by Country 2020 & 2033
- Table 79: China Electronic Thermal Conductive Double-sided Tape Revenue (billion) Forecast, by Application 2020 & 2033
- Table 80: China Electronic Thermal Conductive Double-sided Tape Volume (K) Forecast, by Application 2020 & 2033
- Table 81: India Electronic Thermal Conductive Double-sided Tape Revenue (billion) Forecast, by Application 2020 & 2033
- Table 82: India Electronic Thermal Conductive Double-sided Tape Volume (K) Forecast, by Application 2020 & 2033
- Table 83: Japan Electronic Thermal Conductive Double-sided Tape Revenue (billion) Forecast, by Application 2020 & 2033
- Table 84: Japan Electronic Thermal Conductive Double-sided Tape Volume (K) Forecast, by Application 2020 & 2033
- Table 85: South Korea Electronic Thermal Conductive Double-sided Tape Revenue (billion) Forecast, by Application 2020 & 2033
- Table 86: South Korea Electronic Thermal Conductive Double-sided Tape Volume (K) Forecast, by Application 2020 & 2033
- Table 87: ASEAN Electronic Thermal Conductive Double-sided Tape Revenue (billion) Forecast, by Application 2020 & 2033
- Table 88: ASEAN Electronic Thermal Conductive Double-sided Tape Volume (K) Forecast, by Application 2020 & 2033
- Table 89: Oceania Electronic Thermal Conductive Double-sided Tape Revenue (billion) Forecast, by Application 2020 & 2033
- Table 90: Oceania Electronic Thermal Conductive Double-sided Tape Volume (K) Forecast, by Application 2020 & 2033
- Table 91: Rest of Asia Pacific Electronic Thermal Conductive Double-sided Tape Revenue (billion) Forecast, by Application 2020 & 2033
- Table 92: Rest of Asia Pacific Electronic Thermal Conductive Double-sided Tape Volume (K) Forecast, by Application 2020 & 2033
Frequently Asked Questions
1. What is the projected Compound Annual Growth Rate (CAGR) of the Electronic Thermal Conductive Double-sided Tape?
The projected CAGR is approximately 6.09%.
2. Which companies are prominent players in the Electronic Thermal Conductive Double-sided Tape?
Key companies in the market include 3M, Nitto Denko, Avery Dennison, Tesa, Henkel, Berry Plastics, Intertape Polymer, LINTEC Corporation, Scapa, Shurtape Technologies, Lohmann, ORAFOL Europe GmbH, Jiarifengtai Electronic Technology, Suzhou Xingchen Technology Co., Ltd, Anhui Fuyin New Materials Co.
3. What are the main segments of the Electronic Thermal Conductive Double-sided Tape?
The market segments include Application, Types.
4. Can you provide details about the market size?
The market size is estimated to be USD 14.56 billion as of 2022.
5. What are some drivers contributing to market growth?
N/A
6. What are the notable trends driving market growth?
N/A
7. Are there any restraints impacting market growth?
N/A
8. Can you provide examples of recent developments in the market?
N/A
9. What pricing options are available for accessing the report?
Pricing options include single-user, multi-user, and enterprise licenses priced at USD 3950.00, USD 5925.00, and USD 7900.00 respectively.
10. Is the market size provided in terms of value or volume?
The market size is provided in terms of value, measured in billion and volume, measured in K.
11. Are there any specific market keywords associated with the report?
Yes, the market keyword associated with the report is "Electronic Thermal Conductive Double-sided Tape," which aids in identifying and referencing the specific market segment covered.
12. How do I determine which pricing option suits my needs best?
The pricing options vary based on user requirements and access needs. Individual users may opt for single-user licenses, while businesses requiring broader access may choose multi-user or enterprise licenses for cost-effective access to the report.
13. Are there any additional resources or data provided in the Electronic Thermal Conductive Double-sided Tape report?
While the report offers comprehensive insights, it's advisable to review the specific contents or supplementary materials provided to ascertain if additional resources or data are available.
14. How can I stay updated on further developments or reports in the Electronic Thermal Conductive Double-sided Tape?
To stay informed about further developments, trends, and reports in the Electronic Thermal Conductive Double-sided Tape, consider subscribing to industry newsletters, following relevant companies and organizations, or regularly checking reputable industry news sources and publications.
Methodology
Step 1 - Identification of Relevant Samples Size from Population Database


Step 2 - Approaches for Defining Global Market Size (Value, Volume* & Price*)

Note*: In applicable scenarios
Step 3 - Data Sources
Primary Research
- Web Analytics
- Survey Reports
- Research Institute
- Latest Research Reports
- Opinion Leaders
Secondary Research
- Annual Reports
- White Paper
- Latest Press Release
- Industry Association
- Paid Database
- Investor Presentations

Step 4 - Data Triangulation
Involves using different sources of information in order to increase the validity of a study
These sources are likely to be stakeholders in a program - participants, other researchers, program staff, other community members, and so on.
Then we put all data in single framework & apply various statistical tools to find out the dynamic on the market.
During the analysis stage, feedback from the stakeholder groups would be compared to determine areas of agreement as well as areas of divergence