

Key Insights
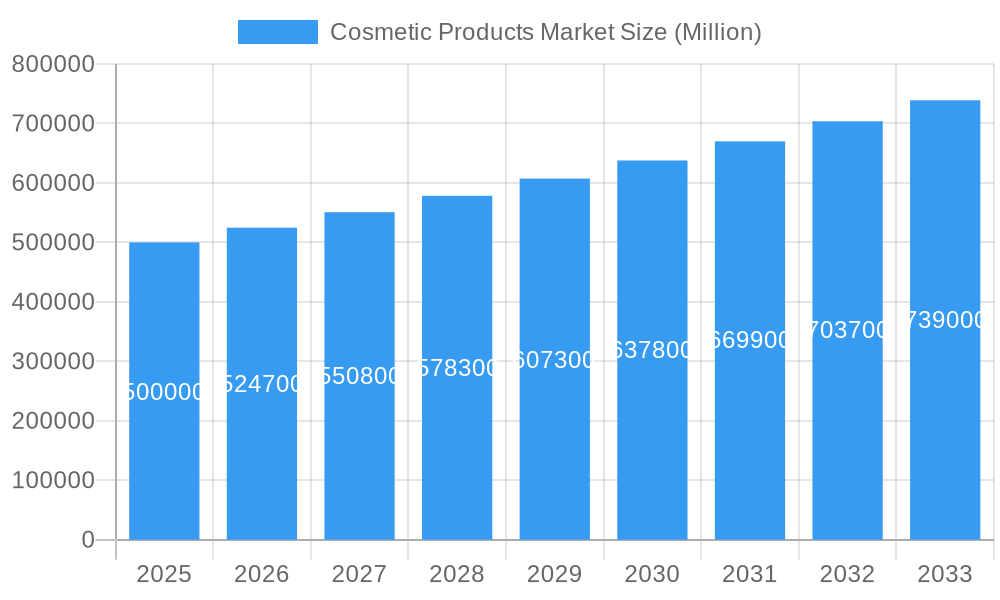
The global cosmetic products market, valued at approximately $67.54 billion in 2025, is projected to experience robust growth, exhibiting a compound annual growth rate (CAGR) of 6.01% from 2025 to 2033. This expansion is propelled by rising disposable incomes in emerging economies, heightened awareness of personal care and beauty, and the influential role of social media in shaping beauty trends and driving consumer spending. The market is increasingly prioritizing premium and natural cosmetic products, aligning with growing consumer demand for high-quality, sustainable, and ethically sourced ingredients. E-commerce further enhances accessibility to a wider product selection. Challenges include fluctuating raw material prices and evolving regulatory landscapes.
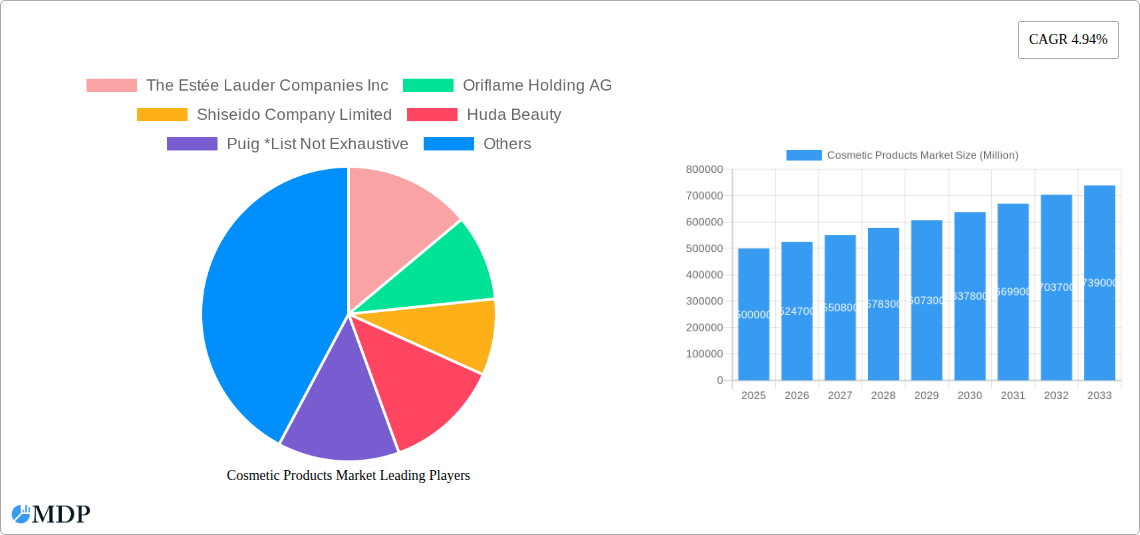
Cosmetic Products Market Market Size (In Billion)
The market is segmented by product type, with facial makeup leading, followed by eye and lip makeup. The premium segment is outperforming the mass segment, signaling a consumer shift towards higher-value products. Distribution channels are diversifying, with online retail experiencing significant growth alongside established hypermarkets and specialty stores. Leading companies such as L'Oréal S.A., Estée Lauder Companies Inc., and Shiseido Company Limited maintain substantial market positions through strong brand equity and broad distribution. While North America and Europe remain key markets, the Asia-Pacific region, particularly China and India, is anticipated to witness substantial growth driven by expanding middle classes and urbanization. Future growth will be sustained by emerging market development, continuous product innovation, and the escalating impact of digital marketing.
Cosmetic Products Market Company Market Share
Cosmetic Products Market: A Comprehensive Report (2019-2033)
This in-depth report provides a comprehensive analysis of the global Cosmetic Products Market, covering the period from 2019 to 2033. With a focus on market dynamics, industry trends, leading segments, and key players, this report offers actionable insights for stakeholders across the cosmetic industry. The report leverages data from the base year 2025, with estimations for 2025 and forecasts extending to 2033, incorporating the historical period of 2019-2024. This analysis is crucial for strategic decision-making, investment planning, and understanding the future trajectory of this dynamic market. Expected market value is xx Million.
Cosmetic Products Market Market Dynamics & Concentration
The global cosmetic products market is characterized by a complex interplay of factors influencing its growth and concentration. Market leaders, including L'Oréal S.A., The Estée Lauder Companies Inc., and Shiseido Company Limited, hold significant market share, driving intense competition. However, the market also exhibits a considerable presence of smaller, specialized brands, particularly in the premium segment, creating a dynamic landscape. Innovation is a key driver, with companies continually developing new products and formulations to meet evolving consumer preferences and address unmet needs. Stringent regulatory frameworks concerning product safety and labeling also shape market dynamics. The market witnesses significant M&A activity, with larger players acquiring smaller brands to expand their portfolios and gain market share. The number of M&A deals in the past five years is estimated at xx. Product substitutes, such as natural and organic cosmetics, are gaining popularity, prompting established players to adapt their strategies. Furthermore, changing consumer trends, including increasing awareness of sustainability and ethical sourcing, are reshaping the competitive landscape.
- Market Concentration: High, with a few major players dominating.
- Innovation Drivers: New product formulations, technological advancements (e.g., personalized cosmetics).
- Regulatory Frameworks: Strict regulations regarding ingredients, labeling, and safety.
- Product Substitutes: Natural and organic cosmetics, DIY beauty products.
- End-User Trends: Growing demand for personalized, sustainable, and ethically sourced products.
- M&A Activities: Frequent mergers and acquisitions driving market consolidation.
Cosmetic Products Market Industry Trends & Analysis
The cosmetic products market is experiencing robust growth, driven by several key factors. Rising disposable incomes, particularly in emerging economies, are fueling demand for premium and mass-market products. Technological advancements, such as the incorporation of advanced ingredients and innovative packaging, are enhancing product appeal. Shifting consumer preferences, notably towards natural, organic, and sustainable options, are transforming the market. The increasing use of social media and online influencers is shaping consumer perceptions and purchasing behavior. The market is witnessing a significant shift towards online retail channels, reflecting changing consumer shopping habits. The CAGR for the forecast period (2025-2033) is projected at xx%, while market penetration in key regions is expected to reach xx% by 2033. Competitive dynamics remain intense, with established players engaging in fierce rivalry, while new entrants constantly challenge the status quo.
Leading Markets & Segments in Cosmetic Products Market
The North American region currently holds a dominant position in the global cosmetic products market, followed by Europe and Asia-Pacific. Within product types, facial make-up products command the largest market share, driven by high demand for foundations, concealers, and powders. The premium category experiences higher growth rates compared to the mass category, reflecting increasing consumer willingness to spend on high-quality and luxury products. Online retail stores are experiencing significant growth as a distribution channel, surpassing traditional channels like hypermarkets and specialty stores in some regions.
Key Drivers by Segment:
- North America (Dominant Region): High disposable incomes, strong consumer preference for cosmetic products.
- Facial Make-up Products (Dominant Product Type): High demand for foundation, concealer, and powder.
- Premium Category: Rising disposable incomes and preference for luxury and high-quality products.
- Online Retail Stores: Growing e-commerce penetration and convenience for consumers.
Cosmetic Products Market Product Developments
Recent innovations in the cosmetic products market include the development of personalized cosmetics, vegan and cruelty-free products, and the use of advanced technologies such as AI-powered skincare analysis. These developments reflect the increasing consumer demand for customized solutions, ethical sourcing, and advanced functionalities. Such innovations cater to diverse needs and lifestyles, enhancing the attractiveness of cosmetic products and creating a competitive advantage for companies that embrace these technologies.
Key Drivers of Cosmetic Products Market Growth
The cosmetic products market is propelled by several key factors:
- Technological Advancements: Innovation in formulations, packaging, and application methods.
- Economic Growth: Rising disposable incomes, particularly in emerging economies.
- Regulatory Changes: Government policies promoting the growth of the cosmetic industry.
Challenges in the Cosmetic Products Market Market
The cosmetic products market faces several challenges:
- Regulatory Hurdles: Stringent regulations regarding ingredients and safety standards.
- Supply Chain Issues: Disruptions in the supply chain due to geopolitical events and pandemics.
- Competitive Pressures: Intense competition among established and emerging players.
Emerging Opportunities in Cosmetic Products Market
Significant opportunities exist for growth in the cosmetic products market:
- Technological Breakthroughs: Advancements in personalized beauty and AI-powered skincare.
- Strategic Partnerships: Collaborations between cosmetic brands and tech companies.
- Market Expansion: Growth in emerging markets with rising disposable incomes.
Leading Players in the Cosmetic Products Market Sector
- The Estée Lauder Companies Inc
- Oriflame Holding AG
- Shiseido Company Limited
- Huda Beauty
- Puig
- L'Oréal S A
- Revlon Inc
- Natura & Co
- LVMH Moët Hennessy Louis Vuitton
- JAB Cosmetics B V (Coty Inc)
Key Milestones in Cosmetic Products Market Industry
- May 2022: Estée Lauder partnered with Shoppers Stop to open an exclusive SS Beauty store in Mumbai, strengthening their Indian market presence.
- May 2022: Estée Lauder's M.A.C Cosmetics and Netflix collaborated on a limited-edition Stranger Things makeup collection, leveraging popular culture for marketing.
- May 2022: L'Oréal's Maybelline New York launched Super Stay Vinyl Ink Liquid Lip Color, expanding its lip product offerings.
Strategic Outlook for Cosmetic Products Market Market
The future of the cosmetic products market looks bright, driven by sustained consumer demand, continuous innovation, and strategic expansion into new markets. Companies that leverage technological advancements, embrace sustainable practices, and effectively engage with consumers through digital channels are poised for significant growth. The market is expected to see further consolidation through mergers and acquisitions, with a focus on expanding product portfolios and global reach.
Cosmetic Products Market Segmentation
-
1. Product Type
- 1.1. Facial Make-up Products
- 1.2. Eye Make-up Products
- 1.3. Lip Make-up Products
- 1.4. Nail Make-up Products
-
2. Category
- 2.1. Mass
- 2.2. Premium
-
3. Distribution Channel
- 3.1. Hypermarkets/Supermarkets
- 3.2. Specialty Stores
- 3.3. Online Retail Stores
- 3.4. Pharmacies and Drug Stores
- 3.5. Other Distribution Channels
Cosmetic Products Market Segmentation By Geography
-
1. North America
- 1.1. United States
- 1.2. Canada
- 1.3. Mexico
- 1.4. Rest of North America
-
2. Europe
- 2.1. United Kingdom
- 2.2. Germany
- 2.3. Spain
- 2.4. France
- 2.5. Italy
- 2.6. Russia
- 2.7. Rest of Europe
-
3. Asia Pacific
- 3.1. China
- 3.2. Japan
- 3.3. India
- 3.4. Australia
- 3.5. Rest of Asia Pacific
-
4. South America
- 4.1. Brazil
- 4.2. Argentina
- 4.3. Rest of South America
- 5. Middle East
-
6. United Arab Emirates
- 6.1. South Africa
- 6.2. Rest of Middle East
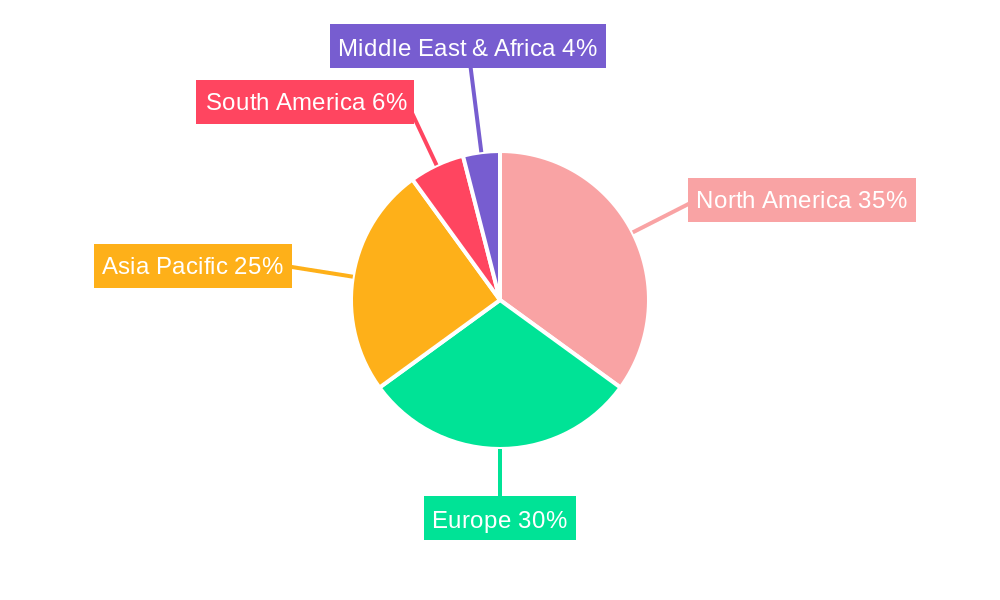
Cosmetic Products Market Regional Market Share
Geographic Coverage of Cosmetic Products Market
Cosmetic Products Market REPORT HIGHLIGHTS
| Aspects | Details |
|---|---|
| Study Period | 2020-2034 |
| Base Year | 2025 |
| Estimated Year | 2026 |
| Forecast Period | 2026-2034 |
| Historical Period | 2020-2025 |
| Growth Rate | CAGR of 6.01% from 2020-2034 |
| Segmentation |
|
Table of Contents
- 1. Introduction
- 1.1. Research Scope
- 1.2. Market Segmentation
- 1.3. Research Objective
- 1.4. Definitions and Assumptions
- 2. Executive Summary
- 2.1. Market Snapshot
- 3. Market Dynamics
- 3.1. Market Drivers
- 3.2. Market Restrains
- 3.3. Market Trends
- 3.4. Market Opportunities
- 4. Market Factor Analysis
- 4.1. Porters Five Forces
- 4.1.1. Bargaining Power of Suppliers
- 4.1.2. Bargaining Power of Buyers
- 4.1.3. Threat of New Entrants
- 4.1.4. Threat of Substitutes
- 4.1.5. Competitive Rivalry
- 4.2. PESTEL analysis
- 4.3. BCG Analysis
- 4.3.1. Stars (High Growth, High Market Share)
- 4.3.2. Cash Cows (Low Growth, High Market Share)
- 4.3.3. Question Mark (High Growth, Low Market Share)
- 4.3.4. Dogs (Low Growth, Low Market Share)
- 4.4. Ansoff Matrix Analysis
- 4.5. Supply Chain Analysis
- 4.6. Regulatory Landscape
- 4.7. Current Market Potential and Opportunity Assessment (TAM–SAM–SOM Framework)
- 4.8. MDP Analyst Note
- 4.1. Porters Five Forces
- 5. Market Analysis, Insights and Forecast 2021-2033
- 5.1. Market Analysis, Insights and Forecast - by Product Type
- 5.1.1. Facial Make-up Products
- 5.1.2. Eye Make-up Products
- 5.1.3. Lip Make-up Products
- 5.1.4. Nail Make-up Products
- 5.2. Market Analysis, Insights and Forecast - by Category
- 5.2.1. Mass
- 5.2.2. Premium
- 5.3. Market Analysis, Insights and Forecast - by Distribution Channel
- 5.3.1. Hypermarkets/Supermarkets
- 5.3.2. Specialty Stores
- 5.3.3. Online Retail Stores
- 5.3.4. Pharmacies and Drug Stores
- 5.3.5. Other Distribution Channels
- 5.4. Market Analysis, Insights and Forecast - by Region
- 5.4.1. North America
- 5.4.2. Europe
- 5.4.3. Asia Pacific
- 5.4.4. South America
- 5.4.5. Middle East
- 5.4.6. United Arab Emirates
- 5.1. Market Analysis, Insights and Forecast - by Product Type
- 6. Global Cosmetic Products Market Analysis, Insights and Forecast, 2021-2033
- 6.1. Market Analysis, Insights and Forecast - by Product Type
- 6.1.1. Facial Make-up Products
- 6.1.2. Eye Make-up Products
- 6.1.3. Lip Make-up Products
- 6.1.4. Nail Make-up Products
- 6.2. Market Analysis, Insights and Forecast - by Category
- 6.2.1. Mass
- 6.2.2. Premium
- 6.3. Market Analysis, Insights and Forecast - by Distribution Channel
- 6.3.1. Hypermarkets/Supermarkets
- 6.3.2. Specialty Stores
- 6.3.3. Online Retail Stores
- 6.3.4. Pharmacies and Drug Stores
- 6.3.5. Other Distribution Channels
- 6.1. Market Analysis, Insights and Forecast - by Product Type
- 7. North America Cosmetic Products Market Analysis, Insights and Forecast, 2020-2032
- 7.1. Market Analysis, Insights and Forecast - by Product Type
- 7.1.1. Facial Make-up Products
- 7.1.2. Eye Make-up Products
- 7.1.3. Lip Make-up Products
- 7.1.4. Nail Make-up Products
- 7.2. Market Analysis, Insights and Forecast - by Category
- 7.2.1. Mass
- 7.2.2. Premium
- 7.3. Market Analysis, Insights and Forecast - by Distribution Channel
- 7.3.1. Hypermarkets/Supermarkets
- 7.3.2. Specialty Stores
- 7.3.3. Online Retail Stores
- 7.3.4. Pharmacies and Drug Stores
- 7.3.5. Other Distribution Channels
- 7.1. Market Analysis, Insights and Forecast - by Product Type
- 8. Europe Cosmetic Products Market Analysis, Insights and Forecast, 2020-2032
- 8.1. Market Analysis, Insights and Forecast - by Product Type
- 8.1.1. Facial Make-up Products
- 8.1.2. Eye Make-up Products
- 8.1.3. Lip Make-up Products
- 8.1.4. Nail Make-up Products
- 8.2. Market Analysis, Insights and Forecast - by Category
- 8.2.1. Mass
- 8.2.2. Premium
- 8.3. Market Analysis, Insights and Forecast - by Distribution Channel
- 8.3.1. Hypermarkets/Supermarkets
- 8.3.2. Specialty Stores
- 8.3.3. Online Retail Stores
- 8.3.4. Pharmacies and Drug Stores
- 8.3.5. Other Distribution Channels
- 8.1. Market Analysis, Insights and Forecast - by Product Type
- 9. Asia Pacific Cosmetic Products Market Analysis, Insights and Forecast, 2020-2032
- 9.1. Market Analysis, Insights and Forecast - by Product Type
- 9.1.1. Facial Make-up Products
- 9.1.2. Eye Make-up Products
- 9.1.3. Lip Make-up Products
- 9.1.4. Nail Make-up Products
- 9.2. Market Analysis, Insights and Forecast - by Category
- 9.2.1. Mass
- 9.2.2. Premium
- 9.3. Market Analysis, Insights and Forecast - by Distribution Channel
- 9.3.1. Hypermarkets/Supermarkets
- 9.3.2. Specialty Stores
- 9.3.3. Online Retail Stores
- 9.3.4. Pharmacies and Drug Stores
- 9.3.5. Other Distribution Channels
- 9.1. Market Analysis, Insights and Forecast - by Product Type
- 10. South America Cosmetic Products Market Analysis, Insights and Forecast, 2020-2032
- 10.1. Market Analysis, Insights and Forecast - by Product Type
- 10.1.1. Facial Make-up Products
- 10.1.2. Eye Make-up Products
- 10.1.3. Lip Make-up Products
- 10.1.4. Nail Make-up Products
- 10.2. Market Analysis, Insights and Forecast - by Category
- 10.2.1. Mass
- 10.2.2. Premium
- 10.3. Market Analysis, Insights and Forecast - by Distribution Channel
- 10.3.1. Hypermarkets/Supermarkets
- 10.3.2. Specialty Stores
- 10.3.3. Online Retail Stores
- 10.3.4. Pharmacies and Drug Stores
- 10.3.5. Other Distribution Channels
- 10.1. Market Analysis, Insights and Forecast - by Product Type
- 11. Middle East Cosmetic Products Market Analysis, Insights and Forecast, 2020-2032
- 11.1. Market Analysis, Insights and Forecast - by Product Type
- 11.1.1. Facial Make-up Products
- 11.1.2. Eye Make-up Products
- 11.1.3. Lip Make-up Products
- 11.1.4. Nail Make-up Products
- 11.2. Market Analysis, Insights and Forecast - by Category
- 11.2.1. Mass
- 11.2.2. Premium
- 11.3. Market Analysis, Insights and Forecast - by Distribution Channel
- 11.3.1. Hypermarkets/Supermarkets
- 11.3.2. Specialty Stores
- 11.3.3. Online Retail Stores
- 11.3.4. Pharmacies and Drug Stores
- 11.3.5. Other Distribution Channels
- 11.1. Market Analysis, Insights and Forecast - by Product Type
- 12. United Arab Emirates Cosmetic Products Market Analysis, Insights and Forecast, 2020-2032
- 12.1. Market Analysis, Insights and Forecast - by Product Type
- 12.1.1. Facial Make-up Products
- 12.1.2. Eye Make-up Products
- 12.1.3. Lip Make-up Products
- 12.1.4. Nail Make-up Products
- 12.2. Market Analysis, Insights and Forecast - by Category
- 12.2.1. Mass
- 12.2.2. Premium
- 12.3. Market Analysis, Insights and Forecast - by Distribution Channel
- 12.3.1. Hypermarkets/Supermarkets
- 12.3.2. Specialty Stores
- 12.3.3. Online Retail Stores
- 12.3.4. Pharmacies and Drug Stores
- 12.3.5. Other Distribution Channels
- 12.1. Market Analysis, Insights and Forecast - by Product Type
- 13. Competitive Analysis
- 13.1. Company Profiles
- 13.1.1 The Estée Lauder Companies Inc
- 13.1.1.1. Company Overview
- 13.1.1.2. Products
- 13.1.1.3. Company Financials
- 13.1.1.4. SWOT Analysis
- 13.1.2 Oriflame Holding AG
- 13.1.2.1. Company Overview
- 13.1.2.2. Products
- 13.1.2.3. Company Financials
- 13.1.2.4. SWOT Analysis
- 13.1.3 Shiseido Company Limited
- 13.1.3.1. Company Overview
- 13.1.3.2. Products
- 13.1.3.3. Company Financials
- 13.1.3.4. SWOT Analysis
- 13.1.4 Huda Beauty
- 13.1.4.1. Company Overview
- 13.1.4.2. Products
- 13.1.4.3. Company Financials
- 13.1.4.4. SWOT Analysis
- 13.1.5 Puig *List Not Exhaustive
- 13.1.5.1. Company Overview
- 13.1.5.2. Products
- 13.1.5.3. Company Financials
- 13.1.5.4. SWOT Analysis
- 13.1.6 L'Oréal S A
- 13.1.6.1. Company Overview
- 13.1.6.2. Products
- 13.1.6.3. Company Financials
- 13.1.6.4. SWOT Analysis
- 13.1.7 Revlon Inc
- 13.1.7.1. Company Overview
- 13.1.7.2. Products
- 13.1.7.3. Company Financials
- 13.1.7.4. SWOT Analysis
- 13.1.8 Natura & Co
- 13.1.8.1. Company Overview
- 13.1.8.2. Products
- 13.1.8.3. Company Financials
- 13.1.8.4. SWOT Analysis
- 13.1.9 LVMH Moët Hennessy Louis Vuitton
- 13.1.9.1. Company Overview
- 13.1.9.2. Products
- 13.1.9.3. Company Financials
- 13.1.9.4. SWOT Analysis
- 13.1.10 JAB Cosmetics B V (Coty Inc )
- 13.1.10.1. Company Overview
- 13.1.10.2. Products
- 13.1.10.3. Company Financials
- 13.1.10.4. SWOT Analysis
- 13.1.1 The Estée Lauder Companies Inc
- 13.2. Market Entropy
- 13.2.1 Company's Key Areas Served
- 13.2.2 Recent Developments
- 13.3. Company Market Share Analysis 2025
- 13.3.1 Top 5 Companies Market Share Analysis
- 13.3.2 Top 3 Companies Market Share Analysis
- 13.4. List of Potential Customers
- 14. Research Methodology
List of Figures
- Figure 1: Global Cosmetic Products Market Revenue Breakdown (billion, %) by Region 2025 & 2033
- Figure 2: North America Cosmetic Products Market Revenue (billion), by Product Type 2025 & 2033
- Figure 3: North America Cosmetic Products Market Revenue Share (%), by Product Type 2025 & 2033
- Figure 4: North America Cosmetic Products Market Revenue (billion), by Category 2025 & 2033
- Figure 5: North America Cosmetic Products Market Revenue Share (%), by Category 2025 & 2033
- Figure 6: North America Cosmetic Products Market Revenue (billion), by Distribution Channel 2025 & 2033
- Figure 7: North America Cosmetic Products Market Revenue Share (%), by Distribution Channel 2025 & 2033
- Figure 8: North America Cosmetic Products Market Revenue (billion), by Country 2025 & 2033
- Figure 9: North America Cosmetic Products Market Revenue Share (%), by Country 2025 & 2033
- Figure 10: Europe Cosmetic Products Market Revenue (billion), by Product Type 2025 & 2033
- Figure 11: Europe Cosmetic Products Market Revenue Share (%), by Product Type 2025 & 2033
- Figure 12: Europe Cosmetic Products Market Revenue (billion), by Category 2025 & 2033
- Figure 13: Europe Cosmetic Products Market Revenue Share (%), by Category 2025 & 2033
- Figure 14: Europe Cosmetic Products Market Revenue (billion), by Distribution Channel 2025 & 2033
- Figure 15: Europe Cosmetic Products Market Revenue Share (%), by Distribution Channel 2025 & 2033
- Figure 16: Europe Cosmetic Products Market Revenue (billion), by Country 2025 & 2033
- Figure 17: Europe Cosmetic Products Market Revenue Share (%), by Country 2025 & 2033
- Figure 18: Asia Pacific Cosmetic Products Market Revenue (billion), by Product Type 2025 & 2033
- Figure 19: Asia Pacific Cosmetic Products Market Revenue Share (%), by Product Type 2025 & 2033
- Figure 20: Asia Pacific Cosmetic Products Market Revenue (billion), by Category 2025 & 2033
- Figure 21: Asia Pacific Cosmetic Products Market Revenue Share (%), by Category 2025 & 2033
- Figure 22: Asia Pacific Cosmetic Products Market Revenue (billion), by Distribution Channel 2025 & 2033
- Figure 23: Asia Pacific Cosmetic Products Market Revenue Share (%), by Distribution Channel 2025 & 2033
- Figure 24: Asia Pacific Cosmetic Products Market Revenue (billion), by Country 2025 & 2033
- Figure 25: Asia Pacific Cosmetic Products Market Revenue Share (%), by Country 2025 & 2033
- Figure 26: South America Cosmetic Products Market Revenue (billion), by Product Type 2025 & 2033
- Figure 27: South America Cosmetic Products Market Revenue Share (%), by Product Type 2025 & 2033
- Figure 28: South America Cosmetic Products Market Revenue (billion), by Category 2025 & 2033
- Figure 29: South America Cosmetic Products Market Revenue Share (%), by Category 2025 & 2033
- Figure 30: South America Cosmetic Products Market Revenue (billion), by Distribution Channel 2025 & 2033
- Figure 31: South America Cosmetic Products Market Revenue Share (%), by Distribution Channel 2025 & 2033
- Figure 32: South America Cosmetic Products Market Revenue (billion), by Country 2025 & 2033
- Figure 33: South America Cosmetic Products Market Revenue Share (%), by Country 2025 & 2033
- Figure 34: Middle East Cosmetic Products Market Revenue (billion), by Product Type 2025 & 2033
- Figure 35: Middle East Cosmetic Products Market Revenue Share (%), by Product Type 2025 & 2033
- Figure 36: Middle East Cosmetic Products Market Revenue (billion), by Category 2025 & 2033
- Figure 37: Middle East Cosmetic Products Market Revenue Share (%), by Category 2025 & 2033
- Figure 38: Middle East Cosmetic Products Market Revenue (billion), by Distribution Channel 2025 & 2033
- Figure 39: Middle East Cosmetic Products Market Revenue Share (%), by Distribution Channel 2025 & 2033
- Figure 40: Middle East Cosmetic Products Market Revenue (billion), by Country 2025 & 2033
- Figure 41: Middle East Cosmetic Products Market Revenue Share (%), by Country 2025 & 2033
- Figure 42: United Arab Emirates Cosmetic Products Market Revenue (billion), by Product Type 2025 & 2033
- Figure 43: United Arab Emirates Cosmetic Products Market Revenue Share (%), by Product Type 2025 & 2033
- Figure 44: United Arab Emirates Cosmetic Products Market Revenue (billion), by Category 2025 & 2033
- Figure 45: United Arab Emirates Cosmetic Products Market Revenue Share (%), by Category 2025 & 2033
- Figure 46: United Arab Emirates Cosmetic Products Market Revenue (billion), by Distribution Channel 2025 & 2033
- Figure 47: United Arab Emirates Cosmetic Products Market Revenue Share (%), by Distribution Channel 2025 & 2033
- Figure 48: United Arab Emirates Cosmetic Products Market Revenue (billion), by Country 2025 & 2033
- Figure 49: United Arab Emirates Cosmetic Products Market Revenue Share (%), by Country 2025 & 2033
List of Tables
- Table 1: Global Cosmetic Products Market Revenue billion Forecast, by Product Type 2020 & 2033
- Table 2: Global Cosmetic Products Market Revenue billion Forecast, by Category 2020 & 2033
- Table 3: Global Cosmetic Products Market Revenue billion Forecast, by Distribution Channel 2020 & 2033
- Table 4: Global Cosmetic Products Market Revenue billion Forecast, by Region 2020 & 2033
- Table 5: Global Cosmetic Products Market Revenue billion Forecast, by Product Type 2020 & 2033
- Table 6: Global Cosmetic Products Market Revenue billion Forecast, by Category 2020 & 2033
- Table 7: Global Cosmetic Products Market Revenue billion Forecast, by Distribution Channel 2020 & 2033
- Table 8: Global Cosmetic Products Market Revenue billion Forecast, by Country 2020 & 2033
- Table 9: United States Cosmetic Products Market Revenue (billion) Forecast, by Application 2020 & 2033
- Table 10: Canada Cosmetic Products Market Revenue (billion) Forecast, by Application 2020 & 2033
- Table 11: Mexico Cosmetic Products Market Revenue (billion) Forecast, by Application 2020 & 2033
- Table 12: Rest of North America Cosmetic Products Market Revenue (billion) Forecast, by Application 2020 & 2033
- Table 13: Global Cosmetic Products Market Revenue billion Forecast, by Product Type 2020 & 2033
- Table 14: Global Cosmetic Products Market Revenue billion Forecast, by Category 2020 & 2033
- Table 15: Global Cosmetic Products Market Revenue billion Forecast, by Distribution Channel 2020 & 2033
- Table 16: Global Cosmetic Products Market Revenue billion Forecast, by Country 2020 & 2033
- Table 17: United Kingdom Cosmetic Products Market Revenue (billion) Forecast, by Application 2020 & 2033
- Table 18: Germany Cosmetic Products Market Revenue (billion) Forecast, by Application 2020 & 2033
- Table 19: Spain Cosmetic Products Market Revenue (billion) Forecast, by Application 2020 & 2033
- Table 20: France Cosmetic Products Market Revenue (billion) Forecast, by Application 2020 & 2033
- Table 21: Italy Cosmetic Products Market Revenue (billion) Forecast, by Application 2020 & 2033
- Table 22: Russia Cosmetic Products Market Revenue (billion) Forecast, by Application 2020 & 2033
- Table 23: Rest of Europe Cosmetic Products Market Revenue (billion) Forecast, by Application 2020 & 2033
- Table 24: Global Cosmetic Products Market Revenue billion Forecast, by Product Type 2020 & 2033
- Table 25: Global Cosmetic Products Market Revenue billion Forecast, by Category 2020 & 2033
- Table 26: Global Cosmetic Products Market Revenue billion Forecast, by Distribution Channel 2020 & 2033
- Table 27: Global Cosmetic Products Market Revenue billion Forecast, by Country 2020 & 2033
- Table 28: China Cosmetic Products Market Revenue (billion) Forecast, by Application 2020 & 2033
- Table 29: Japan Cosmetic Products Market Revenue (billion) Forecast, by Application 2020 & 2033
- Table 30: India Cosmetic Products Market Revenue (billion) Forecast, by Application 2020 & 2033
- Table 31: Australia Cosmetic Products Market Revenue (billion) Forecast, by Application 2020 & 2033
- Table 32: Rest of Asia Pacific Cosmetic Products Market Revenue (billion) Forecast, by Application 2020 & 2033
- Table 33: Global Cosmetic Products Market Revenue billion Forecast, by Product Type 2020 & 2033
- Table 34: Global Cosmetic Products Market Revenue billion Forecast, by Category 2020 & 2033
- Table 35: Global Cosmetic Products Market Revenue billion Forecast, by Distribution Channel 2020 & 2033
- Table 36: Global Cosmetic Products Market Revenue billion Forecast, by Country 2020 & 2033
- Table 37: Brazil Cosmetic Products Market Revenue (billion) Forecast, by Application 2020 & 2033
- Table 38: Argentina Cosmetic Products Market Revenue (billion) Forecast, by Application 2020 & 2033
- Table 39: Rest of South America Cosmetic Products Market Revenue (billion) Forecast, by Application 2020 & 2033
- Table 40: Global Cosmetic Products Market Revenue billion Forecast, by Product Type 2020 & 2033
- Table 41: Global Cosmetic Products Market Revenue billion Forecast, by Category 2020 & 2033
- Table 42: Global Cosmetic Products Market Revenue billion Forecast, by Distribution Channel 2020 & 2033
- Table 43: Global Cosmetic Products Market Revenue billion Forecast, by Country 2020 & 2033
- Table 44: Global Cosmetic Products Market Revenue billion Forecast, by Product Type 2020 & 2033
- Table 45: Global Cosmetic Products Market Revenue billion Forecast, by Category 2020 & 2033
- Table 46: Global Cosmetic Products Market Revenue billion Forecast, by Distribution Channel 2020 & 2033
- Table 47: Global Cosmetic Products Market Revenue billion Forecast, by Country 2020 & 2033
- Table 48: South Africa Cosmetic Products Market Revenue (billion) Forecast, by Application 2020 & 2033
- Table 49: Rest of Middle East Cosmetic Products Market Revenue (billion) Forecast, by Application 2020 & 2033
Frequently Asked Questions
1. What is the projected Compound Annual Growth Rate (CAGR) of the Cosmetic Products Market?
The projected CAGR is approximately 6.01%.
2. Which companies are prominent players in the Cosmetic Products Market?
Key companies in the market include The Estée Lauder Companies Inc, Oriflame Holding AG, Shiseido Company Limited, Huda Beauty, Puig *List Not Exhaustive, L'Oréal S A, Revlon Inc, Natura & Co, LVMH Moët Hennessy Louis Vuitton, JAB Cosmetics B V (Coty Inc ).
3. What are the main segments of the Cosmetic Products Market?
The market segments include Product Type, Category, Distribution Channel.
4. Can you provide details about the market size?
The market size is estimated to be USD 67.54 billion as of 2022.
5. What are some drivers contributing to market growth?
Sustainable Fashion Trend; Strategic Expansion With Respect To E-commerce Subscription.
6. What are the notable trends driving market growth?
Inclination Toward Organic. Vegan and Cruelty-Free Cosmetic Products.
7. Are there any restraints impacting market growth?
High Cost of Rented Apparel Maintenance.
8. Can you provide examples of recent developments in the market?
May 2022: Estée Lauder with Shoppers Stop opened an exclusive SS Beauty store in Mumbai. With this establishment, the two companies have strengthened their partnership in India. The SS beauty store will offer only Estée Lauder brands like MAC Cosmetics, Clinique, Bobbi Brown, Jo Malone, Estee Lauder, Smashbox, and Tom Ford.
9. What pricing options are available for accessing the report?
Pricing options include single-user, multi-user, and enterprise licenses priced at USD 4750, USD 5250, and USD 8750 respectively.
10. Is the market size provided in terms of value or volume?
The market size is provided in terms of value, measured in billion.
11. Are there any specific market keywords associated with the report?
Yes, the market keyword associated with the report is "Cosmetic Products Market," which aids in identifying and referencing the specific market segment covered.
12. How do I determine which pricing option suits my needs best?
The pricing options vary based on user requirements and access needs. Individual users may opt for single-user licenses, while businesses requiring broader access may choose multi-user or enterprise licenses for cost-effective access to the report.
13. Are there any additional resources or data provided in the Cosmetic Products Market report?
While the report offers comprehensive insights, it's advisable to review the specific contents or supplementary materials provided to ascertain if additional resources or data are available.
14. How can I stay updated on further developments or reports in the Cosmetic Products Market?
To stay informed about further developments, trends, and reports in the Cosmetic Products Market, consider subscribing to industry newsletters, following relevant companies and organizations, or regularly checking reputable industry news sources and publications.
Methodology
Step 1 - Identification of Relevant Samples Size from Population Database


Step 2 - Approaches for Defining Global Market Size (Value, Volume* & Price*)

Note*: In applicable scenarios
Step 3 - Data Sources
Primary Research
- Web Analytics
- Survey Reports
- Research Institute
- Latest Research Reports
- Opinion Leaders
Secondary Research
- Annual Reports
- White Paper
- Latest Press Release
- Industry Association
- Paid Database
- Investor Presentations

Step 4 - Data Triangulation
Involves using different sources of information in order to increase the validity of a study
These sources are likely to be stakeholders in a program - participants, other researchers, program staff, other community members, and so on.
Then we put all data in single framework & apply various statistical tools to find out the dynamic on the market.
During the analysis stage, feedback from the stakeholder groups would be compared to determine areas of agreement as well as areas of divergence