

Key Insights
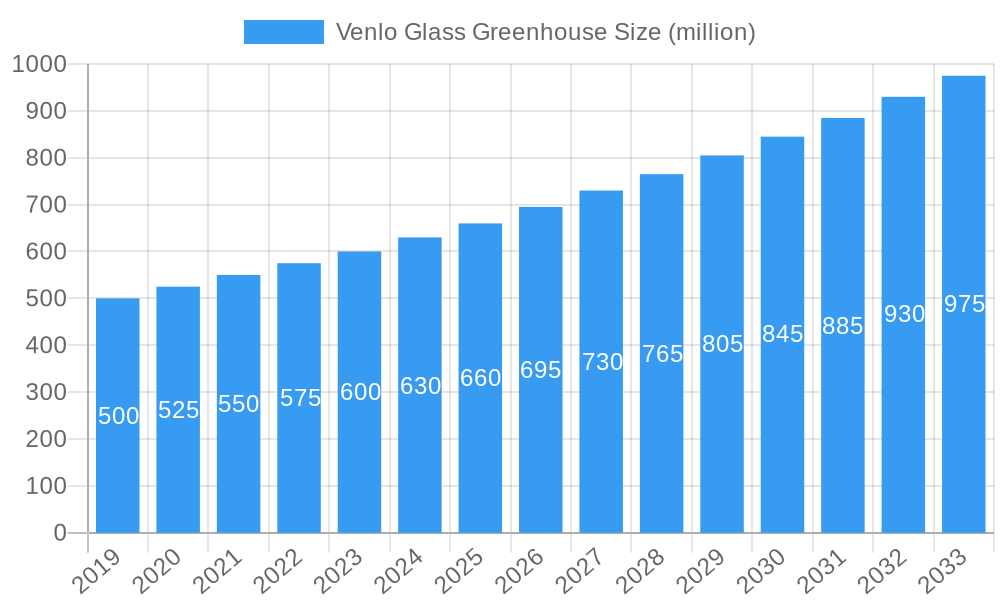
The Venlo Glass Greenhouse market is projected to expand significantly, reaching an estimated market size of $1.1 billion by 2025 and exhibiting a Compound Annual Growth Rate (CAGR) of 4.9% from 2025 to 2033. This growth is primarily attributed to the escalating global demand for premium, year-round produce, driven by population increases and a heightened focus on healthy diets. The inherent adaptability of Venlo greenhouses, with their characteristic multi-span, gutter-connected architecture, facilitates the cultivation of diverse crops, including fruits, vegetables, and flowers, fostering their broad adoption across agricultural sectors. Innovations in climate control, irrigation, and automation systems further boost efficiency and output, positioning Venlo greenhouses as a compelling investment for commercial growers aiming to optimize production and profitability. The increasing emphasis on Controlled Environment Agriculture (CEA) for food security and sustainable farming will continue to fuel market expansion.
Venlo Glass Greenhouse Market Size (In Billion)
Key growth catalysts include the imperative for enhanced crop yields and quality, particularly in regions with adverse climatic conditions. Venlo glass greenhouses provide superior light transmission and thermal insulation, enabling extended growing seasons and reduced energy expenditure. Emerging trends such as vertical farming integration, advanced LED lighting adoption, and smart greenhouse technologies are enhancing the value proposition of Venlo structures. Conversely, significant initial capital investment and operational expenses present market restraints. Price volatility in raw materials like glass and steel can also affect profitability. Nevertheless, the sustained advantages of increased productivity, minimized pest and disease risks, and localized produce cultivation near urban centers are anticipated to outweigh these challenges, ensuring a dynamic and evolving market.
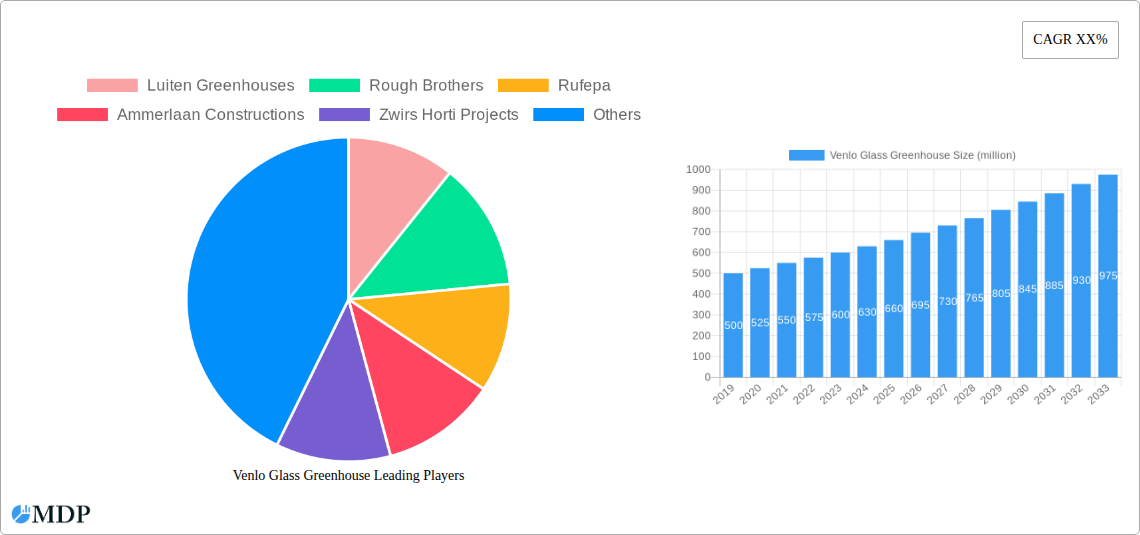
Venlo Glass Greenhouse Company Market Share
Venlo Glass Greenhouse Market: Comprehensive Analysis & Forecast (2019-2033)
This in-depth report provides a detailed examination of the global Venlo Glass Greenhouse market, offering critical insights into market dynamics, trends, competitive landscape, and future growth opportunities. With a study period spanning from 2019 to 2033, including a base year of 2025, and a forecast period from 2025 to 2033, this analysis is crucial for stakeholders seeking to navigate and capitalize on the evolving horticultural infrastructure sector. We delve into market concentration, innovation drivers, regulatory frameworks, product substitutes, end-user preferences, and M&A activities, providing actionable intelligence for strategic decision-making.
Venlo Glass Greenhouse Market Dynamics & Concentration
The Venlo Glass Greenhouse market exhibits a moderate to high concentration, with a significant portion of market share held by a few key players. This concentration is driven by the substantial capital investment required for manufacturing and installation, as well as the established reputation and extensive distribution networks of leading companies. Innovation plays a pivotal role in shaping market dynamics, with continuous advancements in greenhouse design, climate control systems, and integrated technologies like smart sensors and automation. Regulatory frameworks, including building codes, environmental regulations, and agricultural support policies, significantly influence market entry and operational efficiency. Product substitutes, such as polytunnel greenhouses and other protected cropping systems, present a competitive challenge, though Venlo glass structures offer superior durability, light transmission, and climate control capabilities, particularly for high-value crops. End-user trends are increasingly leaning towards sustainable agriculture, controlled environment agriculture (CEA), and year-round production of fruits, vegetables, and flowers, fueling demand for advanced Venlo glass solutions. Mergers and acquisitions (M&A) activities, while not extensive, are observed as companies seek to expand their product portfolios, gain market access, and enhance their technological capabilities. For instance, an estimated 5-10 significant M&A deals occur annually, primarily involving acquisitions of smaller technology providers or regional distributors by larger greenhouse manufacturers.
Venlo Glass Greenhouse Industry Trends & Analysis
The Venlo Glass Greenhouse industry is poised for robust growth, driven by an escalating global demand for fresh, locally sourced produce and the imperative for resilient food systems. The market is experiencing a Compound Annual Growth Rate (CAGR) of approximately 6.5% during the forecast period. Technological disruptions are at the forefront, with the integration of IoT (Internet of Things) sensors, artificial intelligence (AI) for predictive analytics, and advanced automation systems revolutionizing greenhouse management. These innovations optimize resource utilization, minimize crop loss, and enhance overall yield. Consumer preferences for pesticide-free, high-quality fruits, vegetables, and flowers are compelling growers to invest in controlled environments that Venlo glass greenhouses provide. The competitive dynamics are characterized by a focus on innovation, sustainability, and cost-effectiveness. Companies are differentiating themselves through energy-efficient designs, modular construction, and customized solutions catering to specific crop requirements and local climatic conditions. Market penetration is steadily increasing, particularly in regions with favorable government policies supporting agricultural modernization and food security initiatives. The increasing adoption of vertical farming and advanced horticultural practices further propels the demand for sophisticated greenhouse structures. The market is projected to reach a valuation of over $50 million by 2025 and is expected to exceed $100 million by 2033, indicating substantial expansion potential.
Leading Markets & Segments in Venlo Glass Greenhouse
The Venlo Glass Greenhouse market is segmented by Application and Type, with specific regions and countries demonstrating dominant growth.
Dominant Regions and Countries:
- Europe: This region holds a significant market share due to established horticultural practices, strong government support for sustainable agriculture, and a high consumer demand for premium produce. Countries like the Netherlands, Belgium, and Germany are at the forefront of Venlo glass greenhouse adoption.
- Key Drivers: Favorable economic policies promoting agricultural innovation, robust infrastructure for greenhouse manufacturing and distribution, and a mature market for high-value crops like tomatoes, cucumbers, and ornamental flowers.
- North America: The United States and Canada are witnessing substantial growth driven by increasing investments in controlled environment agriculture and a growing consumer base seeking locally grown produce year-round.
- Key Drivers: Growing awareness of food miles and carbon footprints, advancements in hydroponic and aeroponic systems integrated with Venlo glass greenhouses, and rising disposable incomes influencing demand for premium produce.
- Asia-Pacific: While a nascent market, this region presents immense growth potential owing to rapid urbanization, increasing population, and government initiatives aimed at improving food security and agricultural productivity.
Dominant Segments:
- Application: Vegetable: This segment leads the market, driven by the consistent global demand for vegetables like tomatoes, cucumbers, peppers, and leafy greens, which benefit significantly from the controlled environment offered by Venlo glass greenhouses.
- Key Drivers: Year-round cultivation possibilities, improved yield and quality, reduced risk of crop damage from adverse weather, and suitability for advanced hydroponic systems.
- Application: Fruit: Growing demand for high-quality, out-of-season fruits, such as berries and certain types of grapes, is contributing to the expansion of this segment.
- Key Drivers: Extended growing seasons, protection from pests and diseases, and the ability to cultivate premium fruit varieties.
- Types: Large: Large-scale Venlo glass greenhouses are dominating the market, catering to commercial growers and large agricultural enterprises focused on maximizing production efficiency and economies of scale.
- Key Drivers: Cost-effectiveness in large-scale operations, optimized space utilization, and the integration of advanced automation and climate control systems.
- Types: Medium: Medium-sized structures are also experiencing steady growth, serving a mix of commercial growers and research institutions.
Venlo Glass Greenhouse Product Developments
Product developments in the Venlo Glass Greenhouse sector are focused on enhancing energy efficiency, structural integrity, and integrated technological solutions. Innovations include advanced glazing materials with improved light transmission and insulation properties, automated ventilation and shading systems, and smart irrigation and nutrient delivery networks. Companies are also developing modular designs for easier installation and scalability, as well as incorporating renewable energy sources to minimize operational costs and environmental impact. These developments are driven by the need for greater control over growing conditions, reduced resource consumption, and improved crop yields, providing significant competitive advantages.
Key Drivers of Venlo Glass Greenhouse Growth
The Venlo Glass Greenhouse market is propelled by several key growth drivers. Technologically, the integration of automation, AI, and IoT sensors enables precise environmental control, optimizing crop yields and resource efficiency. Economically, the increasing demand for year-round, high-quality produce, coupled with growing concerns about food security and the limitations of traditional agriculture, is driving investments. Regulatory factors, such as government incentives for modern agriculture and sustainable farming practices, further support market expansion. For instance, subsidies for adopting advanced horticultural technologies and supportive policies for controlled environment agriculture are crucial catalysts.
Challenges in the Venlo Glass Greenhouse Market
Despite its growth potential, the Venlo Glass Greenhouse market faces several challenges. High initial investment costs for construction and technology implementation can be a barrier for smaller growers. Fluctuations in raw material prices, particularly for glass and steel, can impact manufacturing costs and, consequently, greenhouse prices. Stringent regulatory hurdles related to land use, building permits, and environmental impact assessments can also cause delays and increase project expenses. Furthermore, the availability of skilled labor for installation and maintenance, as well as competition from lower-cost alternative greenhouse structures, pose ongoing challenges to market expansion.
Emerging Opportunities in Venlo Glass Greenhouse
Emerging opportunities in the Venlo Glass Greenhouse market are significant and diverse. The growing adoption of vertical farming and urban agriculture presents a substantial market for specialized Venlo glass structures optimized for these environments. Technological breakthroughs in energy-efficient designs, such as advanced insulation materials and integrated solar power systems, offer cost-saving potential and appeal to sustainability-conscious growers. Strategic partnerships between greenhouse manufacturers and technology providers, as well as collaborations with research institutions, are fostering innovation and the development of tailored solutions. Market expansion into developing economies with increasing food demands and government support for agricultural modernization represents another key opportunity.
Leading Players in the Venlo Glass Greenhouse Sector
- Luiten Greenhouses
- Rough Brothers
- Rufepa
- Ammerlaan Constructions
- Zwirs Horti Projects
- Nobutec
- Ludy Greenhouse
- GGS Structures
- Smiemans Projecten
- Cravo
- Sunmax Greenhouse
- Idroterm Serre
- Richel Group
Key Milestones in Venlo Glass Greenhouse Industry
- 2019: Increased focus on smart greenhouse technologies and IoT integration, leading to enhanced data-driven crop management.
- 2020: Growing demand for sustainable and energy-efficient greenhouse designs in response to climate change concerns.
- 2021: Expansion of Venlo glass greenhouses for fruit cultivation, particularly berries and specialty fruits, driven by premium market demand.
- 2022: Rise in M&A activities as larger players acquire smaller innovators to strengthen their technological capabilities and market reach.
- 2023: Significant advancements in modular greenhouse construction, enabling faster installation and greater scalability for commercial operations.
- 2024: Increased adoption of advanced climate control systems, including AI-powered predictive analytics for optimized growing conditions.
- 2025 (Base Year): Established market dominance of large-scale Venlo glass greenhouses for vegetable production.
- 2026-2033 (Forecast Period): Continued innovation in energy efficiency, automation, and integrated farming systems, driving sustained market growth.
Strategic Outlook for Venlo Glass Greenhouse Market
The strategic outlook for the Venlo Glass Greenhouse market is exceptionally positive, driven by an increasing global imperative for food security and sustainable agricultural practices. Growth accelerators include the continued integration of advanced technologies like AI and IoT for hyper-efficient crop management, leading to higher yields and reduced resource consumption. Strategic partnerships between greenhouse manufacturers, technology providers, and agricultural research institutions will foster innovation and the development of customized solutions for diverse climatic conditions and crop types. Market expansion into emerging economies, coupled with favorable government policies promoting controlled environment agriculture, presents substantial long-term growth potential. The focus on energy-efficient designs and the integration of renewable energy sources will further enhance the market's attractiveness and environmental credentials.
Venlo Glass Greenhouse Segmentation
-
1. Application
- 1.1. Fruit
- 1.2. Vegetable
- 1.3. Flower
- 1.4. Others
-
2. Types
- 2.1. Small
- 2.2. Medium
- 2.3. Large
Venlo Glass Greenhouse Segmentation By Geography
-
1. North America
- 1.1. United States
- 1.2. Canada
- 1.3. Mexico
-
2. South America
- 2.1. Brazil
- 2.2. Argentina
- 2.3. Rest of South America
-
3. Europe
- 3.1. United Kingdom
- 3.2. Germany
- 3.3. France
- 3.4. Italy
- 3.5. Spain
- 3.6. Russia
- 3.7. Benelux
- 3.8. Nordics
- 3.9. Rest of Europe
-
4. Middle East & Africa
- 4.1. Turkey
- 4.2. Israel
- 4.3. GCC
- 4.4. North Africa
- 4.5. South Africa
- 4.6. Rest of Middle East & Africa
-
5. Asia Pacific
- 5.1. China
- 5.2. India
- 5.3. Japan
- 5.4. South Korea
- 5.5. ASEAN
- 5.6. Oceania
- 5.7. Rest of Asia Pacific
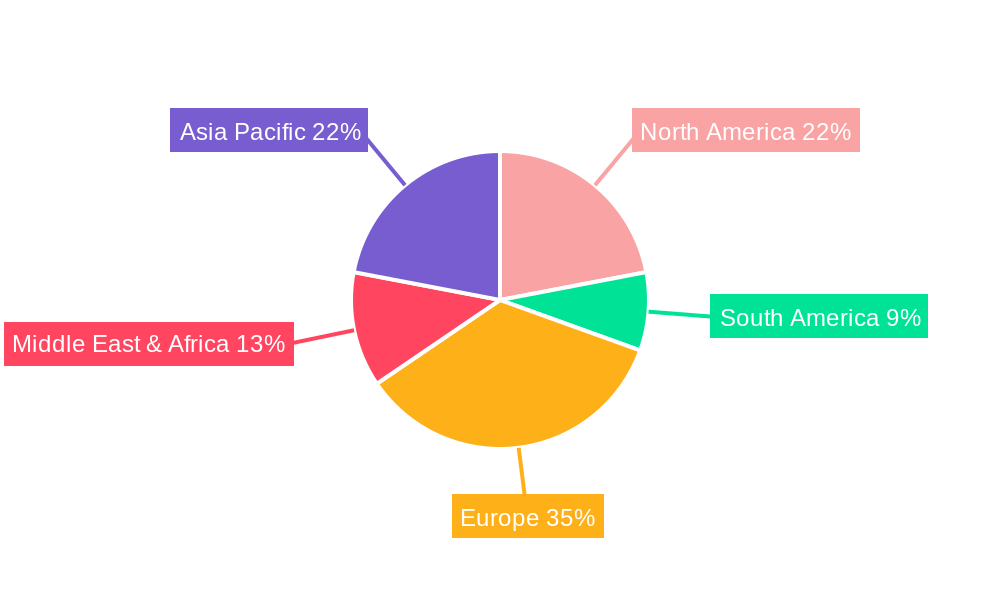
Venlo Glass Greenhouse Regional Market Share
Geographic Coverage of Venlo Glass Greenhouse
Venlo Glass Greenhouse REPORT HIGHLIGHTS
| Aspects | Details |
|---|---|
| Study Period | 2020-2034 |
| Base Year | 2025 |
| Estimated Year | 2026 |
| Forecast Period | 2026-2034 |
| Historical Period | 2020-2025 |
| Growth Rate | CAGR of 4.9% from 2020-2034 |
| Segmentation |
|
Table of Contents
- 1. Introduction
- 1.1. Research Scope
- 1.2. Market Segmentation
- 1.3. Research Methodology
- 1.4. Definitions and Assumptions
- 2. Executive Summary
- 2.1. Introduction
- 3. Market Dynamics
- 3.1. Introduction
- 3.2. Market Drivers
- 3.3. Market Restrains
- 3.4. Market Trends
- 4. Market Factor Analysis
- 4.1. Porters Five Forces
- 4.2. Supply/Value Chain
- 4.3. PESTEL analysis
- 4.4. Market Entropy
- 4.5. Patent/Trademark Analysis
- 5. Global Venlo Glass Greenhouse Analysis, Insights and Forecast, 2020-2032
- 5.1. Market Analysis, Insights and Forecast - by Application
- 5.1.1. Fruit
- 5.1.2. Vegetable
- 5.1.3. Flower
- 5.1.4. Others
- 5.2. Market Analysis, Insights and Forecast - by Types
- 5.2.1. Small
- 5.2.2. Medium
- 5.2.3. Large
- 5.3. Market Analysis, Insights and Forecast - by Region
- 5.3.1. North America
- 5.3.2. South America
- 5.3.3. Europe
- 5.3.4. Middle East & Africa
- 5.3.5. Asia Pacific
- 5.1. Market Analysis, Insights and Forecast - by Application
- 6. North America Venlo Glass Greenhouse Analysis, Insights and Forecast, 2020-2032
- 6.1. Market Analysis, Insights and Forecast - by Application
- 6.1.1. Fruit
- 6.1.2. Vegetable
- 6.1.3. Flower
- 6.1.4. Others
- 6.2. Market Analysis, Insights and Forecast - by Types
- 6.2.1. Small
- 6.2.2. Medium
- 6.2.3. Large
- 6.1. Market Analysis, Insights and Forecast - by Application
- 7. South America Venlo Glass Greenhouse Analysis, Insights and Forecast, 2020-2032
- 7.1. Market Analysis, Insights and Forecast - by Application
- 7.1.1. Fruit
- 7.1.2. Vegetable
- 7.1.3. Flower
- 7.1.4. Others
- 7.2. Market Analysis, Insights and Forecast - by Types
- 7.2.1. Small
- 7.2.2. Medium
- 7.2.3. Large
- 7.1. Market Analysis, Insights and Forecast - by Application
- 8. Europe Venlo Glass Greenhouse Analysis, Insights and Forecast, 2020-2032
- 8.1. Market Analysis, Insights and Forecast - by Application
- 8.1.1. Fruit
- 8.1.2. Vegetable
- 8.1.3. Flower
- 8.1.4. Others
- 8.2. Market Analysis, Insights and Forecast - by Types
- 8.2.1. Small
- 8.2.2. Medium
- 8.2.3. Large
- 8.1. Market Analysis, Insights and Forecast - by Application
- 9. Middle East & Africa Venlo Glass Greenhouse Analysis, Insights and Forecast, 2020-2032
- 9.1. Market Analysis, Insights and Forecast - by Application
- 9.1.1. Fruit
- 9.1.2. Vegetable
- 9.1.3. Flower
- 9.1.4. Others
- 9.2. Market Analysis, Insights and Forecast - by Types
- 9.2.1. Small
- 9.2.2. Medium
- 9.2.3. Large
- 9.1. Market Analysis, Insights and Forecast - by Application
- 10. Asia Pacific Venlo Glass Greenhouse Analysis, Insights and Forecast, 2020-2032
- 10.1. Market Analysis, Insights and Forecast - by Application
- 10.1.1. Fruit
- 10.1.2. Vegetable
- 10.1.3. Flower
- 10.1.4. Others
- 10.2. Market Analysis, Insights and Forecast - by Types
- 10.2.1. Small
- 10.2.2. Medium
- 10.2.3. Large
- 10.1. Market Analysis, Insights and Forecast - by Application
- 11. Competitive Analysis
- 11.1. Global Market Share Analysis 2025
- 11.2. Company Profiles
- 11.2.1 Luiten Greenhouses
- 11.2.1.1. Overview
- 11.2.1.2. Products
- 11.2.1.3. SWOT Analysis
- 11.2.1.4. Recent Developments
- 11.2.1.5. Financials (Based on Availability)
- 11.2.2 Rough Brothers
- 11.2.2.1. Overview
- 11.2.2.2. Products
- 11.2.2.3. SWOT Analysis
- 11.2.2.4. Recent Developments
- 11.2.2.5. Financials (Based on Availability)
- 11.2.3 Rufepa
- 11.2.3.1. Overview
- 11.2.3.2. Products
- 11.2.3.3. SWOT Analysis
- 11.2.3.4. Recent Developments
- 11.2.3.5. Financials (Based on Availability)
- 11.2.4 Ammerlaan Constructions
- 11.2.4.1. Overview
- 11.2.4.2. Products
- 11.2.4.3. SWOT Analysis
- 11.2.4.4. Recent Developments
- 11.2.4.5. Financials (Based on Availability)
- 11.2.5 Zwirs Horti Projects
- 11.2.5.1. Overview
- 11.2.5.2. Products
- 11.2.5.3. SWOT Analysis
- 11.2.5.4. Recent Developments
- 11.2.5.5. Financials (Based on Availability)
- 11.2.6 Nobutec
- 11.2.6.1. Overview
- 11.2.6.2. Products
- 11.2.6.3. SWOT Analysis
- 11.2.6.4. Recent Developments
- 11.2.6.5. Financials (Based on Availability)
- 11.2.7 Ludy Greenhouse
- 11.2.7.1. Overview
- 11.2.7.2. Products
- 11.2.7.3. SWOT Analysis
- 11.2.7.4. Recent Developments
- 11.2.7.5. Financials (Based on Availability)
- 11.2.8 GGS Structures
- 11.2.8.1. Overview
- 11.2.8.2. Products
- 11.2.8.3. SWOT Analysis
- 11.2.8.4. Recent Developments
- 11.2.8.5. Financials (Based on Availability)
- 11.2.9 Smiemans Projecten
- 11.2.9.1. Overview
- 11.2.9.2. Products
- 11.2.9.3. SWOT Analysis
- 11.2.9.4. Recent Developments
- 11.2.9.5. Financials (Based on Availability)
- 11.2.10 Cravo
- 11.2.10.1. Overview
- 11.2.10.2. Products
- 11.2.10.3. SWOT Analysis
- 11.2.10.4. Recent Developments
- 11.2.10.5. Financials (Based on Availability)
- 11.2.11 Sunmax Greenhouse
- 11.2.11.1. Overview
- 11.2.11.2. Products
- 11.2.11.3. SWOT Analysis
- 11.2.11.4. Recent Developments
- 11.2.11.5. Financials (Based on Availability)
- 11.2.12 Idroterm Serre
- 11.2.12.1. Overview
- 11.2.12.2. Products
- 11.2.12.3. SWOT Analysis
- 11.2.12.4. Recent Developments
- 11.2.12.5. Financials (Based on Availability)
- 11.2.13 Richel Group
- 11.2.13.1. Overview
- 11.2.13.2. Products
- 11.2.13.3. SWOT Analysis
- 11.2.13.4. Recent Developments
- 11.2.13.5. Financials (Based on Availability)
- 11.2.1 Luiten Greenhouses
List of Figures
- Figure 1: Global Venlo Glass Greenhouse Revenue Breakdown (billion, %) by Region 2025 & 2033
- Figure 2: North America Venlo Glass Greenhouse Revenue (billion), by Application 2025 & 2033
- Figure 3: North America Venlo Glass Greenhouse Revenue Share (%), by Application 2025 & 2033
- Figure 4: North America Venlo Glass Greenhouse Revenue (billion), by Types 2025 & 2033
- Figure 5: North America Venlo Glass Greenhouse Revenue Share (%), by Types 2025 & 2033
- Figure 6: North America Venlo Glass Greenhouse Revenue (billion), by Country 2025 & 2033
- Figure 7: North America Venlo Glass Greenhouse Revenue Share (%), by Country 2025 & 2033
- Figure 8: South America Venlo Glass Greenhouse Revenue (billion), by Application 2025 & 2033
- Figure 9: South America Venlo Glass Greenhouse Revenue Share (%), by Application 2025 & 2033
- Figure 10: South America Venlo Glass Greenhouse Revenue (billion), by Types 2025 & 2033
- Figure 11: South America Venlo Glass Greenhouse Revenue Share (%), by Types 2025 & 2033
- Figure 12: South America Venlo Glass Greenhouse Revenue (billion), by Country 2025 & 2033
- Figure 13: South America Venlo Glass Greenhouse Revenue Share (%), by Country 2025 & 2033
- Figure 14: Europe Venlo Glass Greenhouse Revenue (billion), by Application 2025 & 2033
- Figure 15: Europe Venlo Glass Greenhouse Revenue Share (%), by Application 2025 & 2033
- Figure 16: Europe Venlo Glass Greenhouse Revenue (billion), by Types 2025 & 2033
- Figure 17: Europe Venlo Glass Greenhouse Revenue Share (%), by Types 2025 & 2033
- Figure 18: Europe Venlo Glass Greenhouse Revenue (billion), by Country 2025 & 2033
- Figure 19: Europe Venlo Glass Greenhouse Revenue Share (%), by Country 2025 & 2033
- Figure 20: Middle East & Africa Venlo Glass Greenhouse Revenue (billion), by Application 2025 & 2033
- Figure 21: Middle East & Africa Venlo Glass Greenhouse Revenue Share (%), by Application 2025 & 2033
- Figure 22: Middle East & Africa Venlo Glass Greenhouse Revenue (billion), by Types 2025 & 2033
- Figure 23: Middle East & Africa Venlo Glass Greenhouse Revenue Share (%), by Types 2025 & 2033
- Figure 24: Middle East & Africa Venlo Glass Greenhouse Revenue (billion), by Country 2025 & 2033
- Figure 25: Middle East & Africa Venlo Glass Greenhouse Revenue Share (%), by Country 2025 & 2033
- Figure 26: Asia Pacific Venlo Glass Greenhouse Revenue (billion), by Application 2025 & 2033
- Figure 27: Asia Pacific Venlo Glass Greenhouse Revenue Share (%), by Application 2025 & 2033
- Figure 28: Asia Pacific Venlo Glass Greenhouse Revenue (billion), by Types 2025 & 2033
- Figure 29: Asia Pacific Venlo Glass Greenhouse Revenue Share (%), by Types 2025 & 2033
- Figure 30: Asia Pacific Venlo Glass Greenhouse Revenue (billion), by Country 2025 & 2033
- Figure 31: Asia Pacific Venlo Glass Greenhouse Revenue Share (%), by Country 2025 & 2033
List of Tables
- Table 1: Global Venlo Glass Greenhouse Revenue billion Forecast, by Application 2020 & 2033
- Table 2: Global Venlo Glass Greenhouse Revenue billion Forecast, by Types 2020 & 2033
- Table 3: Global Venlo Glass Greenhouse Revenue billion Forecast, by Region 2020 & 2033
- Table 4: Global Venlo Glass Greenhouse Revenue billion Forecast, by Application 2020 & 2033
- Table 5: Global Venlo Glass Greenhouse Revenue billion Forecast, by Types 2020 & 2033
- Table 6: Global Venlo Glass Greenhouse Revenue billion Forecast, by Country 2020 & 2033
- Table 7: United States Venlo Glass Greenhouse Revenue (billion) Forecast, by Application 2020 & 2033
- Table 8: Canada Venlo Glass Greenhouse Revenue (billion) Forecast, by Application 2020 & 2033
- Table 9: Mexico Venlo Glass Greenhouse Revenue (billion) Forecast, by Application 2020 & 2033
- Table 10: Global Venlo Glass Greenhouse Revenue billion Forecast, by Application 2020 & 2033
- Table 11: Global Venlo Glass Greenhouse Revenue billion Forecast, by Types 2020 & 2033
- Table 12: Global Venlo Glass Greenhouse Revenue billion Forecast, by Country 2020 & 2033
- Table 13: Brazil Venlo Glass Greenhouse Revenue (billion) Forecast, by Application 2020 & 2033
- Table 14: Argentina Venlo Glass Greenhouse Revenue (billion) Forecast, by Application 2020 & 2033
- Table 15: Rest of South America Venlo Glass Greenhouse Revenue (billion) Forecast, by Application 2020 & 2033
- Table 16: Global Venlo Glass Greenhouse Revenue billion Forecast, by Application 2020 & 2033
- Table 17: Global Venlo Glass Greenhouse Revenue billion Forecast, by Types 2020 & 2033
- Table 18: Global Venlo Glass Greenhouse Revenue billion Forecast, by Country 2020 & 2033
- Table 19: United Kingdom Venlo Glass Greenhouse Revenue (billion) Forecast, by Application 2020 & 2033
- Table 20: Germany Venlo Glass Greenhouse Revenue (billion) Forecast, by Application 2020 & 2033
- Table 21: France Venlo Glass Greenhouse Revenue (billion) Forecast, by Application 2020 & 2033
- Table 22: Italy Venlo Glass Greenhouse Revenue (billion) Forecast, by Application 2020 & 2033
- Table 23: Spain Venlo Glass Greenhouse Revenue (billion) Forecast, by Application 2020 & 2033
- Table 24: Russia Venlo Glass Greenhouse Revenue (billion) Forecast, by Application 2020 & 2033
- Table 25: Benelux Venlo Glass Greenhouse Revenue (billion) Forecast, by Application 2020 & 2033
- Table 26: Nordics Venlo Glass Greenhouse Revenue (billion) Forecast, by Application 2020 & 2033
- Table 27: Rest of Europe Venlo Glass Greenhouse Revenue (billion) Forecast, by Application 2020 & 2033
- Table 28: Global Venlo Glass Greenhouse Revenue billion Forecast, by Application 2020 & 2033
- Table 29: Global Venlo Glass Greenhouse Revenue billion Forecast, by Types 2020 & 2033
- Table 30: Global Venlo Glass Greenhouse Revenue billion Forecast, by Country 2020 & 2033
- Table 31: Turkey Venlo Glass Greenhouse Revenue (billion) Forecast, by Application 2020 & 2033
- Table 32: Israel Venlo Glass Greenhouse Revenue (billion) Forecast, by Application 2020 & 2033
- Table 33: GCC Venlo Glass Greenhouse Revenue (billion) Forecast, by Application 2020 & 2033
- Table 34: North Africa Venlo Glass Greenhouse Revenue (billion) Forecast, by Application 2020 & 2033
- Table 35: South Africa Venlo Glass Greenhouse Revenue (billion) Forecast, by Application 2020 & 2033
- Table 36: Rest of Middle East & Africa Venlo Glass Greenhouse Revenue (billion) Forecast, by Application 2020 & 2033
- Table 37: Global Venlo Glass Greenhouse Revenue billion Forecast, by Application 2020 & 2033
- Table 38: Global Venlo Glass Greenhouse Revenue billion Forecast, by Types 2020 & 2033
- Table 39: Global Venlo Glass Greenhouse Revenue billion Forecast, by Country 2020 & 2033
- Table 40: China Venlo Glass Greenhouse Revenue (billion) Forecast, by Application 2020 & 2033
- Table 41: India Venlo Glass Greenhouse Revenue (billion) Forecast, by Application 2020 & 2033
- Table 42: Japan Venlo Glass Greenhouse Revenue (billion) Forecast, by Application 2020 & 2033
- Table 43: South Korea Venlo Glass Greenhouse Revenue (billion) Forecast, by Application 2020 & 2033
- Table 44: ASEAN Venlo Glass Greenhouse Revenue (billion) Forecast, by Application 2020 & 2033
- Table 45: Oceania Venlo Glass Greenhouse Revenue (billion) Forecast, by Application 2020 & 2033
- Table 46: Rest of Asia Pacific Venlo Glass Greenhouse Revenue (billion) Forecast, by Application 2020 & 2033
Frequently Asked Questions
1. What is the projected Compound Annual Growth Rate (CAGR) of the Venlo Glass Greenhouse?
The projected CAGR is approximately 4.9%.
2. Which companies are prominent players in the Venlo Glass Greenhouse?
Key companies in the market include Luiten Greenhouses, Rough Brothers, Rufepa, Ammerlaan Constructions, Zwirs Horti Projects, Nobutec, Ludy Greenhouse, GGS Structures, Smiemans Projecten, Cravo, Sunmax Greenhouse, Idroterm Serre, Richel Group.
3. What are the main segments of the Venlo Glass Greenhouse?
The market segments include Application, Types.
4. Can you provide details about the market size?
The market size is estimated to be USD 1.1 billion as of 2022.
5. What are some drivers contributing to market growth?
N/A
6. What are the notable trends driving market growth?
N/A
7. Are there any restraints impacting market growth?
N/A
8. Can you provide examples of recent developments in the market?
N/A
9. What pricing options are available for accessing the report?
Pricing options include single-user, multi-user, and enterprise licenses priced at USD 2900.00, USD 4350.00, and USD 5800.00 respectively.
10. Is the market size provided in terms of value or volume?
The market size is provided in terms of value, measured in billion.
11. Are there any specific market keywords associated with the report?
Yes, the market keyword associated with the report is "Venlo Glass Greenhouse," which aids in identifying and referencing the specific market segment covered.
12. How do I determine which pricing option suits my needs best?
The pricing options vary based on user requirements and access needs. Individual users may opt for single-user licenses, while businesses requiring broader access may choose multi-user or enterprise licenses for cost-effective access to the report.
13. Are there any additional resources or data provided in the Venlo Glass Greenhouse report?
While the report offers comprehensive insights, it's advisable to review the specific contents or supplementary materials provided to ascertain if additional resources or data are available.
14. How can I stay updated on further developments or reports in the Venlo Glass Greenhouse?
To stay informed about further developments, trends, and reports in the Venlo Glass Greenhouse, consider subscribing to industry newsletters, following relevant companies and organizations, or regularly checking reputable industry news sources and publications.
Methodology
Step 1 - Identification of Relevant Samples Size from Population Database


Step 2 - Approaches for Defining Global Market Size (Value, Volume* & Price*)

Note*: In applicable scenarios
Step 3 - Data Sources
Primary Research
- Web Analytics
- Survey Reports
- Research Institute
- Latest Research Reports
- Opinion Leaders
Secondary Research
- Annual Reports
- White Paper
- Latest Press Release
- Industry Association
- Paid Database
- Investor Presentations

Step 4 - Data Triangulation
Involves using different sources of information in order to increase the validity of a study
These sources are likely to be stakeholders in a program - participants, other researchers, program staff, other community members, and so on.
Then we put all data in single framework & apply various statistical tools to find out the dynamic on the market.
During the analysis stage, feedback from the stakeholder groups would be compared to determine areas of agreement as well as areas of divergence