

Key Insights
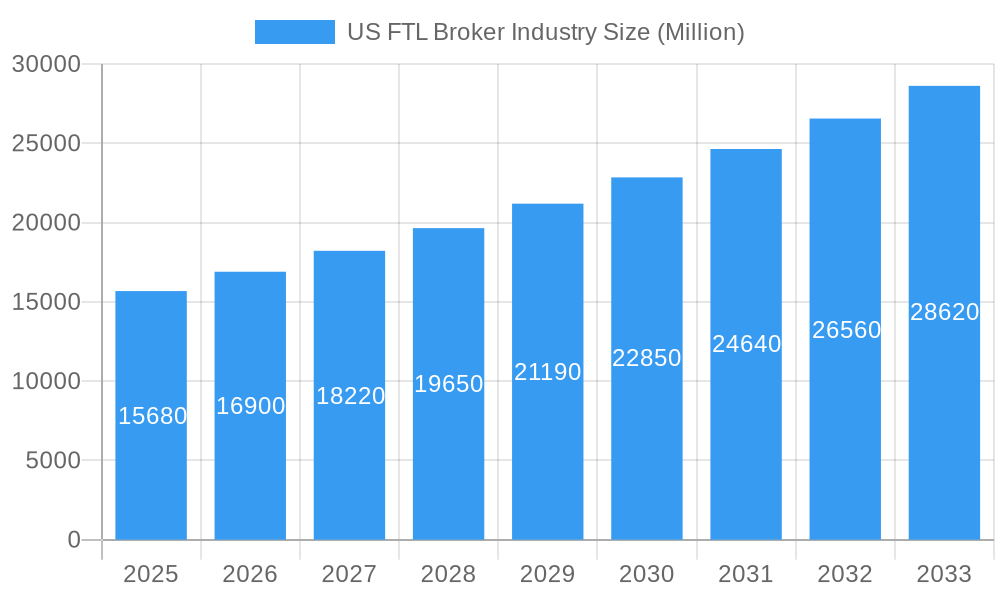
The US Full Truckload (FTL) Brokerage market, valued at $15.68 billion in 2025, is experiencing robust growth, projected to expand at a Compound Annual Growth Rate (CAGR) of 7.86% from 2025 to 2033. This growth is driven by several factors. The increasing complexity of supply chains, particularly within the manufacturing, automotive, and e-commerce sectors, necessitates efficient and cost-effective freight solutions. FTL brokerage offers businesses the scalability and flexibility to manage fluctuating transportation needs without the overhead of managing their own fleets. Technological advancements, including sophisticated logistics software and data analytics, enhance route optimization, pricing strategies, and overall efficiency, further fueling market expansion. The rise of e-commerce continues to boost demand for reliable and timely delivery services, placing significant pressure on existing logistics infrastructure and driving increased reliance on FTL brokers. Finally, a growing focus on sustainability within the supply chain is leading brokers to explore and implement environmentally friendly transportation solutions, attracting environmentally conscious businesses.
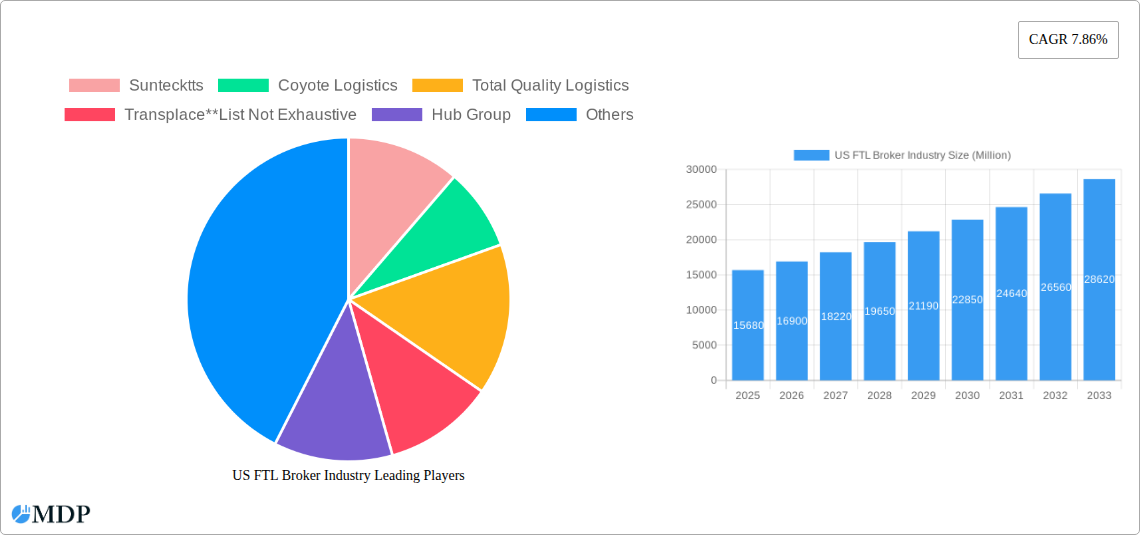
US FTL Broker Industry Market Size (In Billion)
However, the market also faces certain challenges. Fluctuations in fuel prices represent a significant cost factor impacting profitability, and driver shortages continue to constrain capacity and potentially lead to increased transportation costs. Economic downturns can significantly reduce shipping volumes, impacting the revenue stream of brokerage firms. Intense competition among established players and the emergence of new entrants, particularly those leveraging technology, creates a dynamic and demanding market environment. Regulatory changes and compliance requirements further add layers of complexity for brokerage businesses. Nevertheless, the long-term outlook remains positive, driven by consistent demand from various end-user industries and ongoing technological advancements designed to streamline operations and improve efficiency within the FTL brokerage sector. Companies like Coyote Logistics, CH Robinson, and XPO Logistics are key players navigating this competitive landscape.
US FTL Broker Industry Company Market Share
US FTL Broker Industry Market Report: 2019-2033
Dive deep into the dynamic US Full Truckload (FTL) Broker industry with this comprehensive market analysis, forecasting growth from 2019 to 2033. This report provides invaluable insights into market size, key players, emerging trends, and future opportunities, empowering businesses to make informed strategic decisions. The report covers key segments and leading players like Coyote Logistics, Total Quality Logistics, and CH Robinson, providing actionable intelligence for stakeholders across the supply chain.
US FTL Broker Industry Market Dynamics & Concentration
The US FTL Broker industry, valued at xx Million in 2024, is experiencing robust growth driven by e-commerce expansion and evolving supply chain needs. Market concentration is moderate, with a few large players holding significant market share, but numerous smaller brokers also competing. Innovation is fueled by technological advancements in logistics management software and digital freight matching platforms. Regulatory frameworks, including those related to driver safety and environmental regulations, significantly impact operations. Substitute products, such as less-than-truckload (LTL) shipping or private fleets, exist but often lack the flexibility and cost-effectiveness of FTL brokerage for high-volume shipments. End-user trends reveal a shift towards greater outsourcing of logistics functions and demand for greater supply chain visibility. The period 2019-2024 witnessed xx M&A deals, shaping the competitive landscape.
- Market Share: Top 5 players hold approximately xx% of the market.
- M&A Activity: Significant consolidation expected in the coming years.
- Key Regulatory Factors: FMCSA regulations, environmental regulations.
- Innovation Drivers: AI-powered route optimization, blockchain technology for improved transparency.
US FTL Broker Industry Industry Trends & Analysis
The US FTL Broker industry exhibits a Compound Annual Growth Rate (CAGR) of xx% during the forecast period (2025-2033), driven by several factors. The rise of e-commerce continues to fuel demand for efficient and reliable freight transportation solutions. Technological disruptions, such as the adoption of advanced analytics and automation, are transforming operational efficiency and enhancing customer experiences. Consumer preferences are increasingly focused on speed, transparency, and sustainability in logistics. Intense competitive dynamics are characterized by price competition, service differentiation, and strategic partnerships. Market penetration of digital freight platforms is rapidly increasing, with xx% of brokers now utilizing such technologies.
Leading Markets & Segments in US FTL Broker Industry
The Manufacturing and Automotive segment is the dominant end-user, accounting for approximately xx% of the total market value. This is driven by the high volume of goods shipped within these sectors.
- Key Drivers for Manufacturing & Automotive:
- High shipment volumes
- Just-in-time delivery requirements
- Extensive supply chain networks
- Dominance Analysis: The sector's reliance on efficient transportation and the need for specialized handling solutions contribute to its leading position. Other segments, such as Oil and Gas and Construction, also show strong growth potential due to infrastructure development and energy sector activities. Distributive Trade is another significant segment, benefiting from the expansion of e-commerce and omnichannel retail models.
US FTL Broker Industry Product Developments
Product innovation focuses on enhancing digital platforms with features like real-time shipment tracking, predictive analytics, and automated invoicing. These advancements enhance efficiency, improve customer service, and provide greater supply chain visibility. The market is seeing increased integration of technologies like AI and machine learning for better route optimization and capacity planning. These innovations are creating a more competitive market and meeting the increasing demand for tailored and efficient logistics solutions.
Key Drivers of US FTL Broker Industry Growth
Several factors are fueling the growth of the US FTL Broker industry. Technological advancements, such as the use of digital freight matching platforms and advanced analytics, are boosting efficiency and reducing costs. Economic growth and increased manufacturing and consumption drive higher freight volumes. Favorable regulatory environments (while some regulations pose challenges, others like infrastructure investment can be beneficial) also contribute to industry growth. Furthermore, the increasing adoption of e-commerce and omnichannel retail strategies create strong demand for reliable and cost-effective transportation solutions.
Challenges in the US FTL Broker Industry Market
The industry faces challenges including fluctuating fuel prices, driver shortages, and increased regulatory scrutiny. These factors increase operating costs and potentially disrupt service delivery. Intense competition from established players and new entrants also puts pressure on profit margins. Supply chain disruptions, exacerbated by geopolitical events, further add complexity to operations, impacting the reliability and timely delivery of goods. These challenges contribute to a xx% increase in operating costs for many brokers.
Emerging Opportunities in US FTL Broker Industry
Significant opportunities exist for growth through technological innovation, strategic partnerships, and market expansion. The development and adoption of autonomous vehicles and drone technology have the potential to transform the industry. Strategic alliances with technology companies and other logistics providers can create synergistic benefits. Expanding into underserved markets or specialized niches presents growth potential. This includes developing solutions to meet specific sustainability concerns within the freight industry.
Leading Players in the US FTL Broker Industry Sector
- Suntecktts
- Coyote Logistics
- Total Quality Logistics
- Transplace
- Hub Group
- Landstar System Inc
- CH Robinson
- BNSF Logistics LLC
- XPO Logistics Inc
- Worldwide Express
- Schneider
- Echo Global Logistics
- J B Hunt Transport Inc
- Kag Logistics Inc
- Globaltranz
Key Milestones in US FTL Broker Industry Industry
- September 2023: Rhenus acquires ITS Logistics Hungary KFT, expanding its air freight capabilities in Hungary.
- September 2023: Rhenus Group acquires BLU Logistics, significantly strengthening its presence in LATAM and Asia-LATAM trade lanes. This acquisition reflects the industry trend towards nearshoring and supply chain diversification.
Strategic Outlook for US FTL Broker Industry Market
The US FTL Broker industry is poised for continued growth, driven by technological innovation, evolving supply chain needs, and economic expansion. Strategic opportunities lie in leveraging data analytics, embracing automation, and forging strategic partnerships. Companies that effectively adapt to changing market dynamics, prioritize customer service, and invest in technological advancements are best positioned for long-term success. The focus on sustainability and resilient supply chains will further shape the industry's future.
US FTL Broker Industry Segmentation
-
1. End User
- 1.1. Manufacturing and Automotive
- 1.2. Oil and Gas, Mining, and Quarrying
- 1.3. Agriculture Fishing, and Forestry
- 1.4. Construction
- 1.5. Distributive Trade
- 1.6. Other End Users
US FTL Broker Industry Segmentation By Geography
-
1. North America
- 1.1. United States
- 1.2. Canada
- 1.3. Mexico
-
2. South America
- 2.1. Brazil
- 2.2. Argentina
- 2.3. Rest of South America
-
3. Europe
- 3.1. United Kingdom
- 3.2. Germany
- 3.3. France
- 3.4. Italy
- 3.5. Spain
- 3.6. Russia
- 3.7. Benelux
- 3.8. Nordics
- 3.9. Rest of Europe
-
4. Middle East & Africa
- 4.1. Turkey
- 4.2. Israel
- 4.3. GCC
- 4.4. North Africa
- 4.5. South Africa
- 4.6. Rest of Middle East & Africa
-
5. Asia Pacific
- 5.1. China
- 5.2. India
- 5.3. Japan
- 5.4. South Korea
- 5.5. ASEAN
- 5.6. Oceania
- 5.7. Rest of Asia Pacific
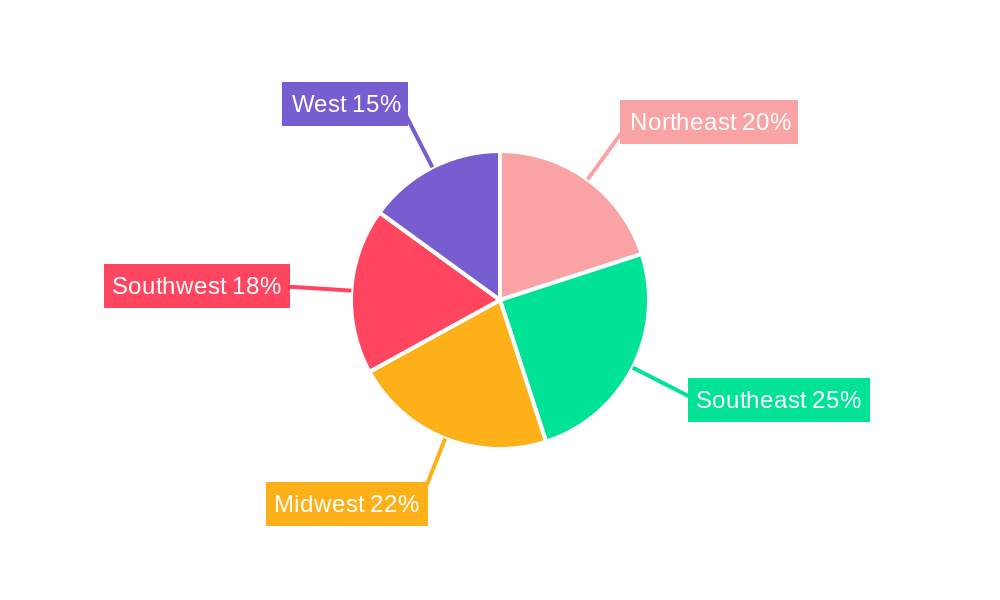
US FTL Broker Industry Regional Market Share
Geographic Coverage of US FTL Broker Industry
US FTL Broker Industry REPORT HIGHLIGHTS
| Aspects | Details |
|---|---|
| Study Period | 2020-2034 |
| Base Year | 2025 |
| Estimated Year | 2026 |
| Forecast Period | 2026-2034 |
| Historical Period | 2020-2025 |
| Growth Rate | CAGR of 7.86% from 2020-2034 |
| Segmentation |
|
Table of Contents
- 1. Introduction
- 1.1. Research Scope
- 1.2. Market Segmentation
- 1.3. Research Objective
- 1.4. Definitions and Assumptions
- 2. Executive Summary
- 2.1. Market Snapshot
- 3. Market Dynamics
- 3.1. Market Drivers
- 3.2. Market Restrains
- 3.3. Market Trends
- 3.4. Market Opportunities
- 4. Market Factor Analysis
- 4.1. Porters Five Forces
- 4.1.1. Bargaining Power of Suppliers
- 4.1.2. Bargaining Power of Buyers
- 4.1.3. Threat of New Entrants
- 4.1.4. Threat of Substitutes
- 4.1.5. Competitive Rivalry
- 4.2. PESTEL analysis
- 4.3. BCG Analysis
- 4.3.1. Stars (High Growth, High Market Share)
- 4.3.2. Cash Cows (Low Growth, High Market Share)
- 4.3.3. Question Mark (High Growth, Low Market Share)
- 4.3.4. Dogs (Low Growth, Low Market Share)
- 4.4. Ansoff Matrix Analysis
- 4.5. Supply Chain Analysis
- 4.6. Regulatory Landscape
- 4.7. Current Market Potential and Opportunity Assessment (TAM–SAM–SOM Framework)
- 4.8. MDP Analyst Note
- 4.1. Porters Five Forces
- 5. Market Analysis, Insights and Forecast 2021-2033
- 5.1. Market Analysis, Insights and Forecast - by End User
- 5.1.1. Manufacturing and Automotive
- 5.1.2. Oil and Gas, Mining, and Quarrying
- 5.1.3. Agriculture Fishing, and Forestry
- 5.1.4. Construction
- 5.1.5. Distributive Trade
- 5.1.6. Other End Users
- 5.2. Market Analysis, Insights and Forecast - by Region
- 5.2.1. North America
- 5.2.2. South America
- 5.2.3. Europe
- 5.2.4. Middle East & Africa
- 5.2.5. Asia Pacific
- 5.1. Market Analysis, Insights and Forecast - by End User
- 6. Global US FTL Broker Industry Analysis, Insights and Forecast, 2021-2033
- 6.1. Market Analysis, Insights and Forecast - by End User
- 6.1.1. Manufacturing and Automotive
- 6.1.2. Oil and Gas, Mining, and Quarrying
- 6.1.3. Agriculture Fishing, and Forestry
- 6.1.4. Construction
- 6.1.5. Distributive Trade
- 6.1.6. Other End Users
- 6.1. Market Analysis, Insights and Forecast - by End User
- 7. North America US FTL Broker Industry Analysis, Insights and Forecast, 2020-2032
- 7.1. Market Analysis, Insights and Forecast - by End User
- 7.1.1. Manufacturing and Automotive
- 7.1.2. Oil and Gas, Mining, and Quarrying
- 7.1.3. Agriculture Fishing, and Forestry
- 7.1.4. Construction
- 7.1.5. Distributive Trade
- 7.1.6. Other End Users
- 7.1. Market Analysis, Insights and Forecast - by End User
- 8. South America US FTL Broker Industry Analysis, Insights and Forecast, 2020-2032
- 8.1. Market Analysis, Insights and Forecast - by End User
- 8.1.1. Manufacturing and Automotive
- 8.1.2. Oil and Gas, Mining, and Quarrying
- 8.1.3. Agriculture Fishing, and Forestry
- 8.1.4. Construction
- 8.1.5. Distributive Trade
- 8.1.6. Other End Users
- 8.1. Market Analysis, Insights and Forecast - by End User
- 9. Europe US FTL Broker Industry Analysis, Insights and Forecast, 2020-2032
- 9.1. Market Analysis, Insights and Forecast - by End User
- 9.1.1. Manufacturing and Automotive
- 9.1.2. Oil and Gas, Mining, and Quarrying
- 9.1.3. Agriculture Fishing, and Forestry
- 9.1.4. Construction
- 9.1.5. Distributive Trade
- 9.1.6. Other End Users
- 9.1. Market Analysis, Insights and Forecast - by End User
- 10. Middle East & Africa US FTL Broker Industry Analysis, Insights and Forecast, 2020-2032
- 10.1. Market Analysis, Insights and Forecast - by End User
- 10.1.1. Manufacturing and Automotive
- 10.1.2. Oil and Gas, Mining, and Quarrying
- 10.1.3. Agriculture Fishing, and Forestry
- 10.1.4. Construction
- 10.1.5. Distributive Trade
- 10.1.6. Other End Users
- 10.1. Market Analysis, Insights and Forecast - by End User
- 11. Asia Pacific US FTL Broker Industry Analysis, Insights and Forecast, 2020-2032
- 11.1. Market Analysis, Insights and Forecast - by End User
- 11.1.1. Manufacturing and Automotive
- 11.1.2. Oil and Gas, Mining, and Quarrying
- 11.1.3. Agriculture Fishing, and Forestry
- 11.1.4. Construction
- 11.1.5. Distributive Trade
- 11.1.6. Other End Users
- 11.1. Market Analysis, Insights and Forecast - by End User
- 12. Competitive Analysis
- 12.1. Company Profiles
- 12.1.1 Suntecktts
- 12.1.1.1. Company Overview
- 12.1.1.2. Products
- 12.1.1.3. Company Financials
- 12.1.1.4. SWOT Analysis
- 12.1.2 Coyote Logistics
- 12.1.2.1. Company Overview
- 12.1.2.2. Products
- 12.1.2.3. Company Financials
- 12.1.2.4. SWOT Analysis
- 12.1.3 Total Quality Logistics
- 12.1.3.1. Company Overview
- 12.1.3.2. Products
- 12.1.3.3. Company Financials
- 12.1.3.4. SWOT Analysis
- 12.1.4 Transplace**List Not Exhaustive
- 12.1.4.1. Company Overview
- 12.1.4.2. Products
- 12.1.4.3. Company Financials
- 12.1.4.4. SWOT Analysis
- 12.1.5 Hub Group
- 12.1.5.1. Company Overview
- 12.1.5.2. Products
- 12.1.5.3. Company Financials
- 12.1.5.4. SWOT Analysis
- 12.1.6 Landstar System Inc
- 12.1.6.1. Company Overview
- 12.1.6.2. Products
- 12.1.6.3. Company Financials
- 12.1.6.4. SWOT Analysis
- 12.1.7 CH Robinson
- 12.1.7.1. Company Overview
- 12.1.7.2. Products
- 12.1.7.3. Company Financials
- 12.1.7.4. SWOT Analysis
- 12.1.8 BNSF Logistics LLC
- 12.1.8.1. Company Overview
- 12.1.8.2. Products
- 12.1.8.3. Company Financials
- 12.1.8.4. SWOT Analysis
- 12.1.9 XPO Logistics Inc
- 12.1.9.1. Company Overview
- 12.1.9.2. Products
- 12.1.9.3. Company Financials
- 12.1.9.4. SWOT Analysis
- 12.1.10 Worldwide Express
- 12.1.10.1. Company Overview
- 12.1.10.2. Products
- 12.1.10.3. Company Financials
- 12.1.10.4. SWOT Analysis
- 12.1.11 Schneider
- 12.1.11.1. Company Overview
- 12.1.11.2. Products
- 12.1.11.3. Company Financials
- 12.1.11.4. SWOT Analysis
- 12.1.12 Echo Global Logistics
- 12.1.12.1. Company Overview
- 12.1.12.2. Products
- 12.1.12.3. Company Financials
- 12.1.12.4. SWOT Analysis
- 12.1.13 J B Hunt Transport Inc
- 12.1.13.1. Company Overview
- 12.1.13.2. Products
- 12.1.13.3. Company Financials
- 12.1.13.4. SWOT Analysis
- 12.1.14 Kag Logistics Inc
- 12.1.14.1. Company Overview
- 12.1.14.2. Products
- 12.1.14.3. Company Financials
- 12.1.14.4. SWOT Analysis
- 12.1.15 Globaltranz
- 12.1.15.1. Company Overview
- 12.1.15.2. Products
- 12.1.15.3. Company Financials
- 12.1.15.4. SWOT Analysis
- 12.1.1 Suntecktts
- 12.2. Market Entropy
- 12.2.1 Company's Key Areas Served
- 12.2.2 Recent Developments
- 12.3. Company Market Share Analysis 2025
- 12.3.1 Top 5 Companies Market Share Analysis
- 12.3.2 Top 3 Companies Market Share Analysis
- 12.4. List of Potential Customers
- 13. Research Methodology
List of Figures
- Figure 1: Global US FTL Broker Industry Revenue Breakdown (Million, %) by Region 2025 & 2033
- Figure 2: North America US FTL Broker Industry Revenue (Million), by End User 2025 & 2033
- Figure 3: North America US FTL Broker Industry Revenue Share (%), by End User 2025 & 2033
- Figure 4: North America US FTL Broker Industry Revenue (Million), by Country 2025 & 2033
- Figure 5: North America US FTL Broker Industry Revenue Share (%), by Country 2025 & 2033
- Figure 6: South America US FTL Broker Industry Revenue (Million), by End User 2025 & 2033
- Figure 7: South America US FTL Broker Industry Revenue Share (%), by End User 2025 & 2033
- Figure 8: South America US FTL Broker Industry Revenue (Million), by Country 2025 & 2033
- Figure 9: South America US FTL Broker Industry Revenue Share (%), by Country 2025 & 2033
- Figure 10: Europe US FTL Broker Industry Revenue (Million), by End User 2025 & 2033
- Figure 11: Europe US FTL Broker Industry Revenue Share (%), by End User 2025 & 2033
- Figure 12: Europe US FTL Broker Industry Revenue (Million), by Country 2025 & 2033
- Figure 13: Europe US FTL Broker Industry Revenue Share (%), by Country 2025 & 2033
- Figure 14: Middle East & Africa US FTL Broker Industry Revenue (Million), by End User 2025 & 2033
- Figure 15: Middle East & Africa US FTL Broker Industry Revenue Share (%), by End User 2025 & 2033
- Figure 16: Middle East & Africa US FTL Broker Industry Revenue (Million), by Country 2025 & 2033
- Figure 17: Middle East & Africa US FTL Broker Industry Revenue Share (%), by Country 2025 & 2033
- Figure 18: Asia Pacific US FTL Broker Industry Revenue (Million), by End User 2025 & 2033
- Figure 19: Asia Pacific US FTL Broker Industry Revenue Share (%), by End User 2025 & 2033
- Figure 20: Asia Pacific US FTL Broker Industry Revenue (Million), by Country 2025 & 2033
- Figure 21: Asia Pacific US FTL Broker Industry Revenue Share (%), by Country 2025 & 2033
List of Tables
- Table 1: Global US FTL Broker Industry Revenue Million Forecast, by End User 2020 & 2033
- Table 2: Global US FTL Broker Industry Revenue Million Forecast, by Region 2020 & 2033
- Table 3: Global US FTL Broker Industry Revenue Million Forecast, by End User 2020 & 2033
- Table 4: Global US FTL Broker Industry Revenue Million Forecast, by Country 2020 & 2033
- Table 5: United States US FTL Broker Industry Revenue (Million) Forecast, by Application 2020 & 2033
- Table 6: Canada US FTL Broker Industry Revenue (Million) Forecast, by Application 2020 & 2033
- Table 7: Mexico US FTL Broker Industry Revenue (Million) Forecast, by Application 2020 & 2033
- Table 8: Global US FTL Broker Industry Revenue Million Forecast, by End User 2020 & 2033
- Table 9: Global US FTL Broker Industry Revenue Million Forecast, by Country 2020 & 2033
- Table 10: Brazil US FTL Broker Industry Revenue (Million) Forecast, by Application 2020 & 2033
- Table 11: Argentina US FTL Broker Industry Revenue (Million) Forecast, by Application 2020 & 2033
- Table 12: Rest of South America US FTL Broker Industry Revenue (Million) Forecast, by Application 2020 & 2033
- Table 13: Global US FTL Broker Industry Revenue Million Forecast, by End User 2020 & 2033
- Table 14: Global US FTL Broker Industry Revenue Million Forecast, by Country 2020 & 2033
- Table 15: United Kingdom US FTL Broker Industry Revenue (Million) Forecast, by Application 2020 & 2033
- Table 16: Germany US FTL Broker Industry Revenue (Million) Forecast, by Application 2020 & 2033
- Table 17: France US FTL Broker Industry Revenue (Million) Forecast, by Application 2020 & 2033
- Table 18: Italy US FTL Broker Industry Revenue (Million) Forecast, by Application 2020 & 2033
- Table 19: Spain US FTL Broker Industry Revenue (Million) Forecast, by Application 2020 & 2033
- Table 20: Russia US FTL Broker Industry Revenue (Million) Forecast, by Application 2020 & 2033
- Table 21: Benelux US FTL Broker Industry Revenue (Million) Forecast, by Application 2020 & 2033
- Table 22: Nordics US FTL Broker Industry Revenue (Million) Forecast, by Application 2020 & 2033
- Table 23: Rest of Europe US FTL Broker Industry Revenue (Million) Forecast, by Application 2020 & 2033
- Table 24: Global US FTL Broker Industry Revenue Million Forecast, by End User 2020 & 2033
- Table 25: Global US FTL Broker Industry Revenue Million Forecast, by Country 2020 & 2033
- Table 26: Turkey US FTL Broker Industry Revenue (Million) Forecast, by Application 2020 & 2033
- Table 27: Israel US FTL Broker Industry Revenue (Million) Forecast, by Application 2020 & 2033
- Table 28: GCC US FTL Broker Industry Revenue (Million) Forecast, by Application 2020 & 2033
- Table 29: North Africa US FTL Broker Industry Revenue (Million) Forecast, by Application 2020 & 2033
- Table 30: South Africa US FTL Broker Industry Revenue (Million) Forecast, by Application 2020 & 2033
- Table 31: Rest of Middle East & Africa US FTL Broker Industry Revenue (Million) Forecast, by Application 2020 & 2033
- Table 32: Global US FTL Broker Industry Revenue Million Forecast, by End User 2020 & 2033
- Table 33: Global US FTL Broker Industry Revenue Million Forecast, by Country 2020 & 2033
- Table 34: China US FTL Broker Industry Revenue (Million) Forecast, by Application 2020 & 2033
- Table 35: India US FTL Broker Industry Revenue (Million) Forecast, by Application 2020 & 2033
- Table 36: Japan US FTL Broker Industry Revenue (Million) Forecast, by Application 2020 & 2033
- Table 37: South Korea US FTL Broker Industry Revenue (Million) Forecast, by Application 2020 & 2033
- Table 38: ASEAN US FTL Broker Industry Revenue (Million) Forecast, by Application 2020 & 2033
- Table 39: Oceania US FTL Broker Industry Revenue (Million) Forecast, by Application 2020 & 2033
- Table 40: Rest of Asia Pacific US FTL Broker Industry Revenue (Million) Forecast, by Application 2020 & 2033
Frequently Asked Questions
1. What is the projected Compound Annual Growth Rate (CAGR) of the US FTL Broker Industry?
The projected CAGR is approximately 7.86%.
2. Which companies are prominent players in the US FTL Broker Industry?
Key companies in the market include Suntecktts, Coyote Logistics, Total Quality Logistics, Transplace**List Not Exhaustive, Hub Group, Landstar System Inc, CH Robinson, BNSF Logistics LLC, XPO Logistics Inc, Worldwide Express, Schneider, Echo Global Logistics, J B Hunt Transport Inc, Kag Logistics Inc, Globaltranz.
3. What are the main segments of the US FTL Broker Industry?
The market segments include End User.
4. Can you provide details about the market size?
The market size is estimated to be USD 15.68 Million as of 2022.
5. What are some drivers contributing to market growth?
4.; Increasing demand for efficient transportation4.; Growing eCommerce industry.
6. What are the notable trends driving market growth?
Fluctuating Fuel prices Hampering the Growth of the Market.
7. Are there any restraints impacting market growth?
4.; Intense competition affecting the market4.; Fluctuating fuel prices.
8. Can you provide examples of recent developments in the market?
Sept 2023: Rhenus continues its growth trajectory with the strategic acquisition of the Hungarian freight forwarder ITS Logistics Hungary KFT. This move will enable them to better serve their customer's needs, particularly in relation to air freight services, while also expanding their reach in the Hungarian market.
9. What pricing options are available for accessing the report?
Pricing options include single-user, multi-user, and enterprise licenses priced at USD 3800, USD 4500, and USD 5800 respectively.
10. Is the market size provided in terms of value or volume?
The market size is provided in terms of value, measured in Million.
11. Are there any specific market keywords associated with the report?
Yes, the market keyword associated with the report is "US FTL Broker Industry," which aids in identifying and referencing the specific market segment covered.
12. How do I determine which pricing option suits my needs best?
The pricing options vary based on user requirements and access needs. Individual users may opt for single-user licenses, while businesses requiring broader access may choose multi-user or enterprise licenses for cost-effective access to the report.
13. Are there any additional resources or data provided in the US FTL Broker Industry report?
While the report offers comprehensive insights, it's advisable to review the specific contents or supplementary materials provided to ascertain if additional resources or data are available.
14. How can I stay updated on further developments or reports in the US FTL Broker Industry?
To stay informed about further developments, trends, and reports in the US FTL Broker Industry, consider subscribing to industry newsletters, following relevant companies and organizations, or regularly checking reputable industry news sources and publications.
Methodology
Step 1 - Identification of Relevant Samples Size from Population Database


Step 2 - Approaches for Defining Global Market Size (Value, Volume* & Price*)

Note*: In applicable scenarios
Step 3 - Data Sources
Primary Research
- Web Analytics
- Survey Reports
- Research Institute
- Latest Research Reports
- Opinion Leaders
Secondary Research
- Annual Reports
- White Paper
- Latest Press Release
- Industry Association
- Paid Database
- Investor Presentations

Step 4 - Data Triangulation
Involves using different sources of information in order to increase the validity of a study
These sources are likely to be stakeholders in a program - participants, other researchers, program staff, other community members, and so on.
Then we put all data in single framework & apply various statistical tools to find out the dynamic on the market.
During the analysis stage, feedback from the stakeholder groups would be compared to determine areas of agreement as well as areas of divergence