

Key Insights
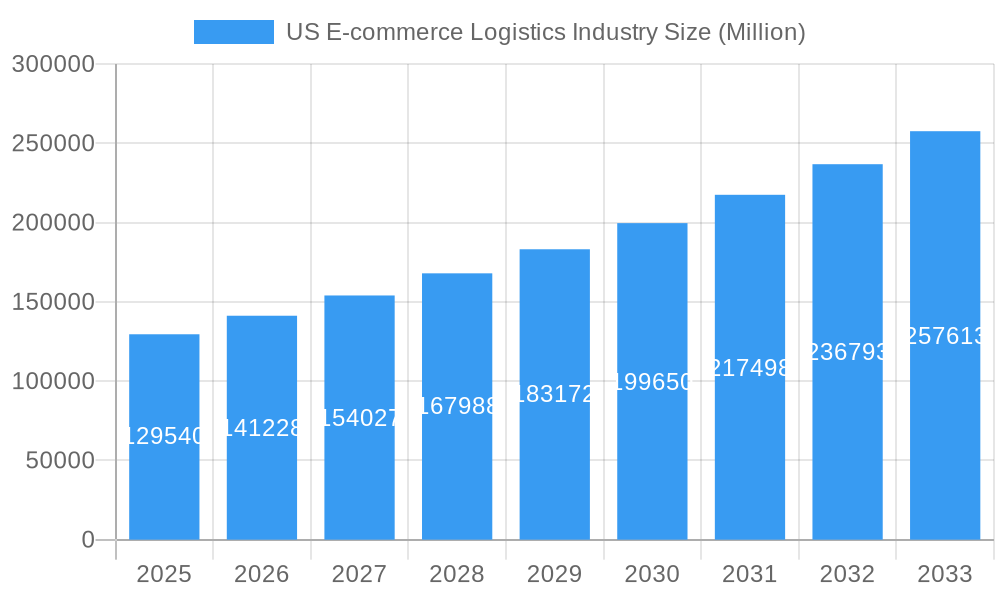
The US e-commerce logistics industry is experiencing robust growth, projected to reach a market size of $129.54 billion in 2025 and exhibiting a Compound Annual Growth Rate (CAGR) of 8.90% from 2025 to 2033. This expansion is fueled by several key drivers. The surge in online shopping, particularly during and after the pandemic, has significantly increased demand for efficient and reliable delivery services. Consumers increasingly expect faster shipping times, such as same-day or next-day delivery, pushing logistics companies to invest in advanced technologies like automation, AI-powered route optimization, and sophisticated warehouse management systems. The growth of omnichannel retail strategies, where businesses integrate online and offline sales channels, further complicates logistics, creating opportunities for specialized services like inventory management and last-mile delivery solutions. Furthermore, the increasing preference for e-commerce among diverse demographics and product categories, ranging from fashion and apparel to home appliances and consumer electronics, contributes to the market's dynamism. Competition is fierce, with established players like FedEx, UPS, and DHL vying for market share alongside smaller, specialized logistics providers. This necessitates continuous innovation and strategic partnerships to maintain competitiveness and meet evolving customer expectations.
US E-commerce Logistics Industry Market Size (In Billion)
The industry faces certain constraints, primarily related to rising fuel costs, labor shortages, and the ongoing challenges of navigating complex regulatory frameworks. E-commerce logistics companies are actively addressing these by implementing cost-saving measures, investing in employee training and retention programs, and proactively engaging with regulatory bodies. Market segmentation reveals a significant presence of both B2B and B2C business models, with domestic deliveries still dominating, albeit with a steadily increasing share of international/cross-border shipments. Regional variations are expected, with higher concentrations of activity in densely populated areas like the Northeast and West Coast regions. The forecast period, 2025-2033, promises continuous growth, but success will hinge on adapting to changing consumer demands, optimizing operational efficiency, and embracing technological advancements to maintain a competitive edge.
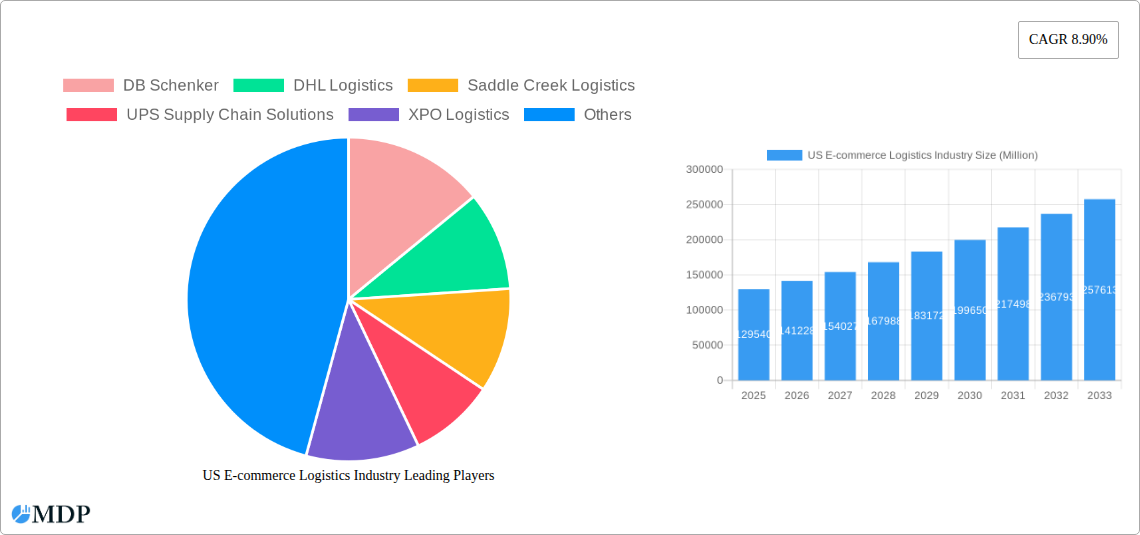
US E-commerce Logistics Industry Company Market Share
US E-commerce Logistics Industry: A Comprehensive Market Report (2019-2033)
This in-depth report provides a comprehensive analysis of the US e-commerce logistics industry, covering market dynamics, leading players, emerging trends, and future growth prospects. With a study period spanning 2019-2033, a base year of 2025, and a forecast period of 2025-2033, this report is an invaluable resource for industry stakeholders, investors, and strategic decision-makers. The report's detailed segmentation allows for a granular understanding of the market, encompassing key segments and leading companies like DB Schenker, DHL Logistics, Saddle Creek Logistics, UPS Supply Chain Solutions, XPO Logistics, Rakuten Super Logistics, FedEx, Geodis Logistics, Kenco Logistics Services, and Kuehne and Nagel Logistics (list not exhaustive). The market is valued at xx Million in 2025 and is projected to reach xx Million by 2033, showcasing substantial growth potential.
US E-commerce Logistics Industry Market Dynamics & Concentration
The US e-commerce logistics industry is characterized by high competition and significant consolidation. Market concentration is relatively high, with a few major players holding significant market share. For example, the top 5 players collectively hold an estimated xx% market share in 2025. This concentration is driven by substantial investments in technology and infrastructure, allowing these companies to offer comprehensive and efficient logistics solutions. Innovation, especially in automation and technology, is a key driver, pushing players to enhance efficiency and reduce costs. The industry is heavily regulated, with compliance requirements for safety, security, and environmental sustainability shaping operational practices. Product substitutes are limited, as specialized logistics solutions are often critical for e-commerce businesses. End-user trends, such as increasing demand for faster delivery and personalized shipping options, are reshaping market offerings. Mergers and acquisitions (M&A) activity has been robust in recent years, reflecting attempts to achieve economies of scale and expand service portfolios. Between 2019 and 2024, an estimated xx M&A deals were recorded in the sector.
- Market Share: Top 5 players: xx% (2025 estimate)
- M&A Activity: xx deals (2019-2024)
- Key Innovation Drivers: Automation, AI, Data Analytics, Sustainability Initiatives
- Regulatory Landscape: Focus on safety, security, and environmental regulations
US E-commerce Logistics Industry Industry Trends & Analysis
The US e-commerce logistics market is experiencing robust growth, driven by the expanding e-commerce sector and evolving consumer expectations. The Compound Annual Growth Rate (CAGR) for the period 2025-2033 is projected to be xx%, indicating a significant expansion. Technological advancements, such as the adoption of AI-powered warehouse management systems and autonomous vehicles, are disrupting traditional operations, improving efficiency and enhancing delivery speed. Consumers increasingly demand faster and more flexible delivery options, including same-day and next-day delivery, influencing logistics providers to invest in advanced infrastructure and technologies. The competitive landscape is highly dynamic, with companies continuously striving for competitive advantage through strategic partnerships, technological innovation, and service expansion. Market penetration of advanced technologies like automated sorting systems is steadily increasing, with penetration rates expected to reach xx% by 2033.
Leading Markets & Segments in US E-commerce Logistics Industry
The US e-commerce logistics market is geographically diverse, with significant activity across various regions. However, the key growth drivers are spread across specific segments.
By Service:
- Transportation: Dominated by expedited shipping and last-mile delivery services due to high consumer demand for speed and convenience.
- Warehousing and Inventory Management: Growth fueled by rising demand for efficient storage and inventory optimization solutions, particularly from large online retailers.
- Value-added Services: This is a fast-growing area with increasing demand for services like packaging, labeling, and returns management.
By Business:
- B2C: The largest and fastest-growing segment, fueled by the surge in online shopping.
- B2B: While smaller than B2C, this segment shows steady growth due to increased reliance on e-procurement and supply chain optimization.
By Destination:
- Domestic: Currently the largest segment, driven by the massive volume of domestic e-commerce shipments.
- International/Cross-border: This segment is experiencing rapid growth, driven by expanding global trade and cross-border e-commerce.
By Product:
- Fashion and Apparel: A major segment due to high online sales and the need for fast and efficient delivery of clothing items.
- Consumer Electronics: Growth is driven by the increasing demand for electronics products and the sensitivity of electronics to transportation damage.
- Other Products: This category, encompassing toys, food products, and other items, represents a sizable and diverse segment of the market.
Key drivers for the dominant segments include robust e-commerce growth, increased consumer spending, advancements in logistics technologies, and supportive economic policies. The development of advanced transportation infrastructure, particularly in densely populated urban areas, plays a crucial role in enabling efficient last-mile delivery.
US E-commerce Logistics Industry Product Developments
The industry is witnessing rapid product innovation, driven primarily by advancements in automation, artificial intelligence, and data analytics. Automated sorting systems, robotic process automation in warehouses, and advanced route optimization software are enhancing efficiency and reducing costs. Real-time tracking and delivery management tools are enhancing transparency and improving customer experience. These advancements are not only increasing efficiency but also enabling the customization of logistics solutions to meet the specific needs of e-commerce businesses.
Key Drivers of US E-commerce Logistics Industry Growth
Several factors are driving the growth of the US e-commerce logistics industry. The explosive growth of e-commerce is a primary driver, constantly increasing the volume of goods needing to be transported and delivered. Technological advancements like automation and AI are improving efficiency and reducing costs. Favorable economic conditions and increasing consumer spending contribute significantly. Government initiatives aimed at improving infrastructure and streamlining regulations support industry expansion.
Challenges in the US E-commerce Logistics Industry Market
The industry faces several challenges, including rising transportation costs and fuel prices, which impact profitability. Driver shortages create operational difficulties, hindering timely deliveries. The increasing complexity of supply chains adds to management and operational challenges. Stringent regulatory compliance requirements increase operational costs. Intense competition among logistics providers puts pressure on pricing and profitability.
Emerging Opportunities in US E-commerce Logistics Industry
The e-commerce logistics sector presents several significant opportunities. The adoption of advanced technologies such as drone delivery and autonomous vehicles offers substantial potential for cost reduction and efficiency improvements. Strategic partnerships between logistics companies and technology firms can create innovative and efficient logistics solutions. Expanding into new markets and offering specialized services catering to specific industry niches can lead to significant growth.
Leading Players in the US E-commerce Logistics Industry Sector
Key Milestones in US E-commerce Logistics Industry Industry
- August 2023: DHL eCommerce opens a new 352,000 sq ft distribution center in Melrose Park, Illinois, equipped with an automated sorter capable of handling 40,000 parcels per hour. This is part of a larger expansion plan involving 11 new or relocated warehouses, with 7 more planned.
- April 2023: DHL Express launches GoGreen Plus, expanding sustainable shipping options for US SMEs by offsetting carbon footprints through Sustainable Aviation Fuel.
Strategic Outlook for US E-commerce Logistics Industry Market
The future of the US e-commerce logistics industry is bright, with considerable growth potential driven by ongoing e-commerce expansion, technological innovation, and increasing consumer demand for efficient and convenient delivery. Companies that embrace automation, invest in sustainable solutions, and focus on providing a seamless customer experience will be best positioned to succeed. Strategic partnerships and expansion into emerging markets will be key to capturing market share and driving long-term growth.
US E-commerce Logistics Industry Segmentation
-
1. Service
- 1.1. Transportation
- 1.2. Warehousing and Inventory management
- 1.3. Value-added services (Labeling, Packaging, etc)
-
2. Business
- 2.1. B2B
- 2.2. B2C
-
3. Destination
- 3.1. Domestic
- 3.2. International/cross-border
-
4. Product
- 4.1. Fashion and Apparel
- 4.2. Consumer Electronics
- 4.3. Home Appliances
- 4.4. Furniture
- 4.5. Beauty and Personal Care Products
- 4.6. Other Products (Toys, Food Products, etc.)
US E-commerce Logistics Industry Segmentation By Geography
-
1. North America
- 1.1. United States
- 1.2. Canada
- 1.3. Mexico
-
2. South America
- 2.1. Brazil
- 2.2. Argentina
- 2.3. Rest of South America
-
3. Europe
- 3.1. United Kingdom
- 3.2. Germany
- 3.3. France
- 3.4. Italy
- 3.5. Spain
- 3.6. Russia
- 3.7. Benelux
- 3.8. Nordics
- 3.9. Rest of Europe
-
4. Middle East & Africa
- 4.1. Turkey
- 4.2. Israel
- 4.3. GCC
- 4.4. North Africa
- 4.5. South Africa
- 4.6. Rest of Middle East & Africa
-
5. Asia Pacific
- 5.1. China
- 5.2. India
- 5.3. Japan
- 5.4. South Korea
- 5.5. ASEAN
- 5.6. Oceania
- 5.7. Rest of Asia Pacific
US E-commerce Logistics Industry Regional Market Share
Geographic Coverage of US E-commerce Logistics Industry
US E-commerce Logistics Industry REPORT HIGHLIGHTS
| Aspects | Details |
|---|---|
| Study Period | 2020-2034 |
| Base Year | 2025 |
| Estimated Year | 2026 |
| Forecast Period | 2026-2034 |
| Historical Period | 2020-2025 |
| Growth Rate | CAGR of 8.90% from 2020-2034 |
| Segmentation |
|
Table of Contents
- 1. Introduction
- 1.1. Research Scope
- 1.2. Market Segmentation
- 1.3. Research Objective
- 1.4. Definitions and Assumptions
- 2. Executive Summary
- 2.1. Market Snapshot
- 3. Market Dynamics
- 3.1. Market Drivers
- 3.2. Market Restrains
- 3.3. Market Trends
- 3.4. Market Opportunities
- 4. Market Factor Analysis
- 4.1. Porters Five Forces
- 4.1.1. Bargaining Power of Suppliers
- 4.1.2. Bargaining Power of Buyers
- 4.1.3. Threat of New Entrants
- 4.1.4. Threat of Substitutes
- 4.1.5. Competitive Rivalry
- 4.2. PESTEL analysis
- 4.3. BCG Analysis
- 4.3.1. Stars (High Growth, High Market Share)
- 4.3.2. Cash Cows (Low Growth, High Market Share)
- 4.3.3. Question Mark (High Growth, Low Market Share)
- 4.3.4. Dogs (Low Growth, Low Market Share)
- 4.4. Ansoff Matrix Analysis
- 4.5. Supply Chain Analysis
- 4.6. Regulatory Landscape
- 4.7. Current Market Potential and Opportunity Assessment (TAM–SAM–SOM Framework)
- 4.8. MDP Analyst Note
- 4.1. Porters Five Forces
- 5. Market Analysis, Insights and Forecast 2021-2033
- 5.1. Market Analysis, Insights and Forecast - by Service
- 5.1.1. Transportation
- 5.1.2. Warehousing and Inventory management
- 5.1.3. Value-added services (Labeling, Packaging, etc)
- 5.2. Market Analysis, Insights and Forecast - by Business
- 5.2.1. B2B
- 5.2.2. B2C
- 5.3. Market Analysis, Insights and Forecast - by Destination
- 5.3.1. Domestic
- 5.3.2. International/cross-border
- 5.4. Market Analysis, Insights and Forecast - by Product
- 5.4.1. Fashion and Apparel
- 5.4.2. Consumer Electronics
- 5.4.3. Home Appliances
- 5.4.4. Furniture
- 5.4.5. Beauty and Personal Care Products
- 5.4.6. Other Products (Toys, Food Products, etc.)
- 5.5. Market Analysis, Insights and Forecast - by Region
- 5.5.1. North America
- 5.5.2. South America
- 5.5.3. Europe
- 5.5.4. Middle East & Africa
- 5.5.5. Asia Pacific
- 5.1. Market Analysis, Insights and Forecast - by Service
- 6. Global US E-commerce Logistics Industry Analysis, Insights and Forecast, 2021-2033
- 6.1. Market Analysis, Insights and Forecast - by Service
- 6.1.1. Transportation
- 6.1.2. Warehousing and Inventory management
- 6.1.3. Value-added services (Labeling, Packaging, etc)
- 6.2. Market Analysis, Insights and Forecast - by Business
- 6.2.1. B2B
- 6.2.2. B2C
- 6.3. Market Analysis, Insights and Forecast - by Destination
- 6.3.1. Domestic
- 6.3.2. International/cross-border
- 6.4. Market Analysis, Insights and Forecast - by Product
- 6.4.1. Fashion and Apparel
- 6.4.2. Consumer Electronics
- 6.4.3. Home Appliances
- 6.4.4. Furniture
- 6.4.5. Beauty and Personal Care Products
- 6.4.6. Other Products (Toys, Food Products, etc.)
- 6.1. Market Analysis, Insights and Forecast - by Service
- 7. North America US E-commerce Logistics Industry Analysis, Insights and Forecast, 2020-2032
- 7.1. Market Analysis, Insights and Forecast - by Service
- 7.1.1. Transportation
- 7.1.2. Warehousing and Inventory management
- 7.1.3. Value-added services (Labeling, Packaging, etc)
- 7.2. Market Analysis, Insights and Forecast - by Business
- 7.2.1. B2B
- 7.2.2. B2C
- 7.3. Market Analysis, Insights and Forecast - by Destination
- 7.3.1. Domestic
- 7.3.2. International/cross-border
- 7.4. Market Analysis, Insights and Forecast - by Product
- 7.4.1. Fashion and Apparel
- 7.4.2. Consumer Electronics
- 7.4.3. Home Appliances
- 7.4.4. Furniture
- 7.4.5. Beauty and Personal Care Products
- 7.4.6. Other Products (Toys, Food Products, etc.)
- 7.1. Market Analysis, Insights and Forecast - by Service
- 8. South America US E-commerce Logistics Industry Analysis, Insights and Forecast, 2020-2032
- 8.1. Market Analysis, Insights and Forecast - by Service
- 8.1.1. Transportation
- 8.1.2. Warehousing and Inventory management
- 8.1.3. Value-added services (Labeling, Packaging, etc)
- 8.2. Market Analysis, Insights and Forecast - by Business
- 8.2.1. B2B
- 8.2.2. B2C
- 8.3. Market Analysis, Insights and Forecast - by Destination
- 8.3.1. Domestic
- 8.3.2. International/cross-border
- 8.4. Market Analysis, Insights and Forecast - by Product
- 8.4.1. Fashion and Apparel
- 8.4.2. Consumer Electronics
- 8.4.3. Home Appliances
- 8.4.4. Furniture
- 8.4.5. Beauty and Personal Care Products
- 8.4.6. Other Products (Toys, Food Products, etc.)
- 8.1. Market Analysis, Insights and Forecast - by Service
- 9. Europe US E-commerce Logistics Industry Analysis, Insights and Forecast, 2020-2032
- 9.1. Market Analysis, Insights and Forecast - by Service
- 9.1.1. Transportation
- 9.1.2. Warehousing and Inventory management
- 9.1.3. Value-added services (Labeling, Packaging, etc)
- 9.2. Market Analysis, Insights and Forecast - by Business
- 9.2.1. B2B
- 9.2.2. B2C
- 9.3. Market Analysis, Insights and Forecast - by Destination
- 9.3.1. Domestic
- 9.3.2. International/cross-border
- 9.4. Market Analysis, Insights and Forecast - by Product
- 9.4.1. Fashion and Apparel
- 9.4.2. Consumer Electronics
- 9.4.3. Home Appliances
- 9.4.4. Furniture
- 9.4.5. Beauty and Personal Care Products
- 9.4.6. Other Products (Toys, Food Products, etc.)
- 9.1. Market Analysis, Insights and Forecast - by Service
- 10. Middle East & Africa US E-commerce Logistics Industry Analysis, Insights and Forecast, 2020-2032
- 10.1. Market Analysis, Insights and Forecast - by Service
- 10.1.1. Transportation
- 10.1.2. Warehousing and Inventory management
- 10.1.3. Value-added services (Labeling, Packaging, etc)
- 10.2. Market Analysis, Insights and Forecast - by Business
- 10.2.1. B2B
- 10.2.2. B2C
- 10.3. Market Analysis, Insights and Forecast - by Destination
- 10.3.1. Domestic
- 10.3.2. International/cross-border
- 10.4. Market Analysis, Insights and Forecast - by Product
- 10.4.1. Fashion and Apparel
- 10.4.2. Consumer Electronics
- 10.4.3. Home Appliances
- 10.4.4. Furniture
- 10.4.5. Beauty and Personal Care Products
- 10.4.6. Other Products (Toys, Food Products, etc.)
- 10.1. Market Analysis, Insights and Forecast - by Service
- 11. Asia Pacific US E-commerce Logistics Industry Analysis, Insights and Forecast, 2020-2032
- 11.1. Market Analysis, Insights and Forecast - by Service
- 11.1.1. Transportation
- 11.1.2. Warehousing and Inventory management
- 11.1.3. Value-added services (Labeling, Packaging, etc)
- 11.2. Market Analysis, Insights and Forecast - by Business
- 11.2.1. B2B
- 11.2.2. B2C
- 11.3. Market Analysis, Insights and Forecast - by Destination
- 11.3.1. Domestic
- 11.3.2. International/cross-border
- 11.4. Market Analysis, Insights and Forecast - by Product
- 11.4.1. Fashion and Apparel
- 11.4.2. Consumer Electronics
- 11.4.3. Home Appliances
- 11.4.4. Furniture
- 11.4.5. Beauty and Personal Care Products
- 11.4.6. Other Products (Toys, Food Products, etc.)
- 11.1. Market Analysis, Insights and Forecast - by Service
- 12. Competitive Analysis
- 12.1. Company Profiles
- 12.1.1 DB Schenker
- 12.1.1.1. Company Overview
- 12.1.1.2. Products
- 12.1.1.3. Company Financials
- 12.1.1.4. SWOT Analysis
- 12.1.2 DHL Logistics
- 12.1.2.1. Company Overview
- 12.1.2.2. Products
- 12.1.2.3. Company Financials
- 12.1.2.4. SWOT Analysis
- 12.1.3 Saddle Creek Logistics
- 12.1.3.1. Company Overview
- 12.1.3.2. Products
- 12.1.3.3. Company Financials
- 12.1.3.4. SWOT Analysis
- 12.1.4 UPS Supply Chain Solutions
- 12.1.4.1. Company Overview
- 12.1.4.2. Products
- 12.1.4.3. Company Financials
- 12.1.4.4. SWOT Analysis
- 12.1.5 XPO Logistics
- 12.1.5.1. Company Overview
- 12.1.5.2. Products
- 12.1.5.3. Company Financials
- 12.1.5.4. SWOT Analysis
- 12.1.6 Rakuten Super Logistics
- 12.1.6.1. Company Overview
- 12.1.6.2. Products
- 12.1.6.3. Company Financials
- 12.1.6.4. SWOT Analysis
- 12.1.7 FedEx
- 12.1.7.1. Company Overview
- 12.1.7.2. Products
- 12.1.7.3. Company Financials
- 12.1.7.4. SWOT Analysis
- 12.1.8 Geodis Logistics
- 12.1.8.1. Company Overview
- 12.1.8.2. Products
- 12.1.8.3. Company Financials
- 12.1.8.4. SWOT Analysis
- 12.1.9 Kenco Logistics Services
- 12.1.9.1. Company Overview
- 12.1.9.2. Products
- 12.1.9.3. Company Financials
- 12.1.9.4. SWOT Analysis
- 12.1.10 Kuehne and Nagel Logistics**List Not Exhaustive
- 12.1.10.1. Company Overview
- 12.1.10.2. Products
- 12.1.10.3. Company Financials
- 12.1.10.4. SWOT Analysis
- 12.1.1 DB Schenker
- 12.2. Market Entropy
- 12.2.1 Company's Key Areas Served
- 12.2.2 Recent Developments
- 12.3. Company Market Share Analysis 2025
- 12.3.1 Top 5 Companies Market Share Analysis
- 12.3.2 Top 3 Companies Market Share Analysis
- 12.4. List of Potential Customers
- 13. Research Methodology
List of Figures
- Figure 1: Global US E-commerce Logistics Industry Revenue Breakdown (Million, %) by Region 2025 & 2033
- Figure 2: North America US E-commerce Logistics Industry Revenue (Million), by Service 2025 & 2033
- Figure 3: North America US E-commerce Logistics Industry Revenue Share (%), by Service 2025 & 2033
- Figure 4: North America US E-commerce Logistics Industry Revenue (Million), by Business 2025 & 2033
- Figure 5: North America US E-commerce Logistics Industry Revenue Share (%), by Business 2025 & 2033
- Figure 6: North America US E-commerce Logistics Industry Revenue (Million), by Destination 2025 & 2033
- Figure 7: North America US E-commerce Logistics Industry Revenue Share (%), by Destination 2025 & 2033
- Figure 8: North America US E-commerce Logistics Industry Revenue (Million), by Product 2025 & 2033
- Figure 9: North America US E-commerce Logistics Industry Revenue Share (%), by Product 2025 & 2033
- Figure 10: North America US E-commerce Logistics Industry Revenue (Million), by Country 2025 & 2033
- Figure 11: North America US E-commerce Logistics Industry Revenue Share (%), by Country 2025 & 2033
- Figure 12: South America US E-commerce Logistics Industry Revenue (Million), by Service 2025 & 2033
- Figure 13: South America US E-commerce Logistics Industry Revenue Share (%), by Service 2025 & 2033
- Figure 14: South America US E-commerce Logistics Industry Revenue (Million), by Business 2025 & 2033
- Figure 15: South America US E-commerce Logistics Industry Revenue Share (%), by Business 2025 & 2033
- Figure 16: South America US E-commerce Logistics Industry Revenue (Million), by Destination 2025 & 2033
- Figure 17: South America US E-commerce Logistics Industry Revenue Share (%), by Destination 2025 & 2033
- Figure 18: South America US E-commerce Logistics Industry Revenue (Million), by Product 2025 & 2033
- Figure 19: South America US E-commerce Logistics Industry Revenue Share (%), by Product 2025 & 2033
- Figure 20: South America US E-commerce Logistics Industry Revenue (Million), by Country 2025 & 2033
- Figure 21: South America US E-commerce Logistics Industry Revenue Share (%), by Country 2025 & 2033
- Figure 22: Europe US E-commerce Logistics Industry Revenue (Million), by Service 2025 & 2033
- Figure 23: Europe US E-commerce Logistics Industry Revenue Share (%), by Service 2025 & 2033
- Figure 24: Europe US E-commerce Logistics Industry Revenue (Million), by Business 2025 & 2033
- Figure 25: Europe US E-commerce Logistics Industry Revenue Share (%), by Business 2025 & 2033
- Figure 26: Europe US E-commerce Logistics Industry Revenue (Million), by Destination 2025 & 2033
- Figure 27: Europe US E-commerce Logistics Industry Revenue Share (%), by Destination 2025 & 2033
- Figure 28: Europe US E-commerce Logistics Industry Revenue (Million), by Product 2025 & 2033
- Figure 29: Europe US E-commerce Logistics Industry Revenue Share (%), by Product 2025 & 2033
- Figure 30: Europe US E-commerce Logistics Industry Revenue (Million), by Country 2025 & 2033
- Figure 31: Europe US E-commerce Logistics Industry Revenue Share (%), by Country 2025 & 2033
- Figure 32: Middle East & Africa US E-commerce Logistics Industry Revenue (Million), by Service 2025 & 2033
- Figure 33: Middle East & Africa US E-commerce Logistics Industry Revenue Share (%), by Service 2025 & 2033
- Figure 34: Middle East & Africa US E-commerce Logistics Industry Revenue (Million), by Business 2025 & 2033
- Figure 35: Middle East & Africa US E-commerce Logistics Industry Revenue Share (%), by Business 2025 & 2033
- Figure 36: Middle East & Africa US E-commerce Logistics Industry Revenue (Million), by Destination 2025 & 2033
- Figure 37: Middle East & Africa US E-commerce Logistics Industry Revenue Share (%), by Destination 2025 & 2033
- Figure 38: Middle East & Africa US E-commerce Logistics Industry Revenue (Million), by Product 2025 & 2033
- Figure 39: Middle East & Africa US E-commerce Logistics Industry Revenue Share (%), by Product 2025 & 2033
- Figure 40: Middle East & Africa US E-commerce Logistics Industry Revenue (Million), by Country 2025 & 2033
- Figure 41: Middle East & Africa US E-commerce Logistics Industry Revenue Share (%), by Country 2025 & 2033
- Figure 42: Asia Pacific US E-commerce Logistics Industry Revenue (Million), by Service 2025 & 2033
- Figure 43: Asia Pacific US E-commerce Logistics Industry Revenue Share (%), by Service 2025 & 2033
- Figure 44: Asia Pacific US E-commerce Logistics Industry Revenue (Million), by Business 2025 & 2033
- Figure 45: Asia Pacific US E-commerce Logistics Industry Revenue Share (%), by Business 2025 & 2033
- Figure 46: Asia Pacific US E-commerce Logistics Industry Revenue (Million), by Destination 2025 & 2033
- Figure 47: Asia Pacific US E-commerce Logistics Industry Revenue Share (%), by Destination 2025 & 2033
- Figure 48: Asia Pacific US E-commerce Logistics Industry Revenue (Million), by Product 2025 & 2033
- Figure 49: Asia Pacific US E-commerce Logistics Industry Revenue Share (%), by Product 2025 & 2033
- Figure 50: Asia Pacific US E-commerce Logistics Industry Revenue (Million), by Country 2025 & 2033
- Figure 51: Asia Pacific US E-commerce Logistics Industry Revenue Share (%), by Country 2025 & 2033
List of Tables
- Table 1: Global US E-commerce Logistics Industry Revenue Million Forecast, by Service 2020 & 2033
- Table 2: Global US E-commerce Logistics Industry Revenue Million Forecast, by Business 2020 & 2033
- Table 3: Global US E-commerce Logistics Industry Revenue Million Forecast, by Destination 2020 & 2033
- Table 4: Global US E-commerce Logistics Industry Revenue Million Forecast, by Product 2020 & 2033
- Table 5: Global US E-commerce Logistics Industry Revenue Million Forecast, by Region 2020 & 2033
- Table 6: Global US E-commerce Logistics Industry Revenue Million Forecast, by Service 2020 & 2033
- Table 7: Global US E-commerce Logistics Industry Revenue Million Forecast, by Business 2020 & 2033
- Table 8: Global US E-commerce Logistics Industry Revenue Million Forecast, by Destination 2020 & 2033
- Table 9: Global US E-commerce Logistics Industry Revenue Million Forecast, by Product 2020 & 2033
- Table 10: Global US E-commerce Logistics Industry Revenue Million Forecast, by Country 2020 & 2033
- Table 11: United States US E-commerce Logistics Industry Revenue (Million) Forecast, by Application 2020 & 2033
- Table 12: Canada US E-commerce Logistics Industry Revenue (Million) Forecast, by Application 2020 & 2033
- Table 13: Mexico US E-commerce Logistics Industry Revenue (Million) Forecast, by Application 2020 & 2033
- Table 14: Global US E-commerce Logistics Industry Revenue Million Forecast, by Service 2020 & 2033
- Table 15: Global US E-commerce Logistics Industry Revenue Million Forecast, by Business 2020 & 2033
- Table 16: Global US E-commerce Logistics Industry Revenue Million Forecast, by Destination 2020 & 2033
- Table 17: Global US E-commerce Logistics Industry Revenue Million Forecast, by Product 2020 & 2033
- Table 18: Global US E-commerce Logistics Industry Revenue Million Forecast, by Country 2020 & 2033
- Table 19: Brazil US E-commerce Logistics Industry Revenue (Million) Forecast, by Application 2020 & 2033
- Table 20: Argentina US E-commerce Logistics Industry Revenue (Million) Forecast, by Application 2020 & 2033
- Table 21: Rest of South America US E-commerce Logistics Industry Revenue (Million) Forecast, by Application 2020 & 2033
- Table 22: Global US E-commerce Logistics Industry Revenue Million Forecast, by Service 2020 & 2033
- Table 23: Global US E-commerce Logistics Industry Revenue Million Forecast, by Business 2020 & 2033
- Table 24: Global US E-commerce Logistics Industry Revenue Million Forecast, by Destination 2020 & 2033
- Table 25: Global US E-commerce Logistics Industry Revenue Million Forecast, by Product 2020 & 2033
- Table 26: Global US E-commerce Logistics Industry Revenue Million Forecast, by Country 2020 & 2033
- Table 27: United Kingdom US E-commerce Logistics Industry Revenue (Million) Forecast, by Application 2020 & 2033
- Table 28: Germany US E-commerce Logistics Industry Revenue (Million) Forecast, by Application 2020 & 2033
- Table 29: France US E-commerce Logistics Industry Revenue (Million) Forecast, by Application 2020 & 2033
- Table 30: Italy US E-commerce Logistics Industry Revenue (Million) Forecast, by Application 2020 & 2033
- Table 31: Spain US E-commerce Logistics Industry Revenue (Million) Forecast, by Application 2020 & 2033
- Table 32: Russia US E-commerce Logistics Industry Revenue (Million) Forecast, by Application 2020 & 2033
- Table 33: Benelux US E-commerce Logistics Industry Revenue (Million) Forecast, by Application 2020 & 2033
- Table 34: Nordics US E-commerce Logistics Industry Revenue (Million) Forecast, by Application 2020 & 2033
- Table 35: Rest of Europe US E-commerce Logistics Industry Revenue (Million) Forecast, by Application 2020 & 2033
- Table 36: Global US E-commerce Logistics Industry Revenue Million Forecast, by Service 2020 & 2033
- Table 37: Global US E-commerce Logistics Industry Revenue Million Forecast, by Business 2020 & 2033
- Table 38: Global US E-commerce Logistics Industry Revenue Million Forecast, by Destination 2020 & 2033
- Table 39: Global US E-commerce Logistics Industry Revenue Million Forecast, by Product 2020 & 2033
- Table 40: Global US E-commerce Logistics Industry Revenue Million Forecast, by Country 2020 & 2033
- Table 41: Turkey US E-commerce Logistics Industry Revenue (Million) Forecast, by Application 2020 & 2033
- Table 42: Israel US E-commerce Logistics Industry Revenue (Million) Forecast, by Application 2020 & 2033
- Table 43: GCC US E-commerce Logistics Industry Revenue (Million) Forecast, by Application 2020 & 2033
- Table 44: North Africa US E-commerce Logistics Industry Revenue (Million) Forecast, by Application 2020 & 2033
- Table 45: South Africa US E-commerce Logistics Industry Revenue (Million) Forecast, by Application 2020 & 2033
- Table 46: Rest of Middle East & Africa US E-commerce Logistics Industry Revenue (Million) Forecast, by Application 2020 & 2033
- Table 47: Global US E-commerce Logistics Industry Revenue Million Forecast, by Service 2020 & 2033
- Table 48: Global US E-commerce Logistics Industry Revenue Million Forecast, by Business 2020 & 2033
- Table 49: Global US E-commerce Logistics Industry Revenue Million Forecast, by Destination 2020 & 2033
- Table 50: Global US E-commerce Logistics Industry Revenue Million Forecast, by Product 2020 & 2033
- Table 51: Global US E-commerce Logistics Industry Revenue Million Forecast, by Country 2020 & 2033
- Table 52: China US E-commerce Logistics Industry Revenue (Million) Forecast, by Application 2020 & 2033
- Table 53: India US E-commerce Logistics Industry Revenue (Million) Forecast, by Application 2020 & 2033
- Table 54: Japan US E-commerce Logistics Industry Revenue (Million) Forecast, by Application 2020 & 2033
- Table 55: South Korea US E-commerce Logistics Industry Revenue (Million) Forecast, by Application 2020 & 2033
- Table 56: ASEAN US E-commerce Logistics Industry Revenue (Million) Forecast, by Application 2020 & 2033
- Table 57: Oceania US E-commerce Logistics Industry Revenue (Million) Forecast, by Application 2020 & 2033
- Table 58: Rest of Asia Pacific US E-commerce Logistics Industry Revenue (Million) Forecast, by Application 2020 & 2033
Frequently Asked Questions
1. What is the projected Compound Annual Growth Rate (CAGR) of the US E-commerce Logistics Industry?
The projected CAGR is approximately 8.90%.
2. Which companies are prominent players in the US E-commerce Logistics Industry?
Key companies in the market include DB Schenker, DHL Logistics, Saddle Creek Logistics, UPS Supply Chain Solutions, XPO Logistics, Rakuten Super Logistics, FedEx, Geodis Logistics, Kenco Logistics Services, Kuehne and Nagel Logistics**List Not Exhaustive.
3. What are the main segments of the US E-commerce Logistics Industry?
The market segments include Service, Business, Destination, Product.
4. Can you provide details about the market size?
The market size is estimated to be USD 129.54 Million as of 2022.
5. What are some drivers contributing to market growth?
Rise In Cross Border Logistics; Upgrade e-commerce with new supply chain technology.
6. What are the notable trends driving market growth?
Upgrade e-commerce with new supply chain technology.
7. Are there any restraints impacting market growth?
Supply Chain Disruptions; Warehousing and Inventory management.
8. Can you provide examples of recent developments in the market?
August 2023: A new distribution center has been opened by DHL eCommerce as part of its five-year strategic growth plan. The new facility, located in the city of Melrose Park in Illinois, encompasses a total area of 352,000 square feet. In addition to capacity enhancement, the facility is equipped with an Automated Honeywell Cross-belt Loop Sorter, which is capable of handling up to forty thousand parcels and packages an hour. As part of the logistics provider's recent expansion, 11 warehouses have been constructed or relocated, and seven more are expected to be finished at some point in the near future, as reported by the sources.
9. What pricing options are available for accessing the report?
Pricing options include single-user, multi-user, and enterprise licenses priced at USD 3800, USD 4500, and USD 5800 respectively.
10. Is the market size provided in terms of value or volume?
The market size is provided in terms of value, measured in Million.
11. Are there any specific market keywords associated with the report?
Yes, the market keyword associated with the report is "US E-commerce Logistics Industry," which aids in identifying and referencing the specific market segment covered.
12. How do I determine which pricing option suits my needs best?
The pricing options vary based on user requirements and access needs. Individual users may opt for single-user licenses, while businesses requiring broader access may choose multi-user or enterprise licenses for cost-effective access to the report.
13. Are there any additional resources or data provided in the US E-commerce Logistics Industry report?
While the report offers comprehensive insights, it's advisable to review the specific contents or supplementary materials provided to ascertain if additional resources or data are available.
14. How can I stay updated on further developments or reports in the US E-commerce Logistics Industry?
To stay informed about further developments, trends, and reports in the US E-commerce Logistics Industry, consider subscribing to industry newsletters, following relevant companies and organizations, or regularly checking reputable industry news sources and publications.
Methodology
Step 1 - Identification of Relevant Samples Size from Population Database


Step 2 - Approaches for Defining Global Market Size (Value, Volume* & Price*)

Note*: In applicable scenarios
Step 3 - Data Sources
Primary Research
- Web Analytics
- Survey Reports
- Research Institute
- Latest Research Reports
- Opinion Leaders
Secondary Research
- Annual Reports
- White Paper
- Latest Press Release
- Industry Association
- Paid Database
- Investor Presentations

Step 4 - Data Triangulation
Involves using different sources of information in order to increase the validity of a study
These sources are likely to be stakeholders in a program - participants, other researchers, program staff, other community members, and so on.
Then we put all data in single framework & apply various statistical tools to find out the dynamic on the market.
During the analysis stage, feedback from the stakeholder groups would be compared to determine areas of agreement as well as areas of divergence