

Key Insights
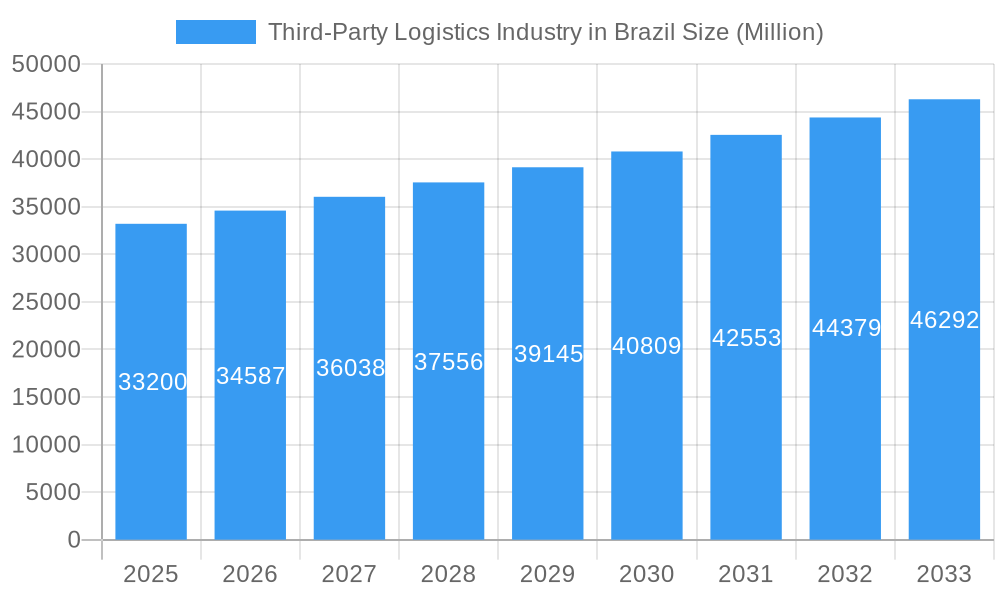
The Brazilian third-party logistics (3PL) market, valued at $33.20 billion in 2025, is experiencing robust growth, projected to expand at a compound annual growth rate (CAGR) of 4.26% from 2025 to 2033. This growth is fueled by several key factors. The burgeoning e-commerce sector in Brazil demands efficient and scalable logistics solutions, driving increased adoption of 3PL services. Simultaneously, the increasing complexity of supply chains, particularly for industries like automotive, chemicals, and consumer goods, necessitates outsourcing logistics functions to specialized providers. Furthermore, Brazilian companies are increasingly prioritizing cost optimization and efficiency improvements, leading them to leverage the expertise and economies of scale offered by 3PL providers. The market is segmented by service type (domestic transportation management, international transportation management, value-added warehousing and distribution) and end-user industry (automobile, chemicals, consumer and retail, energy, engineering and manufacturing, life science and healthcare, and others). Major players like DB Schenker, CEVA Logistics, and Kuehne + Nagel are competing in this dynamic market, constantly innovating to offer advanced solutions such as integrated technology platforms and optimized supply chain management strategies.
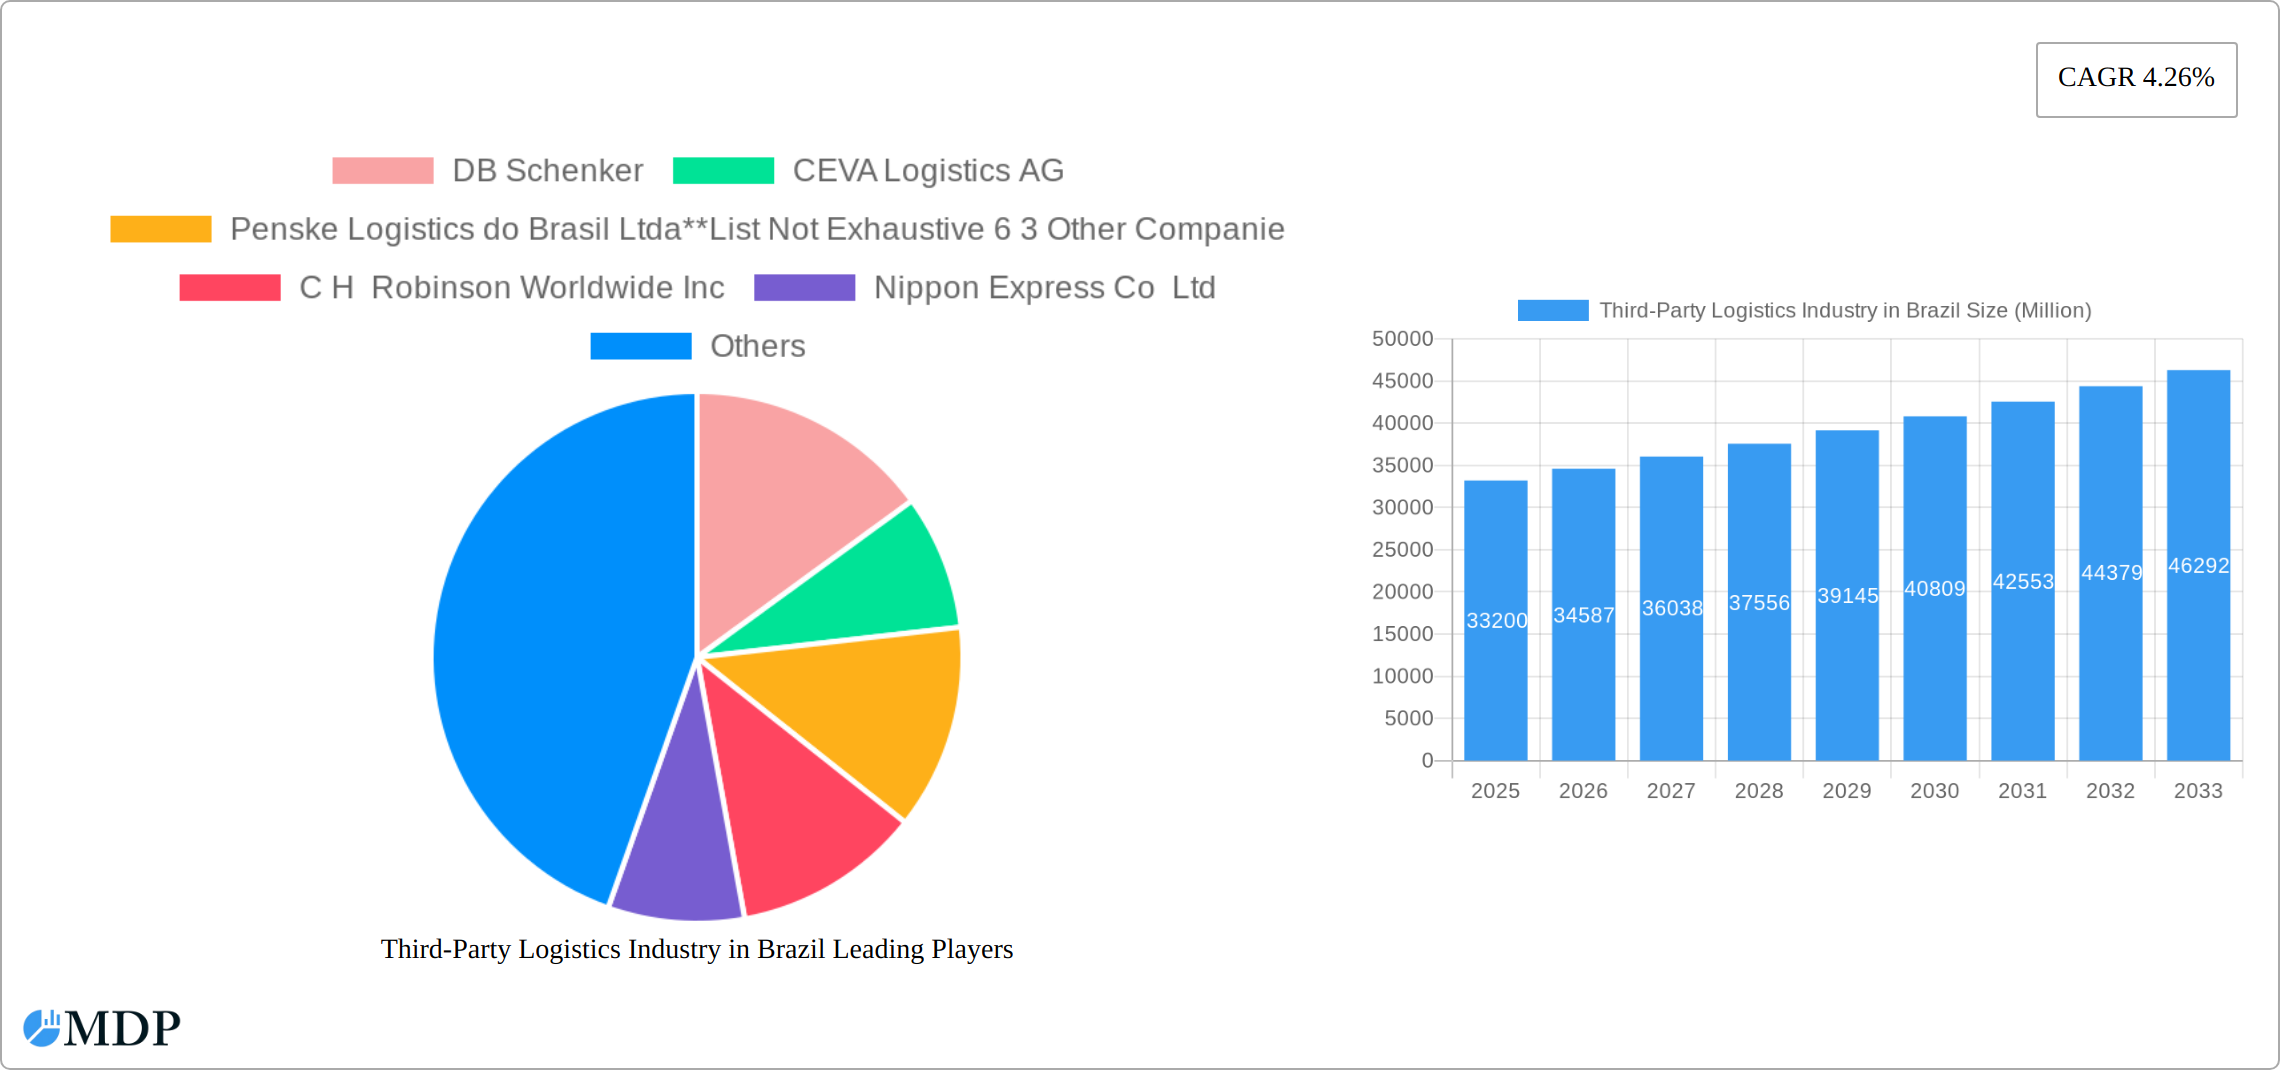
Third-Party Logistics Industry in Brazil Market Size (In Billion)
The competitive landscape is characterized by both established multinational corporations and smaller, regional players. The success of 3PL providers will hinge on their ability to adapt to evolving market demands, including the increasing integration of technology, the growth of sustainable logistics practices, and the ongoing need for enhanced supply chain resilience and flexibility. Expansion into underserved regions, investment in advanced technologies like AI and automation, and a strong focus on customer relationship management will be critical differentiators for growth in the Brazilian 3PL market. The continuing expansion of Brazil's economy and its growing integration into global trade flows will only further augment the market's future prospects, promising continued significant growth throughout the forecast period.
Third-Party Logistics Industry in Brazil Company Market Share
Brazil's Booming Third-Party Logistics (3PL) Market: A Comprehensive Report (2019-2033)
This in-depth report provides a comprehensive analysis of Brazil's dynamic third-party logistics (3PL) industry, offering invaluable insights for stakeholders, investors, and industry professionals. With a detailed forecast spanning from 2025 to 2033 (study period: 2019-2033, base year: 2025, estimated year: 2025), this report unveils the market's growth trajectory, key players, and emerging opportunities. The analysis covers key segments like Domestic Transportation Management, International Transportation Management, and Value-added Warehousing & Distribution, across diverse end-user industries including Automobile, Chemicals, Consumer & Retail, Energy, Engineering & Manufacturing, Life Sciences & Healthcare, and others. The report is packed with actionable insights and data-driven projections, helping you navigate the complexities of this rapidly evolving market. Expect detailed breakdowns on market size (in Millions), CAGR, market share, and M&A activity, along with in-depth analysis of key trends and challenges.
Third-Party Logistics Industry in Brazil Market Dynamics & Concentration
Brazil's 3PL market is experiencing robust growth, driven by factors such as e-commerce expansion, increasing outsourcing trends, and the nation's strategic geographic location. Market concentration is moderate, with several major players holding significant shares, but a fragmented landscape offering opportunities for smaller players to establish themselves. Innovation in logistics technology is a major driver, while regulatory frameworks and potential changes remain a key factor to consider. Product substitutes are relatively limited, given the specialized nature of 3PL services. End-user trends, particularly towards increased supply chain efficiency and cost optimization, fuel the demand for 3PL services. Mergers and acquisitions (M&A) activity has been noteworthy in recent years, with approximately xx M&A deals recorded between 2019 and 2024, consolidating market share among leading players. Key players such as DB Schenker and Kuehne + Nagel have strategically expanded their presence to leverage growing market opportunities. The estimated market size in 2025 is projected at xx Million, and based on current growth trends, we project a xx% CAGR for the forecast period.
- Market Share: Top 5 players hold approximately xx% of the market.
- M&A Deal Count (2019-2024): xx
- Average Deal Size (2019-2024): xx Million
Third-Party Logistics Industry in Brazil Industry Trends & Analysis
The Brazilian 3PL market exhibits substantial growth potential, fueled by increasing e-commerce penetration, a burgeoning middle class with rising consumption, and government initiatives aimed at infrastructure improvement. Technological disruptions, such as the adoption of advanced analytics, automation, and blockchain technology, are streamlining operations and boosting efficiency. Consumer preferences for faster delivery times and enhanced transparency are shaping 3PL service offerings. Competitive dynamics are characterized by both price competition and differentiation through specialized services and technological capabilities. The market is projected to reach xx Million by 2033, exhibiting a significant CAGR of xx% during the forecast period (2025-2033). Market penetration of 3PL services is expected to increase from the current xx% to xx% by 2033. This growth is further supported by the rising demand for integrated logistics solutions, encompassing warehousing, transportation, and value-added services.
Leading Markets & Segments in Third-Party Logistics Industry in Brazil
The Southeast region remains the powerhouse of the Brazilian 3PL market, fueled by its immense population density, thriving industrial ecosystem, and sophisticated infrastructure. Within the service spectrum, Domestic Transportation Management continues to command the largest market share, closely followed by advanced Value-added Warehousing and Distribution solutions. The Consumer and Retail sector stands as the leading end-user segment, a testament to the explosive growth of e-commerce and the sustained rise in consumer expenditure.
Key Drivers for Market Dominance:
- Geographic Concentration: The Southeast region's strategic advantage is amplified by its concentration of population centers, critical industrial hubs, and a well-developed, integrated transportation infrastructure.
- Domestic Transportation Management: The sheer scale of Brazil's domestic market, coupled with an extensive and increasingly modernized road network, underpins the dominance of this segment.
- Consumer & Retail Growth: The unprecedented expansion of e-commerce and the escalating demand for swift, dependable delivery services are primary catalysts for the retail sector's leading position.
Analysis of Dominance: The unparalleled influence of the Southeast region is a direct consequence of its strategic proximity to major international ports and airports, the presence of established industrial clusters, and a highly developed network of road and rail, all of which are crucial for optimizing logistics operations. The ascendancy of the Consumer & Retail sector is predominantly driven by the meteoric rise of e-commerce and the escalating consumer need for efficient and trustworthy delivery solutions.
Third-Party Logistics Industry in Brazil Product Developments
The Brazilian 3PL sector is currently experiencing a surge in product innovation, marked by the widespread implementation of cutting-edge Warehouse Management Systems (WMS) and sophisticated Transportation Management Systems (TMS). The integration of Internet of Things (IoT) devices is also a significant trend, enabling real-time tracking and enhanced monitoring capabilities across supply chains. These technological advancements are not merely improving operational efficiency, transparency, and visibility but are also providing 3PL providers with crucial competitive advantages. The market is increasingly favoring integrated solutions that offer a holistic suite of services, encompassing warehousing, transportation, and a range of value-added services. This integrated approach is instrumental in creating greater end-to-end visibility and control throughout the entire logistics process, thereby delivering substantial value to clients.
Key Drivers of Third-Party Logistics Industry in Brazil Growth
The growth of Brazil's 3PL sector is fueled by several key factors. Technological advancements, such as AI-powered route optimization and predictive analytics, significantly improve efficiency and cost-effectiveness. Government initiatives focusing on infrastructure development and trade liberalization facilitate smoother logistics operations. Furthermore, increasing e-commerce adoption and the expanding manufacturing sector drive demand for reliable and efficient logistics solutions.
Challenges in the Third-Party Logistics Industry in Brazil Market
The Brazilian 3PL market faces challenges such as bureaucratic complexities, infrastructure limitations in certain regions, and fluctuating fuel prices impacting operational costs. These issues can lead to delays, increased expenses, and reduced profitability. Intense competition among established players and new entrants further adds to the pressure. The impact of these challenges is estimated to reduce annual market growth by approximately xx% annually.
Emerging Opportunities in Third-Party Logistics Industry in Brazil
The long-term growth trajectory for the Brazilian 3PL industry is significantly influenced by the adoption of transformative technologies such as blockchain, which promises enhanced security and unparalleled transparency in transactions. Furthermore, there is a growing demand for the development of specialized 3PL solutions tailored to the unique needs of specific industries, including the critical sector of cold chain logistics for perishable goods. To capitalize on these opportunities, strategic alliances and partnerships between 3PL providers and leading technology companies are expected to become increasingly vital. These collaborations will serve as powerful engines for driving innovation, fostering market expansion, and developing next-generation logistics capabilities.
Leading Players in the Third-Party Logistics Industry in Brazil Sector
- DB Schenker
- CEVA Logistics AG
- Penske Logistics do Brasil Ltda
- 6 3 Other Companies
- C.H. Robinson Worldwide Inc
- Nippon Express Co Ltd
- Kuehne + Nagel International AG
- FedEx
- BBM Logística SA
- DSV AS
- Deutsche Post AG
- Gafor SA
Key Milestones in Third-Party Logistics Industry in Brazil Industry
- 2020: A notable acceleration in the adoption of advanced digital technologies across the entire logistics sector.
- 2021: Significant capital investments were directed towards warehouse automation by prominent industry players.
- 2022: The market witnessed the successful launch of several innovative and integrated logistics platforms.
- 2023: A discernible increase in the adoption and implementation of sustainable logistics practices.
- 2024: The competitive landscape underwent significant shifts due to several key Mergers & Acquisitions (M&A) activities.
Strategic Outlook for Third-Party Logistics Industry in Brazil Market
Brazil's 3PL market holds significant future potential driven by continued e-commerce expansion, infrastructural development, and the increasing focus on supply chain optimization. Strategic partnerships, technological innovation, and expansion into underserved regions will be key growth accelerators. The market's long-term prospects are positive, with opportunities for both established players and new entrants to capitalize on this dynamic and rapidly growing sector.
Third-Party Logistics Industry in Brazil Segmentation
-
1. Services
- 1.1. Domestic Transportation Management
- 1.2. International Transportation Management
- 1.3. Value-added Warehousing and Distribution
-
2. End User
- 2.1. Automobile
- 2.2. Chemicals
- 2.3. Consumer and Retail
- 2.4. Energy
- 2.5. Engineering and Manufacturing
- 2.6. Life Science and Healthcare
- 2.7. Other End User
Third-Party Logistics Industry in Brazil Segmentation By Geography
-
1. North America
- 1.1. United States
- 1.2. Canada
- 1.3. Mexico
-
2. South America
- 2.1. Brazil
- 2.2. Argentina
- 2.3. Rest of South America
-
3. Europe
- 3.1. United Kingdom
- 3.2. Germany
- 3.3. France
- 3.4. Italy
- 3.5. Spain
- 3.6. Russia
- 3.7. Benelux
- 3.8. Nordics
- 3.9. Rest of Europe
-
4. Middle East & Africa
- 4.1. Turkey
- 4.2. Israel
- 4.3. GCC
- 4.4. North Africa
- 4.5. South Africa
- 4.6. Rest of Middle East & Africa
-
5. Asia Pacific
- 5.1. China
- 5.2. India
- 5.3. Japan
- 5.4. South Korea
- 5.5. ASEAN
- 5.6. Oceania
- 5.7. Rest of Asia Pacific
Third-Party Logistics Industry in Brazil Regional Market Share
Geographic Coverage of Third-Party Logistics Industry in Brazil
Third-Party Logistics Industry in Brazil REPORT HIGHLIGHTS
| Aspects | Details |
|---|---|
| Study Period | 2020-2034 |
| Base Year | 2025 |
| Estimated Year | 2026 |
| Forecast Period | 2026-2034 |
| Historical Period | 2020-2025 |
| Growth Rate | CAGR of 4.26% from 2020-2034 |
| Segmentation |
|
Table of Contents
- 1. Introduction
- 1.1. Research Scope
- 1.2. Market Segmentation
- 1.3. Research Objective
- 1.4. Definitions and Assumptions
- 2. Executive Summary
- 2.1. Market Snapshot
- 3. Market Dynamics
- 3.1. Market Drivers
- 3.2. Market Restrains
- 3.3. Market Trends
- 3.4. Market Opportunities
- 4. Market Factor Analysis
- 4.1. Porters Five Forces
- 4.1.1. Bargaining Power of Suppliers
- 4.1.2. Bargaining Power of Buyers
- 4.1.3. Threat of New Entrants
- 4.1.4. Threat of Substitutes
- 4.1.5. Competitive Rivalry
- 4.2. PESTEL analysis
- 4.3. BCG Analysis
- 4.3.1. Stars (High Growth, High Market Share)
- 4.3.2. Cash Cows (Low Growth, High Market Share)
- 4.3.3. Question Mark (High Growth, Low Market Share)
- 4.3.4. Dogs (Low Growth, Low Market Share)
- 4.4. Ansoff Matrix Analysis
- 4.5. Supply Chain Analysis
- 4.6. Regulatory Landscape
- 4.7. Current Market Potential and Opportunity Assessment (TAM–SAM–SOM Framework)
- 4.8. MDP Analyst Note
- 4.1. Porters Five Forces
- 5. Market Analysis, Insights and Forecast 2021-2033
- 5.1. Market Analysis, Insights and Forecast - by Services
- 5.1.1. Domestic Transportation Management
- 5.1.2. International Transportation Management
- 5.1.3. Value-added Warehousing and Distribution
- 5.2. Market Analysis, Insights and Forecast - by End User
- 5.2.1. Automobile
- 5.2.2. Chemicals
- 5.2.3. Consumer and Retail
- 5.2.4. Energy
- 5.2.5. Engineering and Manufacturing
- 5.2.6. Life Science and Healthcare
- 5.2.7. Other End User
- 5.3. Market Analysis, Insights and Forecast - by Region
- 5.3.1. North America
- 5.3.2. South America
- 5.3.3. Europe
- 5.3.4. Middle East & Africa
- 5.3.5. Asia Pacific
- 5.1. Market Analysis, Insights and Forecast - by Services
- 6. Global Third-Party Logistics Industry in Brazil Analysis, Insights and Forecast, 2021-2033
- 6.1. Market Analysis, Insights and Forecast - by Services
- 6.1.1. Domestic Transportation Management
- 6.1.2. International Transportation Management
- 6.1.3. Value-added Warehousing and Distribution
- 6.2. Market Analysis, Insights and Forecast - by End User
- 6.2.1. Automobile
- 6.2.2. Chemicals
- 6.2.3. Consumer and Retail
- 6.2.4. Energy
- 6.2.5. Engineering and Manufacturing
- 6.2.6. Life Science and Healthcare
- 6.2.7. Other End User
- 6.1. Market Analysis, Insights and Forecast - by Services
- 7. North America Third-Party Logistics Industry in Brazil Analysis, Insights and Forecast, 2020-2032
- 7.1. Market Analysis, Insights and Forecast - by Services
- 7.1.1. Domestic Transportation Management
- 7.1.2. International Transportation Management
- 7.1.3. Value-added Warehousing and Distribution
- 7.2. Market Analysis, Insights and Forecast - by End User
- 7.2.1. Automobile
- 7.2.2. Chemicals
- 7.2.3. Consumer and Retail
- 7.2.4. Energy
- 7.2.5. Engineering and Manufacturing
- 7.2.6. Life Science and Healthcare
- 7.2.7. Other End User
- 7.1. Market Analysis, Insights and Forecast - by Services
- 8. South America Third-Party Logistics Industry in Brazil Analysis, Insights and Forecast, 2020-2032
- 8.1. Market Analysis, Insights and Forecast - by Services
- 8.1.1. Domestic Transportation Management
- 8.1.2. International Transportation Management
- 8.1.3. Value-added Warehousing and Distribution
- 8.2. Market Analysis, Insights and Forecast - by End User
- 8.2.1. Automobile
- 8.2.2. Chemicals
- 8.2.3. Consumer and Retail
- 8.2.4. Energy
- 8.2.5. Engineering and Manufacturing
- 8.2.6. Life Science and Healthcare
- 8.2.7. Other End User
- 8.1. Market Analysis, Insights and Forecast - by Services
- 9. Europe Third-Party Logistics Industry in Brazil Analysis, Insights and Forecast, 2020-2032
- 9.1. Market Analysis, Insights and Forecast - by Services
- 9.1.1. Domestic Transportation Management
- 9.1.2. International Transportation Management
- 9.1.3. Value-added Warehousing and Distribution
- 9.2. Market Analysis, Insights and Forecast - by End User
- 9.2.1. Automobile
- 9.2.2. Chemicals
- 9.2.3. Consumer and Retail
- 9.2.4. Energy
- 9.2.5. Engineering and Manufacturing
- 9.2.6. Life Science and Healthcare
- 9.2.7. Other End User
- 9.1. Market Analysis, Insights and Forecast - by Services
- 10. Middle East & Africa Third-Party Logistics Industry in Brazil Analysis, Insights and Forecast, 2020-2032
- 10.1. Market Analysis, Insights and Forecast - by Services
- 10.1.1. Domestic Transportation Management
- 10.1.2. International Transportation Management
- 10.1.3. Value-added Warehousing and Distribution
- 10.2. Market Analysis, Insights and Forecast - by End User
- 10.2.1. Automobile
- 10.2.2. Chemicals
- 10.2.3. Consumer and Retail
- 10.2.4. Energy
- 10.2.5. Engineering and Manufacturing
- 10.2.6. Life Science and Healthcare
- 10.2.7. Other End User
- 10.1. Market Analysis, Insights and Forecast - by Services
- 11. Asia Pacific Third-Party Logistics Industry in Brazil Analysis, Insights and Forecast, 2020-2032
- 11.1. Market Analysis, Insights and Forecast - by Services
- 11.1.1. Domestic Transportation Management
- 11.1.2. International Transportation Management
- 11.1.3. Value-added Warehousing and Distribution
- 11.2. Market Analysis, Insights and Forecast - by End User
- 11.2.1. Automobile
- 11.2.2. Chemicals
- 11.2.3. Consumer and Retail
- 11.2.4. Energy
- 11.2.5. Engineering and Manufacturing
- 11.2.6. Life Science and Healthcare
- 11.2.7. Other End User
- 11.1. Market Analysis, Insights and Forecast - by Services
- 12. Competitive Analysis
- 12.1. Company Profiles
- 12.1.1 DB Schenker
- 12.1.1.1. Company Overview
- 12.1.1.2. Products
- 12.1.1.3. Company Financials
- 12.1.1.4. SWOT Analysis
- 12.1.2 CEVA Logistics AG
- 12.1.2.1. Company Overview
- 12.1.2.2. Products
- 12.1.2.3. Company Financials
- 12.1.2.4. SWOT Analysis
- 12.1.3 Penske Logistics do Brasil Ltda**List Not Exhaustive 6 3 Other Companie
- 12.1.3.1. Company Overview
- 12.1.3.2. Products
- 12.1.3.3. Company Financials
- 12.1.3.4. SWOT Analysis
- 12.1.4 C H Robinson Worldwide Inc
- 12.1.4.1. Company Overview
- 12.1.4.2. Products
- 12.1.4.3. Company Financials
- 12.1.4.4. SWOT Analysis
- 12.1.5 Nippon Express Co Ltd
- 12.1.5.1. Company Overview
- 12.1.5.2. Products
- 12.1.5.3. Company Financials
- 12.1.5.4. SWOT Analysis
- 12.1.6 Kuehne + Nagel International AG
- 12.1.6.1. Company Overview
- 12.1.6.2. Products
- 12.1.6.3. Company Financials
- 12.1.6.4. SWOT Analysis
- 12.1.7 FedEx
- 12.1.7.1. Company Overview
- 12.1.7.2. Products
- 12.1.7.3. Company Financials
- 12.1.7.4. SWOT Analysis
- 12.1.8 BBM Logística SA
- 12.1.8.1. Company Overview
- 12.1.8.2. Products
- 12.1.8.3. Company Financials
- 12.1.8.4. SWOT Analysis
- 12.1.9 DSV AS
- 12.1.9.1. Company Overview
- 12.1.9.2. Products
- 12.1.9.3. Company Financials
- 12.1.9.4. SWOT Analysis
- 12.1.10 Deutsche Post AG
- 12.1.10.1. Company Overview
- 12.1.10.2. Products
- 12.1.10.3. Company Financials
- 12.1.10.4. SWOT Analysis
- 12.1.11 Gafor SA
- 12.1.11.1. Company Overview
- 12.1.11.2. Products
- 12.1.11.3. Company Financials
- 12.1.11.4. SWOT Analysis
- 12.1.1 DB Schenker
- 12.2. Market Entropy
- 12.2.1 Company's Key Areas Served
- 12.2.2 Recent Developments
- 12.3. Company Market Share Analysis 2025
- 12.3.1 Top 5 Companies Market Share Analysis
- 12.3.2 Top 3 Companies Market Share Analysis
- 12.4. List of Potential Customers
- 13. Research Methodology
List of Figures
- Figure 1: Global Third-Party Logistics Industry in Brazil Revenue Breakdown (Million, %) by Region 2025 & 2033
- Figure 2: North America Third-Party Logistics Industry in Brazil Revenue (Million), by Services 2025 & 2033
- Figure 3: North America Third-Party Logistics Industry in Brazil Revenue Share (%), by Services 2025 & 2033
- Figure 4: North America Third-Party Logistics Industry in Brazil Revenue (Million), by End User 2025 & 2033
- Figure 5: North America Third-Party Logistics Industry in Brazil Revenue Share (%), by End User 2025 & 2033
- Figure 6: North America Third-Party Logistics Industry in Brazil Revenue (Million), by Country 2025 & 2033
- Figure 7: North America Third-Party Logistics Industry in Brazil Revenue Share (%), by Country 2025 & 2033
- Figure 8: South America Third-Party Logistics Industry in Brazil Revenue (Million), by Services 2025 & 2033
- Figure 9: South America Third-Party Logistics Industry in Brazil Revenue Share (%), by Services 2025 & 2033
- Figure 10: South America Third-Party Logistics Industry in Brazil Revenue (Million), by End User 2025 & 2033
- Figure 11: South America Third-Party Logistics Industry in Brazil Revenue Share (%), by End User 2025 & 2033
- Figure 12: South America Third-Party Logistics Industry in Brazil Revenue (Million), by Country 2025 & 2033
- Figure 13: South America Third-Party Logistics Industry in Brazil Revenue Share (%), by Country 2025 & 2033
- Figure 14: Europe Third-Party Logistics Industry in Brazil Revenue (Million), by Services 2025 & 2033
- Figure 15: Europe Third-Party Logistics Industry in Brazil Revenue Share (%), by Services 2025 & 2033
- Figure 16: Europe Third-Party Logistics Industry in Brazil Revenue (Million), by End User 2025 & 2033
- Figure 17: Europe Third-Party Logistics Industry in Brazil Revenue Share (%), by End User 2025 & 2033
- Figure 18: Europe Third-Party Logistics Industry in Brazil Revenue (Million), by Country 2025 & 2033
- Figure 19: Europe Third-Party Logistics Industry in Brazil Revenue Share (%), by Country 2025 & 2033
- Figure 20: Middle East & Africa Third-Party Logistics Industry in Brazil Revenue (Million), by Services 2025 & 2033
- Figure 21: Middle East & Africa Third-Party Logistics Industry in Brazil Revenue Share (%), by Services 2025 & 2033
- Figure 22: Middle East & Africa Third-Party Logistics Industry in Brazil Revenue (Million), by End User 2025 & 2033
- Figure 23: Middle East & Africa Third-Party Logistics Industry in Brazil Revenue Share (%), by End User 2025 & 2033
- Figure 24: Middle East & Africa Third-Party Logistics Industry in Brazil Revenue (Million), by Country 2025 & 2033
- Figure 25: Middle East & Africa Third-Party Logistics Industry in Brazil Revenue Share (%), by Country 2025 & 2033
- Figure 26: Asia Pacific Third-Party Logistics Industry in Brazil Revenue (Million), by Services 2025 & 2033
- Figure 27: Asia Pacific Third-Party Logistics Industry in Brazil Revenue Share (%), by Services 2025 & 2033
- Figure 28: Asia Pacific Third-Party Logistics Industry in Brazil Revenue (Million), by End User 2025 & 2033
- Figure 29: Asia Pacific Third-Party Logistics Industry in Brazil Revenue Share (%), by End User 2025 & 2033
- Figure 30: Asia Pacific Third-Party Logistics Industry in Brazil Revenue (Million), by Country 2025 & 2033
- Figure 31: Asia Pacific Third-Party Logistics Industry in Brazil Revenue Share (%), by Country 2025 & 2033
List of Tables
- Table 1: Global Third-Party Logistics Industry in Brazil Revenue Million Forecast, by Services 2020 & 2033
- Table 2: Global Third-Party Logistics Industry in Brazil Revenue Million Forecast, by End User 2020 & 2033
- Table 3: Global Third-Party Logistics Industry in Brazil Revenue Million Forecast, by Region 2020 & 2033
- Table 4: Global Third-Party Logistics Industry in Brazil Revenue Million Forecast, by Services 2020 & 2033
- Table 5: Global Third-Party Logistics Industry in Brazil Revenue Million Forecast, by End User 2020 & 2033
- Table 6: Global Third-Party Logistics Industry in Brazil Revenue Million Forecast, by Country 2020 & 2033
- Table 7: United States Third-Party Logistics Industry in Brazil Revenue (Million) Forecast, by Application 2020 & 2033
- Table 8: Canada Third-Party Logistics Industry in Brazil Revenue (Million) Forecast, by Application 2020 & 2033
- Table 9: Mexico Third-Party Logistics Industry in Brazil Revenue (Million) Forecast, by Application 2020 & 2033
- Table 10: Global Third-Party Logistics Industry in Brazil Revenue Million Forecast, by Services 2020 & 2033
- Table 11: Global Third-Party Logistics Industry in Brazil Revenue Million Forecast, by End User 2020 & 2033
- Table 12: Global Third-Party Logistics Industry in Brazil Revenue Million Forecast, by Country 2020 & 2033
- Table 13: Brazil Third-Party Logistics Industry in Brazil Revenue (Million) Forecast, by Application 2020 & 2033
- Table 14: Argentina Third-Party Logistics Industry in Brazil Revenue (Million) Forecast, by Application 2020 & 2033
- Table 15: Rest of South America Third-Party Logistics Industry in Brazil Revenue (Million) Forecast, by Application 2020 & 2033
- Table 16: Global Third-Party Logistics Industry in Brazil Revenue Million Forecast, by Services 2020 & 2033
- Table 17: Global Third-Party Logistics Industry in Brazil Revenue Million Forecast, by End User 2020 & 2033
- Table 18: Global Third-Party Logistics Industry in Brazil Revenue Million Forecast, by Country 2020 & 2033
- Table 19: United Kingdom Third-Party Logistics Industry in Brazil Revenue (Million) Forecast, by Application 2020 & 2033
- Table 20: Germany Third-Party Logistics Industry in Brazil Revenue (Million) Forecast, by Application 2020 & 2033
- Table 21: France Third-Party Logistics Industry in Brazil Revenue (Million) Forecast, by Application 2020 & 2033
- Table 22: Italy Third-Party Logistics Industry in Brazil Revenue (Million) Forecast, by Application 2020 & 2033
- Table 23: Spain Third-Party Logistics Industry in Brazil Revenue (Million) Forecast, by Application 2020 & 2033
- Table 24: Russia Third-Party Logistics Industry in Brazil Revenue (Million) Forecast, by Application 2020 & 2033
- Table 25: Benelux Third-Party Logistics Industry in Brazil Revenue (Million) Forecast, by Application 2020 & 2033
- Table 26: Nordics Third-Party Logistics Industry in Brazil Revenue (Million) Forecast, by Application 2020 & 2033
- Table 27: Rest of Europe Third-Party Logistics Industry in Brazil Revenue (Million) Forecast, by Application 2020 & 2033
- Table 28: Global Third-Party Logistics Industry in Brazil Revenue Million Forecast, by Services 2020 & 2033
- Table 29: Global Third-Party Logistics Industry in Brazil Revenue Million Forecast, by End User 2020 & 2033
- Table 30: Global Third-Party Logistics Industry in Brazil Revenue Million Forecast, by Country 2020 & 2033
- Table 31: Turkey Third-Party Logistics Industry in Brazil Revenue (Million) Forecast, by Application 2020 & 2033
- Table 32: Israel Third-Party Logistics Industry in Brazil Revenue (Million) Forecast, by Application 2020 & 2033
- Table 33: GCC Third-Party Logistics Industry in Brazil Revenue (Million) Forecast, by Application 2020 & 2033
- Table 34: North Africa Third-Party Logistics Industry in Brazil Revenue (Million) Forecast, by Application 2020 & 2033
- Table 35: South Africa Third-Party Logistics Industry in Brazil Revenue (Million) Forecast, by Application 2020 & 2033
- Table 36: Rest of Middle East & Africa Third-Party Logistics Industry in Brazil Revenue (Million) Forecast, by Application 2020 & 2033
- Table 37: Global Third-Party Logistics Industry in Brazil Revenue Million Forecast, by Services 2020 & 2033
- Table 38: Global Third-Party Logistics Industry in Brazil Revenue Million Forecast, by End User 2020 & 2033
- Table 39: Global Third-Party Logistics Industry in Brazil Revenue Million Forecast, by Country 2020 & 2033
- Table 40: China Third-Party Logistics Industry in Brazil Revenue (Million) Forecast, by Application 2020 & 2033
- Table 41: India Third-Party Logistics Industry in Brazil Revenue (Million) Forecast, by Application 2020 & 2033
- Table 42: Japan Third-Party Logistics Industry in Brazil Revenue (Million) Forecast, by Application 2020 & 2033
- Table 43: South Korea Third-Party Logistics Industry in Brazil Revenue (Million) Forecast, by Application 2020 & 2033
- Table 44: ASEAN Third-Party Logistics Industry in Brazil Revenue (Million) Forecast, by Application 2020 & 2033
- Table 45: Oceania Third-Party Logistics Industry in Brazil Revenue (Million) Forecast, by Application 2020 & 2033
- Table 46: Rest of Asia Pacific Third-Party Logistics Industry in Brazil Revenue (Million) Forecast, by Application 2020 & 2033
Frequently Asked Questions
1. What is the projected Compound Annual Growth Rate (CAGR) of the Third-Party Logistics Industry in Brazil?
The projected CAGR is approximately 4.26%.
2. Which companies are prominent players in the Third-Party Logistics Industry in Brazil?
Key companies in the market include DB Schenker, CEVA Logistics AG, Penske Logistics do Brasil Ltda**List Not Exhaustive 6 3 Other Companie, C H Robinson Worldwide Inc, Nippon Express Co Ltd, Kuehne + Nagel International AG, FedEx, BBM Logística SA, DSV AS, Deutsche Post AG, Gafor SA.
3. What are the main segments of the Third-Party Logistics Industry in Brazil?
The market segments include Services, End User.
4. Can you provide details about the market size?
The market size is estimated to be USD 33.20 Million as of 2022.
5. What are some drivers contributing to market growth?
E-commerce Fueling the Growth of 3PL Market.
6. What are the notable trends driving market growth?
Increasing Freight Trucking is Driving Market Growth.
7. Are there any restraints impacting market growth?
Slow Infrastructure Development.
8. Can you provide examples of recent developments in the market?
N/A
9. What pricing options are available for accessing the report?
Pricing options include single-user, multi-user, and enterprise licenses priced at USD 3800, USD 4500, and USD 5800 respectively.
10. Is the market size provided in terms of value or volume?
The market size is provided in terms of value, measured in Million.
11. Are there any specific market keywords associated with the report?
Yes, the market keyword associated with the report is "Third-Party Logistics Industry in Brazil," which aids in identifying and referencing the specific market segment covered.
12. How do I determine which pricing option suits my needs best?
The pricing options vary based on user requirements and access needs. Individual users may opt for single-user licenses, while businesses requiring broader access may choose multi-user or enterprise licenses for cost-effective access to the report.
13. Are there any additional resources or data provided in the Third-Party Logistics Industry in Brazil report?
While the report offers comprehensive insights, it's advisable to review the specific contents or supplementary materials provided to ascertain if additional resources or data are available.
14. How can I stay updated on further developments or reports in the Third-Party Logistics Industry in Brazil?
To stay informed about further developments, trends, and reports in the Third-Party Logistics Industry in Brazil, consider subscribing to industry newsletters, following relevant companies and organizations, or regularly checking reputable industry news sources and publications.
Methodology
Step 1 - Identification of Relevant Samples Size from Population Database


Step 2 - Approaches for Defining Global Market Size (Value, Volume* & Price*)

Note*: In applicable scenarios
Step 3 - Data Sources
Primary Research
- Web Analytics
- Survey Reports
- Research Institute
- Latest Research Reports
- Opinion Leaders
Secondary Research
- Annual Reports
- White Paper
- Latest Press Release
- Industry Association
- Paid Database
- Investor Presentations

Step 4 - Data Triangulation
Involves using different sources of information in order to increase the validity of a study
These sources are likely to be stakeholders in a program - participants, other researchers, program staff, other community members, and so on.
Then we put all data in single framework & apply various statistical tools to find out the dynamic on the market.
During the analysis stage, feedback from the stakeholder groups would be compared to determine areas of agreement as well as areas of divergence