

Key Insights
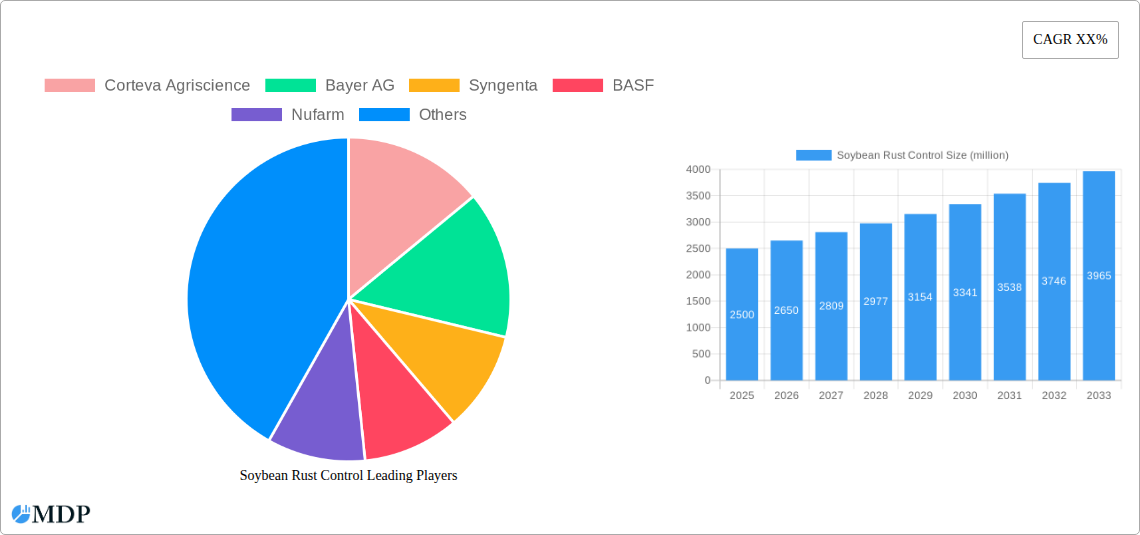
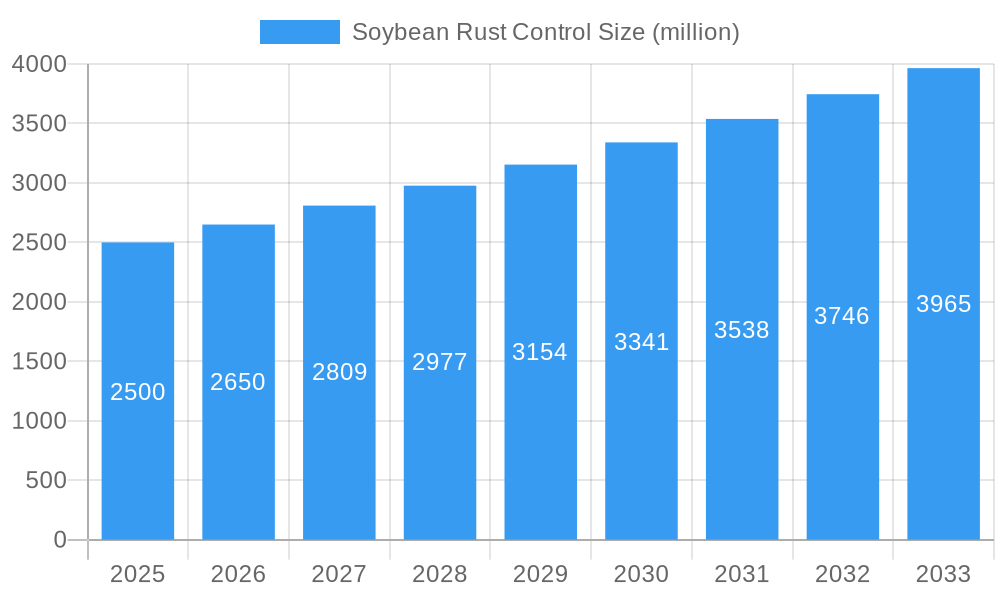
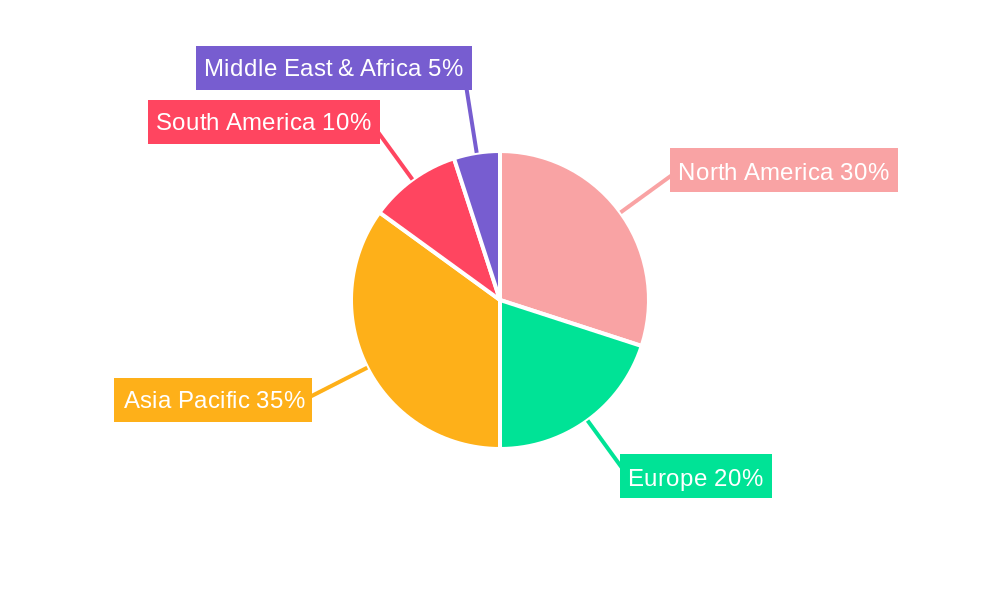
The global soybean rust control market is experiencing robust growth, driven by increasing soybean cultivation globally and the escalating prevalence of soybean rust disease, which significantly impacts crop yields and farmer profitability. The market, currently valued at approximately $2.5 billion in 2025, is projected to exhibit a Compound Annual Growth Rate (CAGR) of 6% from 2025 to 2033, reaching an estimated market value exceeding $4 billion by 2033. This expansion is fueled by several factors, including the increasing adoption of advanced fungicides offering superior efficacy and broader-spectrum disease control, coupled with rising awareness among farmers regarding the economic benefits of proactive disease management. Furthermore, technological advancements in precision agriculture, such as drone-based spraying and remote sensing for early disease detection, are contributing to more targeted and efficient application of rust control solutions. The liquid formulation segment currently dominates the market due to its ease of application and compatibility with various spraying systems, although powder formulations are gaining traction due to their longer shelf life and reduced transportation costs. Geographically, North America and Asia-Pacific regions represent significant market shares, driven by substantial soybean production and a proactive approach towards disease management in these areas.
Soybean Rust Control Market Size (In Billion)
However, the market's growth is not without constraints. The fluctuating prices of raw materials used in fungicide production, stringent regulatory approvals for new products, and the potential development of fungicide-resistant soybean rust strains pose challenges to market expansion. The growing concerns regarding the environmental impact of chemical pesticides are also pushing the development and adoption of biopesticides and integrated pest management strategies, offering alternative, sustainable rust control solutions. The increasing focus on sustainable and environmentally friendly agricultural practices will influence future market dynamics, creating both opportunities and challenges for market players. Companies are investing in research and development to introduce novel, eco-friendly, and high-performing solutions to meet growing demand and address environmental concerns. The competitive landscape is characterized by the presence of major agrochemical companies and regional players, constantly innovating and expanding their product portfolios to capture market share.
Soybean Rust Control Company Market Share
Soybean Rust Control Market Report: 2019-2033
A comprehensive analysis of the \$XX million Soybean Rust Control market, projecting a CAGR of XX% from 2025 to 2033. This in-depth report provides a granular view of the market dynamics, key players, and future growth potential, offering invaluable insights for industry stakeholders, investors, and researchers. The study period covers 2019-2033, with 2025 as the base and estimated year.
Soybean Rust Control Market Dynamics & Concentration
The global Soybean Rust Control market, valued at \$XX million in 2025, is characterized by a moderately concentrated landscape. Key players like Corteva Agriscience, Bayer AG, Syngenta, and BASF hold significant market share, collectively accounting for approximately XX% in 2025. Market concentration is influenced by factors such as economies of scale in production and R&D, strong brand recognition, and extensive distribution networks. Innovation plays a crucial role, with companies continuously developing novel formulations and application technologies to enhance efficacy and sustainability. Stringent regulatory frameworks, including those concerning pesticide registration and environmental impact, shape market dynamics and necessitate compliance. The market also witnesses competition from bio-pesticides and other sustainable control methods, acting as potential substitutes. End-user trends, particularly towards integrated pest management (IPM) strategies and increased adoption of precision agriculture, are driving demand for more sophisticated and targeted solutions. The market has seen XX M&A deals in the historical period (2019-2024), reflecting consolidation trends and strategic expansion efforts.
- Market Share (2025): Corteva Agriscience (XX%), Bayer AG (XX%), Syngenta (XX%), BASF (XX%), Others (XX%).
- M&A Deal Count (2019-2024): XX
- Key Innovation Drivers: Development of resistant varieties, biological control agents, and advanced application technologies.
- Regulatory Factors: Stringent environmental regulations and pesticide registration requirements.
Soybean Rust Control Industry Trends & Analysis
The Soybean Rust Control market is poised for significant growth, driven by several factors. Rising soybean production globally, particularly in key regions like South America and Asia, fuels demand for effective rust control solutions. The increasing incidence of soybean rust, exacerbated by climate change and global trade, creates an urgent need for robust disease management strategies. Technological advancements, including the development of more effective fungicides with improved efficacy and reduced environmental impact, are transforming the market. The growing adoption of precision agriculture, enabling targeted application and reducing chemical usage, further enhances market growth. Consumer preference towards sustainable and environmentally friendly products drives demand for biopesticides and integrated pest management (IPM) solutions. Intense competition among leading players, coupled with ongoing research and development, fuels innovation and drives down prices, benefiting farmers. The market exhibits a projected CAGR of XX% during the forecast period (2025-2033), with market penetration reaching XX% by 2033.
Leading Markets & Segments in Soybean Rust Control
The Soybean Rust Control market displays significant regional variations. [Specify dominant region, e.g., South America] is currently the leading market, driven by extensive soybean cultivation and high prevalence of soybean rust. [Specify dominant country within that region, e.g., Brazil]. Key drivers include:
- Economic Policies: Government support for agricultural development and investments in research and technology.
- Infrastructure: Well-developed agricultural infrastructure, including efficient distribution networks for pesticides.
- Climate: Favorable climate conditions for soybean cultivation, also increasing susceptibility to rust.
Within the application segments, Vegetable Farms hold the largest market share, reflecting the high value of vegetable crops and the need for effective disease control. The liquid formulation segment dominates due to ease of application and better efficacy compared to powder formulations. The "Other" segment, encompassing various application methods and specialized products, is also showing promising growth.
Soybean Rust Control Product Developments
Recent innovations focus on developing fungicides with improved efficacy, broader spectrum activity, and enhanced resistance management. Formulation advancements, such as nano-encapsulation and targeted delivery systems, optimize product performance and minimize environmental impact. Companies are also integrating digital technologies and precision agriculture techniques to optimize application and improve disease management strategies. These innovations cater to growing market demand for environmentally sustainable and economically viable rust control solutions.
Key Drivers of Soybean Rust Control Growth
Several factors are driving market growth. Technological advancements, such as the development of more effective and targeted fungicides, are crucial. Economically, increasing soybean production and higher crop prices incentivize farmers to invest in robust disease management practices. Favorable government policies supporting agricultural development and promoting sustainable pest control further stimulate market expansion.
Challenges in the Soybean Rust Control Market
The market faces challenges, including stringent regulatory hurdles for pesticide approvals and potential environmental concerns. Supply chain disruptions, including fluctuations in raw material prices and logistical issues, can impact product availability and pricing. Furthermore, intense competition from both established and emerging players necessitates continuous innovation and strategic market positioning.
Emerging Opportunities in Soybean Rust Control
The market presents promising long-term growth opportunities. Technological breakthroughs in genetic engineering and bio-control agents offer new solutions for rust management. Strategic partnerships and collaborations between pesticide companies, agricultural research institutions, and farmers can accelerate innovation and product development. Market expansion into underpenetrated regions with high soybean cultivation potential provides additional growth drivers.
Leading Players in the Soybean Rust Control Sector
- Corteva Agriscience
- Bayer AG
- Syngenta
- BASF
- Nufarm
- UPL
- FMC Corporation
- Adama Agricultural
- Ourofino Agrociência
- Sumitomo Chemical Co Ltd
- Albaugh LLC
- Nortox
- Rotam
Key Milestones in Soybean Rust Control Industry
- 2020: Launch of a new fungicide with enhanced efficacy by Corteva Agriscience.
- 2022: Acquisition of a smaller pesticide company by BASF, expanding its portfolio.
- 2023: Introduction of a bio-pesticide for soybean rust control by Syngenta.
- [Add further milestones with year/month and brief description]
Strategic Outlook for Soybean Rust Control Market
The Soybean Rust Control market exhibits strong long-term growth potential, driven by increasing soybean production, technological advancements, and the urgent need for effective disease management strategies. Companies can capitalize on this growth by focusing on developing innovative, sustainable, and cost-effective solutions. Strategic partnerships, targeted market expansion, and investments in research and development are crucial for achieving sustained success in this dynamic market.
Soybean Rust Control Segmentation
-
1. Application
- 1.1. Vegetable Farm
- 1.2. Greenhouse
- 1.3. Other
-
2. Types
- 2.1. Liquid
- 2.2. Powder
Soybean Rust Control Segmentation By Geography
-
1. North America
- 1.1. United States
- 1.2. Canada
- 1.3. Mexico
-
2. South America
- 2.1. Brazil
- 2.2. Argentina
- 2.3. Rest of South America
-
3. Europe
- 3.1. United Kingdom
- 3.2. Germany
- 3.3. France
- 3.4. Italy
- 3.5. Spain
- 3.6. Russia
- 3.7. Benelux
- 3.8. Nordics
- 3.9. Rest of Europe
-
4. Middle East & Africa
- 4.1. Turkey
- 4.2. Israel
- 4.3. GCC
- 4.4. North Africa
- 4.5. South Africa
- 4.6. Rest of Middle East & Africa
-
5. Asia Pacific
- 5.1. China
- 5.2. India
- 5.3. Japan
- 5.4. South Korea
- 5.5. ASEAN
- 5.6. Oceania
- 5.7. Rest of Asia Pacific
Soybean Rust Control Regional Market Share
Geographic Coverage of Soybean Rust Control
Soybean Rust Control REPORT HIGHLIGHTS
| Aspects | Details |
|---|---|
| Study Period | 2020-2034 |
| Base Year | 2025 |
| Estimated Year | 2026 |
| Forecast Period | 2026-2034 |
| Historical Period | 2020-2025 |
| Growth Rate | CAGR of XX% from 2020-2034 |
| Segmentation |
|
Table of Contents
- 1. Introduction
- 1.1. Research Scope
- 1.2. Market Segmentation
- 1.3. Research Methodology
- 1.4. Definitions and Assumptions
- 2. Executive Summary
- 2.1. Introduction
- 3. Market Dynamics
- 3.1. Introduction
- 3.2. Market Drivers
- 3.3. Market Restrains
- 3.4. Market Trends
- 4. Market Factor Analysis
- 4.1. Porters Five Forces
- 4.2. Supply/Value Chain
- 4.3. PESTEL analysis
- 4.4. Market Entropy
- 4.5. Patent/Trademark Analysis
- 5. Global Soybean Rust Control Analysis, Insights and Forecast, 2020-2032
- 5.1. Market Analysis, Insights and Forecast - by Application
- 5.1.1. Vegetable Farm
- 5.1.2. Greenhouse
- 5.1.3. Other
- 5.2. Market Analysis, Insights and Forecast - by Types
- 5.2.1. Liquid
- 5.2.2. Powder
- 5.3. Market Analysis, Insights and Forecast - by Region
- 5.3.1. North America
- 5.3.2. South America
- 5.3.3. Europe
- 5.3.4. Middle East & Africa
- 5.3.5. Asia Pacific
- 5.1. Market Analysis, Insights and Forecast - by Application
- 6. North America Soybean Rust Control Analysis, Insights and Forecast, 2020-2032
- 6.1. Market Analysis, Insights and Forecast - by Application
- 6.1.1. Vegetable Farm
- 6.1.2. Greenhouse
- 6.1.3. Other
- 6.2. Market Analysis, Insights and Forecast - by Types
- 6.2.1. Liquid
- 6.2.2. Powder
- 6.1. Market Analysis, Insights and Forecast - by Application
- 7. South America Soybean Rust Control Analysis, Insights and Forecast, 2020-2032
- 7.1. Market Analysis, Insights and Forecast - by Application
- 7.1.1. Vegetable Farm
- 7.1.2. Greenhouse
- 7.1.3. Other
- 7.2. Market Analysis, Insights and Forecast - by Types
- 7.2.1. Liquid
- 7.2.2. Powder
- 7.1. Market Analysis, Insights and Forecast - by Application
- 8. Europe Soybean Rust Control Analysis, Insights and Forecast, 2020-2032
- 8.1. Market Analysis, Insights and Forecast - by Application
- 8.1.1. Vegetable Farm
- 8.1.2. Greenhouse
- 8.1.3. Other
- 8.2. Market Analysis, Insights and Forecast - by Types
- 8.2.1. Liquid
- 8.2.2. Powder
- 8.1. Market Analysis, Insights and Forecast - by Application
- 9. Middle East & Africa Soybean Rust Control Analysis, Insights and Forecast, 2020-2032
- 9.1. Market Analysis, Insights and Forecast - by Application
- 9.1.1. Vegetable Farm
- 9.1.2. Greenhouse
- 9.1.3. Other
- 9.2. Market Analysis, Insights and Forecast - by Types
- 9.2.1. Liquid
- 9.2.2. Powder
- 9.1. Market Analysis, Insights and Forecast - by Application
- 10. Asia Pacific Soybean Rust Control Analysis, Insights and Forecast, 2020-2032
- 10.1. Market Analysis, Insights and Forecast - by Application
- 10.1.1. Vegetable Farm
- 10.1.2. Greenhouse
- 10.1.3. Other
- 10.2. Market Analysis, Insights and Forecast - by Types
- 10.2.1. Liquid
- 10.2.2. Powder
- 10.1. Market Analysis, Insights and Forecast - by Application
- 11. Competitive Analysis
- 11.1. Global Market Share Analysis 2025
- 11.2. Company Profiles
- 11.2.1 Corteva Agriscience
- 11.2.1.1. Overview
- 11.2.1.2. Products
- 11.2.1.3. SWOT Analysis
- 11.2.1.4. Recent Developments
- 11.2.1.5. Financials (Based on Availability)
- 11.2.2 Bayer AG
- 11.2.2.1. Overview
- 11.2.2.2. Products
- 11.2.2.3. SWOT Analysis
- 11.2.2.4. Recent Developments
- 11.2.2.5. Financials (Based on Availability)
- 11.2.3 Syngenta
- 11.2.3.1. Overview
- 11.2.3.2. Products
- 11.2.3.3. SWOT Analysis
- 11.2.3.4. Recent Developments
- 11.2.3.5. Financials (Based on Availability)
- 11.2.4 BASF
- 11.2.4.1. Overview
- 11.2.4.2. Products
- 11.2.4.3. SWOT Analysis
- 11.2.4.4. Recent Developments
- 11.2.4.5. Financials (Based on Availability)
- 11.2.5 Nufarm
- 11.2.5.1. Overview
- 11.2.5.2. Products
- 11.2.5.3. SWOT Analysis
- 11.2.5.4. Recent Developments
- 11.2.5.5. Financials (Based on Availability)
- 11.2.6 UPL
- 11.2.6.1. Overview
- 11.2.6.2. Products
- 11.2.6.3. SWOT Analysis
- 11.2.6.4. Recent Developments
- 11.2.6.5. Financials (Based on Availability)
- 11.2.7 FMC Corporation
- 11.2.7.1. Overview
- 11.2.7.2. Products
- 11.2.7.3. SWOT Analysis
- 11.2.7.4. Recent Developments
- 11.2.7.5. Financials (Based on Availability)
- 11.2.8 Adama Agricultural
- 11.2.8.1. Overview
- 11.2.8.2. Products
- 11.2.8.3. SWOT Analysis
- 11.2.8.4. Recent Developments
- 11.2.8.5. Financials (Based on Availability)
- 11.2.9 Ourofino Agrociência
- 11.2.9.1. Overview
- 11.2.9.2. Products
- 11.2.9.3. SWOT Analysis
- 11.2.9.4. Recent Developments
- 11.2.9.5. Financials (Based on Availability)
- 11.2.10 Sumitomo Chemical Co Ltd
- 11.2.10.1. Overview
- 11.2.10.2. Products
- 11.2.10.3. SWOT Analysis
- 11.2.10.4. Recent Developments
- 11.2.10.5. Financials (Based on Availability)
- 11.2.11 Albaugh LLC
- 11.2.11.1. Overview
- 11.2.11.2. Products
- 11.2.11.3. SWOT Analysis
- 11.2.11.4. Recent Developments
- 11.2.11.5. Financials (Based on Availability)
- 11.2.12 Nortox
- 11.2.12.1. Overview
- 11.2.12.2. Products
- 11.2.12.3. SWOT Analysis
- 11.2.12.4. Recent Developments
- 11.2.12.5. Financials (Based on Availability)
- 11.2.13 Rotam
- 11.2.13.1. Overview
- 11.2.13.2. Products
- 11.2.13.3. SWOT Analysis
- 11.2.13.4. Recent Developments
- 11.2.13.5. Financials (Based on Availability)
- 11.2.1 Corteva Agriscience
List of Figures
- Figure 1: Global Soybean Rust Control Revenue Breakdown (million, %) by Region 2025 & 2033
- Figure 2: Global Soybean Rust Control Volume Breakdown (K, %) by Region 2025 & 2033
- Figure 3: North America Soybean Rust Control Revenue (million), by Application 2025 & 2033
- Figure 4: North America Soybean Rust Control Volume (K), by Application 2025 & 2033
- Figure 5: North America Soybean Rust Control Revenue Share (%), by Application 2025 & 2033
- Figure 6: North America Soybean Rust Control Volume Share (%), by Application 2025 & 2033
- Figure 7: North America Soybean Rust Control Revenue (million), by Types 2025 & 2033
- Figure 8: North America Soybean Rust Control Volume (K), by Types 2025 & 2033
- Figure 9: North America Soybean Rust Control Revenue Share (%), by Types 2025 & 2033
- Figure 10: North America Soybean Rust Control Volume Share (%), by Types 2025 & 2033
- Figure 11: North America Soybean Rust Control Revenue (million), by Country 2025 & 2033
- Figure 12: North America Soybean Rust Control Volume (K), by Country 2025 & 2033
- Figure 13: North America Soybean Rust Control Revenue Share (%), by Country 2025 & 2033
- Figure 14: North America Soybean Rust Control Volume Share (%), by Country 2025 & 2033
- Figure 15: South America Soybean Rust Control Revenue (million), by Application 2025 & 2033
- Figure 16: South America Soybean Rust Control Volume (K), by Application 2025 & 2033
- Figure 17: South America Soybean Rust Control Revenue Share (%), by Application 2025 & 2033
- Figure 18: South America Soybean Rust Control Volume Share (%), by Application 2025 & 2033
- Figure 19: South America Soybean Rust Control Revenue (million), by Types 2025 & 2033
- Figure 20: South America Soybean Rust Control Volume (K), by Types 2025 & 2033
- Figure 21: South America Soybean Rust Control Revenue Share (%), by Types 2025 & 2033
- Figure 22: South America Soybean Rust Control Volume Share (%), by Types 2025 & 2033
- Figure 23: South America Soybean Rust Control Revenue (million), by Country 2025 & 2033
- Figure 24: South America Soybean Rust Control Volume (K), by Country 2025 & 2033
- Figure 25: South America Soybean Rust Control Revenue Share (%), by Country 2025 & 2033
- Figure 26: South America Soybean Rust Control Volume Share (%), by Country 2025 & 2033
- Figure 27: Europe Soybean Rust Control Revenue (million), by Application 2025 & 2033
- Figure 28: Europe Soybean Rust Control Volume (K), by Application 2025 & 2033
- Figure 29: Europe Soybean Rust Control Revenue Share (%), by Application 2025 & 2033
- Figure 30: Europe Soybean Rust Control Volume Share (%), by Application 2025 & 2033
- Figure 31: Europe Soybean Rust Control Revenue (million), by Types 2025 & 2033
- Figure 32: Europe Soybean Rust Control Volume (K), by Types 2025 & 2033
- Figure 33: Europe Soybean Rust Control Revenue Share (%), by Types 2025 & 2033
- Figure 34: Europe Soybean Rust Control Volume Share (%), by Types 2025 & 2033
- Figure 35: Europe Soybean Rust Control Revenue (million), by Country 2025 & 2033
- Figure 36: Europe Soybean Rust Control Volume (K), by Country 2025 & 2033
- Figure 37: Europe Soybean Rust Control Revenue Share (%), by Country 2025 & 2033
- Figure 38: Europe Soybean Rust Control Volume Share (%), by Country 2025 & 2033
- Figure 39: Middle East & Africa Soybean Rust Control Revenue (million), by Application 2025 & 2033
- Figure 40: Middle East & Africa Soybean Rust Control Volume (K), by Application 2025 & 2033
- Figure 41: Middle East & Africa Soybean Rust Control Revenue Share (%), by Application 2025 & 2033
- Figure 42: Middle East & Africa Soybean Rust Control Volume Share (%), by Application 2025 & 2033
- Figure 43: Middle East & Africa Soybean Rust Control Revenue (million), by Types 2025 & 2033
- Figure 44: Middle East & Africa Soybean Rust Control Volume (K), by Types 2025 & 2033
- Figure 45: Middle East & Africa Soybean Rust Control Revenue Share (%), by Types 2025 & 2033
- Figure 46: Middle East & Africa Soybean Rust Control Volume Share (%), by Types 2025 & 2033
- Figure 47: Middle East & Africa Soybean Rust Control Revenue (million), by Country 2025 & 2033
- Figure 48: Middle East & Africa Soybean Rust Control Volume (K), by Country 2025 & 2033
- Figure 49: Middle East & Africa Soybean Rust Control Revenue Share (%), by Country 2025 & 2033
- Figure 50: Middle East & Africa Soybean Rust Control Volume Share (%), by Country 2025 & 2033
- Figure 51: Asia Pacific Soybean Rust Control Revenue (million), by Application 2025 & 2033
- Figure 52: Asia Pacific Soybean Rust Control Volume (K), by Application 2025 & 2033
- Figure 53: Asia Pacific Soybean Rust Control Revenue Share (%), by Application 2025 & 2033
- Figure 54: Asia Pacific Soybean Rust Control Volume Share (%), by Application 2025 & 2033
- Figure 55: Asia Pacific Soybean Rust Control Revenue (million), by Types 2025 & 2033
- Figure 56: Asia Pacific Soybean Rust Control Volume (K), by Types 2025 & 2033
- Figure 57: Asia Pacific Soybean Rust Control Revenue Share (%), by Types 2025 & 2033
- Figure 58: Asia Pacific Soybean Rust Control Volume Share (%), by Types 2025 & 2033
- Figure 59: Asia Pacific Soybean Rust Control Revenue (million), by Country 2025 & 2033
- Figure 60: Asia Pacific Soybean Rust Control Volume (K), by Country 2025 & 2033
- Figure 61: Asia Pacific Soybean Rust Control Revenue Share (%), by Country 2025 & 2033
- Figure 62: Asia Pacific Soybean Rust Control Volume Share (%), by Country 2025 & 2033
List of Tables
- Table 1: Global Soybean Rust Control Revenue million Forecast, by Application 2020 & 2033
- Table 2: Global Soybean Rust Control Volume K Forecast, by Application 2020 & 2033
- Table 3: Global Soybean Rust Control Revenue million Forecast, by Types 2020 & 2033
- Table 4: Global Soybean Rust Control Volume K Forecast, by Types 2020 & 2033
- Table 5: Global Soybean Rust Control Revenue million Forecast, by Region 2020 & 2033
- Table 6: Global Soybean Rust Control Volume K Forecast, by Region 2020 & 2033
- Table 7: Global Soybean Rust Control Revenue million Forecast, by Application 2020 & 2033
- Table 8: Global Soybean Rust Control Volume K Forecast, by Application 2020 & 2033
- Table 9: Global Soybean Rust Control Revenue million Forecast, by Types 2020 & 2033
- Table 10: Global Soybean Rust Control Volume K Forecast, by Types 2020 & 2033
- Table 11: Global Soybean Rust Control Revenue million Forecast, by Country 2020 & 2033
- Table 12: Global Soybean Rust Control Volume K Forecast, by Country 2020 & 2033
- Table 13: United States Soybean Rust Control Revenue (million) Forecast, by Application 2020 & 2033
- Table 14: United States Soybean Rust Control Volume (K) Forecast, by Application 2020 & 2033
- Table 15: Canada Soybean Rust Control Revenue (million) Forecast, by Application 2020 & 2033
- Table 16: Canada Soybean Rust Control Volume (K) Forecast, by Application 2020 & 2033
- Table 17: Mexico Soybean Rust Control Revenue (million) Forecast, by Application 2020 & 2033
- Table 18: Mexico Soybean Rust Control Volume (K) Forecast, by Application 2020 & 2033
- Table 19: Global Soybean Rust Control Revenue million Forecast, by Application 2020 & 2033
- Table 20: Global Soybean Rust Control Volume K Forecast, by Application 2020 & 2033
- Table 21: Global Soybean Rust Control Revenue million Forecast, by Types 2020 & 2033
- Table 22: Global Soybean Rust Control Volume K Forecast, by Types 2020 & 2033
- Table 23: Global Soybean Rust Control Revenue million Forecast, by Country 2020 & 2033
- Table 24: Global Soybean Rust Control Volume K Forecast, by Country 2020 & 2033
- Table 25: Brazil Soybean Rust Control Revenue (million) Forecast, by Application 2020 & 2033
- Table 26: Brazil Soybean Rust Control Volume (K) Forecast, by Application 2020 & 2033
- Table 27: Argentina Soybean Rust Control Revenue (million) Forecast, by Application 2020 & 2033
- Table 28: Argentina Soybean Rust Control Volume (K) Forecast, by Application 2020 & 2033
- Table 29: Rest of South America Soybean Rust Control Revenue (million) Forecast, by Application 2020 & 2033
- Table 30: Rest of South America Soybean Rust Control Volume (K) Forecast, by Application 2020 & 2033
- Table 31: Global Soybean Rust Control Revenue million Forecast, by Application 2020 & 2033
- Table 32: Global Soybean Rust Control Volume K Forecast, by Application 2020 & 2033
- Table 33: Global Soybean Rust Control Revenue million Forecast, by Types 2020 & 2033
- Table 34: Global Soybean Rust Control Volume K Forecast, by Types 2020 & 2033
- Table 35: Global Soybean Rust Control Revenue million Forecast, by Country 2020 & 2033
- Table 36: Global Soybean Rust Control Volume K Forecast, by Country 2020 & 2033
- Table 37: United Kingdom Soybean Rust Control Revenue (million) Forecast, by Application 2020 & 2033
- Table 38: United Kingdom Soybean Rust Control Volume (K) Forecast, by Application 2020 & 2033
- Table 39: Germany Soybean Rust Control Revenue (million) Forecast, by Application 2020 & 2033
- Table 40: Germany Soybean Rust Control Volume (K) Forecast, by Application 2020 & 2033
- Table 41: France Soybean Rust Control Revenue (million) Forecast, by Application 2020 & 2033
- Table 42: France Soybean Rust Control Volume (K) Forecast, by Application 2020 & 2033
- Table 43: Italy Soybean Rust Control Revenue (million) Forecast, by Application 2020 & 2033
- Table 44: Italy Soybean Rust Control Volume (K) Forecast, by Application 2020 & 2033
- Table 45: Spain Soybean Rust Control Revenue (million) Forecast, by Application 2020 & 2033
- Table 46: Spain Soybean Rust Control Volume (K) Forecast, by Application 2020 & 2033
- Table 47: Russia Soybean Rust Control Revenue (million) Forecast, by Application 2020 & 2033
- Table 48: Russia Soybean Rust Control Volume (K) Forecast, by Application 2020 & 2033
- Table 49: Benelux Soybean Rust Control Revenue (million) Forecast, by Application 2020 & 2033
- Table 50: Benelux Soybean Rust Control Volume (K) Forecast, by Application 2020 & 2033
- Table 51: Nordics Soybean Rust Control Revenue (million) Forecast, by Application 2020 & 2033
- Table 52: Nordics Soybean Rust Control Volume (K) Forecast, by Application 2020 & 2033
- Table 53: Rest of Europe Soybean Rust Control Revenue (million) Forecast, by Application 2020 & 2033
- Table 54: Rest of Europe Soybean Rust Control Volume (K) Forecast, by Application 2020 & 2033
- Table 55: Global Soybean Rust Control Revenue million Forecast, by Application 2020 & 2033
- Table 56: Global Soybean Rust Control Volume K Forecast, by Application 2020 & 2033
- Table 57: Global Soybean Rust Control Revenue million Forecast, by Types 2020 & 2033
- Table 58: Global Soybean Rust Control Volume K Forecast, by Types 2020 & 2033
- Table 59: Global Soybean Rust Control Revenue million Forecast, by Country 2020 & 2033
- Table 60: Global Soybean Rust Control Volume K Forecast, by Country 2020 & 2033
- Table 61: Turkey Soybean Rust Control Revenue (million) Forecast, by Application 2020 & 2033
- Table 62: Turkey Soybean Rust Control Volume (K) Forecast, by Application 2020 & 2033
- Table 63: Israel Soybean Rust Control Revenue (million) Forecast, by Application 2020 & 2033
- Table 64: Israel Soybean Rust Control Volume (K) Forecast, by Application 2020 & 2033
- Table 65: GCC Soybean Rust Control Revenue (million) Forecast, by Application 2020 & 2033
- Table 66: GCC Soybean Rust Control Volume (K) Forecast, by Application 2020 & 2033
- Table 67: North Africa Soybean Rust Control Revenue (million) Forecast, by Application 2020 & 2033
- Table 68: North Africa Soybean Rust Control Volume (K) Forecast, by Application 2020 & 2033
- Table 69: South Africa Soybean Rust Control Revenue (million) Forecast, by Application 2020 & 2033
- Table 70: South Africa Soybean Rust Control Volume (K) Forecast, by Application 2020 & 2033
- Table 71: Rest of Middle East & Africa Soybean Rust Control Revenue (million) Forecast, by Application 2020 & 2033
- Table 72: Rest of Middle East & Africa Soybean Rust Control Volume (K) Forecast, by Application 2020 & 2033
- Table 73: Global Soybean Rust Control Revenue million Forecast, by Application 2020 & 2033
- Table 74: Global Soybean Rust Control Volume K Forecast, by Application 2020 & 2033
- Table 75: Global Soybean Rust Control Revenue million Forecast, by Types 2020 & 2033
- Table 76: Global Soybean Rust Control Volume K Forecast, by Types 2020 & 2033
- Table 77: Global Soybean Rust Control Revenue million Forecast, by Country 2020 & 2033
- Table 78: Global Soybean Rust Control Volume K Forecast, by Country 2020 & 2033
- Table 79: China Soybean Rust Control Revenue (million) Forecast, by Application 2020 & 2033
- Table 80: China Soybean Rust Control Volume (K) Forecast, by Application 2020 & 2033
- Table 81: India Soybean Rust Control Revenue (million) Forecast, by Application 2020 & 2033
- Table 82: India Soybean Rust Control Volume (K) Forecast, by Application 2020 & 2033
- Table 83: Japan Soybean Rust Control Revenue (million) Forecast, by Application 2020 & 2033
- Table 84: Japan Soybean Rust Control Volume (K) Forecast, by Application 2020 & 2033
- Table 85: South Korea Soybean Rust Control Revenue (million) Forecast, by Application 2020 & 2033
- Table 86: South Korea Soybean Rust Control Volume (K) Forecast, by Application 2020 & 2033
- Table 87: ASEAN Soybean Rust Control Revenue (million) Forecast, by Application 2020 & 2033
- Table 88: ASEAN Soybean Rust Control Volume (K) Forecast, by Application 2020 & 2033
- Table 89: Oceania Soybean Rust Control Revenue (million) Forecast, by Application 2020 & 2033
- Table 90: Oceania Soybean Rust Control Volume (K) Forecast, by Application 2020 & 2033
- Table 91: Rest of Asia Pacific Soybean Rust Control Revenue (million) Forecast, by Application 2020 & 2033
- Table 92: Rest of Asia Pacific Soybean Rust Control Volume (K) Forecast, by Application 2020 & 2033
Frequently Asked Questions
1. What is the projected Compound Annual Growth Rate (CAGR) of the Soybean Rust Control?
The projected CAGR is approximately XX%.
2. Which companies are prominent players in the Soybean Rust Control?
Key companies in the market include Corteva Agriscience, Bayer AG, Syngenta, BASF, Nufarm, UPL, FMC Corporation, Adama Agricultural, Ourofino Agrociência, Sumitomo Chemical Co Ltd, Albaugh LLC, Nortox, Rotam.
3. What are the main segments of the Soybean Rust Control?
The market segments include Application, Types.
4. Can you provide details about the market size?
The market size is estimated to be USD XXX million as of 2022.
5. What are some drivers contributing to market growth?
N/A
6. What are the notable trends driving market growth?
N/A
7. Are there any restraints impacting market growth?
N/A
8. Can you provide examples of recent developments in the market?
N/A
9. What pricing options are available for accessing the report?
Pricing options include single-user, multi-user, and enterprise licenses priced at USD 3950.00, USD 5925.00, and USD 7900.00 respectively.
10. Is the market size provided in terms of value or volume?
The market size is provided in terms of value, measured in million and volume, measured in K.
11. Are there any specific market keywords associated with the report?
Yes, the market keyword associated with the report is "Soybean Rust Control," which aids in identifying and referencing the specific market segment covered.
12. How do I determine which pricing option suits my needs best?
The pricing options vary based on user requirements and access needs. Individual users may opt for single-user licenses, while businesses requiring broader access may choose multi-user or enterprise licenses for cost-effective access to the report.
13. Are there any additional resources or data provided in the Soybean Rust Control report?
While the report offers comprehensive insights, it's advisable to review the specific contents or supplementary materials provided to ascertain if additional resources or data are available.
14. How can I stay updated on further developments or reports in the Soybean Rust Control?
To stay informed about further developments, trends, and reports in the Soybean Rust Control, consider subscribing to industry newsletters, following relevant companies and organizations, or regularly checking reputable industry news sources and publications.
Methodology
Step 1 - Identification of Relevant Samples Size from Population Database


Step 2 - Approaches for Defining Global Market Size (Value, Volume* & Price*)

Note*: In applicable scenarios
Step 3 - Data Sources
Primary Research
- Web Analytics
- Survey Reports
- Research Institute
- Latest Research Reports
- Opinion Leaders
Secondary Research
- Annual Reports
- White Paper
- Latest Press Release
- Industry Association
- Paid Database
- Investor Presentations

Step 4 - Data Triangulation
Involves using different sources of information in order to increase the validity of a study
These sources are likely to be stakeholders in a program - participants, other researchers, program staff, other community members, and so on.
Then we put all data in single framework & apply various statistical tools to find out the dynamic on the market.
During the analysis stage, feedback from the stakeholder groups would be compared to determine areas of agreement as well as areas of divergence