

Key Insights
The Southeast Asia cross-border e-commerce market is exhibiting substantial growth, propelled by increasing internet and smartphone adoption, a youthful demographic, and an expanding middle class with enhanced purchasing power. The market's Compound Annual Growth Rate (CAGR) is projected to be approximately 21.13%, indicating significant expansion opportunities throughout the forecast period. Key growth drivers include the growing preference for online shopping convenience, competitive pricing on cross-border platforms, and the wider availability of diverse products not accessible domestically. While logistical hurdles and cross-border regulations present challenges, innovative solutions are actively mitigating these constraints. The market is segmented by business type (B2B, B2C), product categories (led by fashion and apparel, followed by consumer electronics, beauty and personal care, and others), and country (with key markets including Singapore, Thailand, Vietnam, Indonesia, Malaysia, and the Philippines). Major players like Alibaba, Shopee, and Lazada are fiercely competing, driving innovation and consumer choice. The B2C segment is anticipated to lead due to its large consumer base and rising purchasing power, while fashion and apparel will likely retain its dominant share owing to the region's fashion-forward population. Future expansion is contingent upon continued infrastructure development, regulatory enhancements, and the widespread adoption of secure payment gateways.
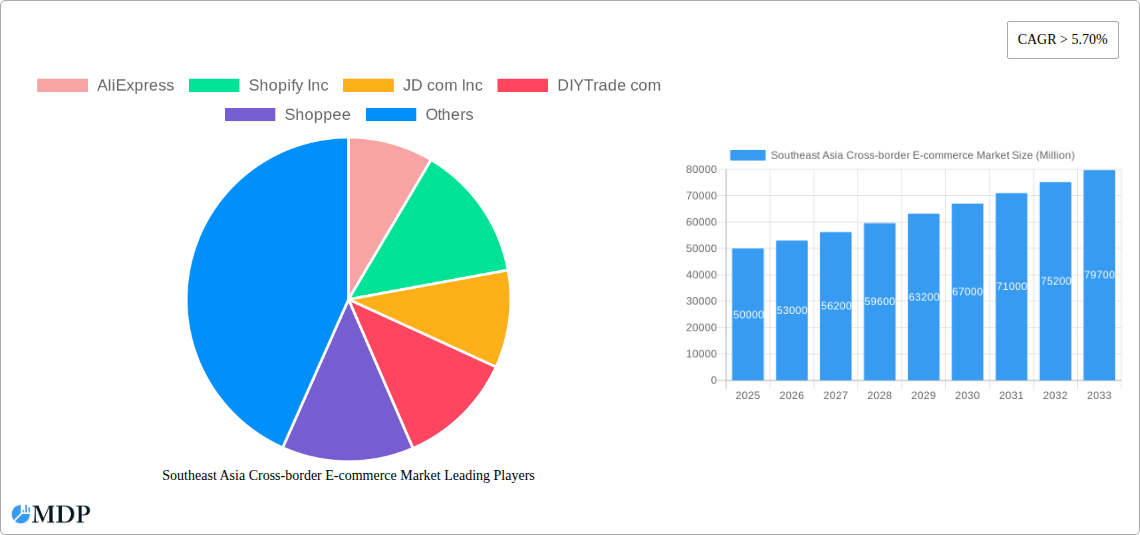
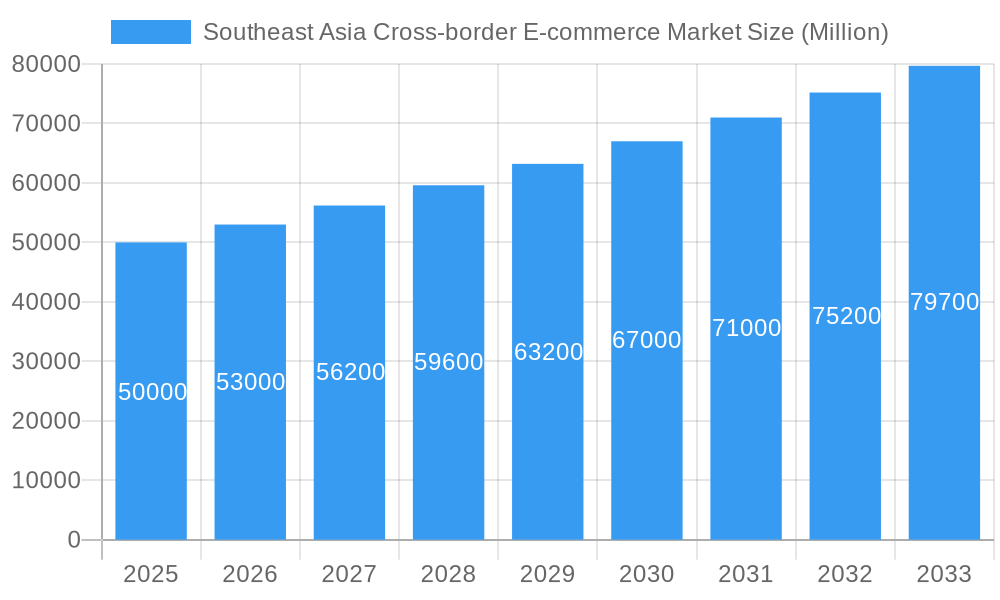
Southeast Asia Cross-border E-commerce Market Market Size (In Billion)
The market size, estimated at 201.92 billion in the base year 2024, underscores the considerable investment and expansion opportunities within the region. This growth is further supported by the increasing adoption of mobile commerce, the expansion of digital payment systems, and government initiatives promoting digital economies. However, challenges such as concerns regarding counterfeit products, data security, and varying digital literacy levels persist. Addressing these issues is critical for sustained growth and the development of a robust and trustworthy cross-border e-commerce ecosystem in Southeast Asia. This necessitates collaborative efforts between governments, e-commerce platforms, and logistics providers to foster a conducive regulatory environment and improve infrastructure.
Southeast Asia Cross-border E-commerce Market Company Market Share
Southeast Asia Cross-border E-commerce Market: A Comprehensive Report (2019-2033)
This in-depth report provides a comprehensive analysis of the dynamic Southeast Asia cross-border e-commerce market, covering the period from 2019 to 2033. It delves into market size, growth drivers, competitive landscape, and future opportunities, offering invaluable insights for businesses, investors, and policymakers. Expect detailed analysis across key segments, including B2B and B2C, major product categories, and individual countries within Southeast Asia. The report leverages data from the historical period (2019-2024), utilizes 2025 as the base and estimated year, and projects market trends up to 2033.
Southeast Asia Cross-border E-commerce Market Dynamics & Concentration
The Southeast Asia cross-border e-commerce market exhibits a highly competitive landscape with significant market concentration among major players like Shopee, Lazada, and Alibaba Group Holding Limited. Market share dynamics are influenced by factors including brand recognition, logistical capabilities, payment gateway integration, and marketing strategies. The market’s rapid growth is fueled by increasing internet and smartphone penetration, rising disposable incomes, and a preference for online shopping among the region's young and tech-savvy population. However, regulatory complexities and varying levels of digital infrastructure across different countries present challenges. Innovation in areas such as fintech, logistics, and personalized marketing is driving market evolution.
- Market Concentration: The top 5 players control approximately xx% of the market share (2025 est.).
- M&A Activity: The historical period (2019-2024) witnessed xx M&A deals, primarily focused on strengthening logistics and payment solutions.
- Innovation Drivers: Advancements in mobile commerce, AI-powered personalization, and blockchain technology are key innovation drivers.
- Regulatory Frameworks: Varying regulations across countries pose a challenge to seamless cross-border trade.
- Product Substitutes: Traditional retail channels remain a significant, albeit declining, competitor.
- End-User Trends: A growing preference for online shopping, especially among younger demographics, fuels market growth.
Southeast Asia Cross-border E-commerce Market Industry Trends & Analysis
The Southeast Asia cross-border e-commerce market is experiencing phenomenal growth, with a projected CAGR of xx% from 2025 to 2033. This robust growth is driven by several factors, including rising internet penetration and smartphone usage, increasing disposable incomes, particularly among the burgeoning middle class, and the expanding adoption of digital payment solutions. Consumer preferences are shifting towards convenience, personalized experiences, and competitive pricing. The rise of social commerce, particularly on platforms like Shopee and Lazada, is further accelerating market expansion. However, the market is not without its challenges, including logistical complexities, concerns over data security, and cross-border payment processing hurdles. The competitive landscape is intensely dynamic, with established global players and nimble regional startups vying for market share.
Market penetration currently stands at xx% in 2025, expected to increase to xx% by 2033.
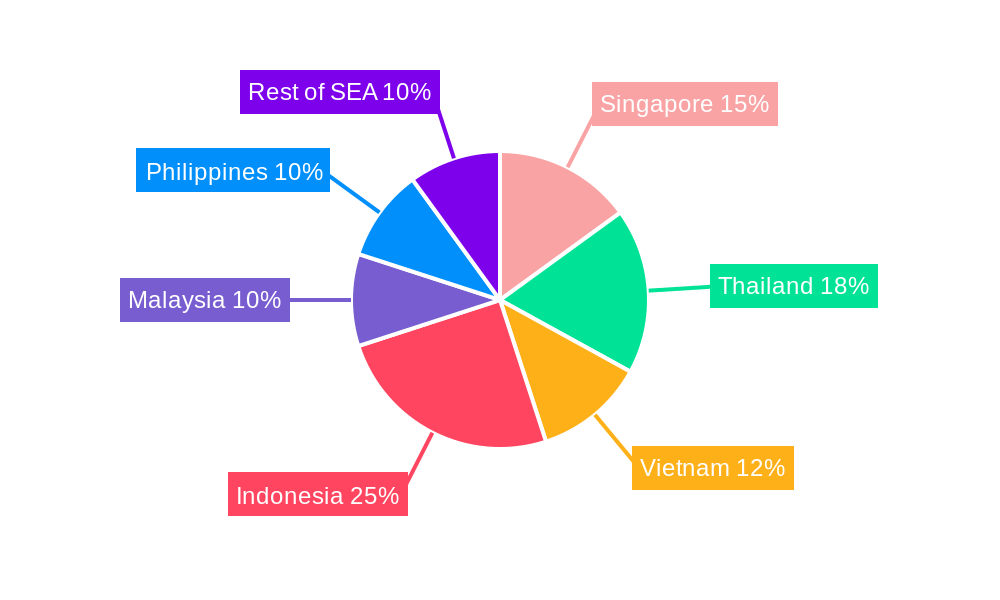
Leading Markets & Segments in Southeast Asia Cross-border E-commerce Market
Indonesia, Vietnam, and Thailand are currently leading the Southeast Asia cross-border e-commerce market due to their large populations and rapid economic growth. The B2C segment dominates, fueled by the rising middle class and increasing consumer spending. Within product categories, Fashion and Apparel, Consumer Electronics, and Beauty and Personal Care Products are high-growth segments.
Key Drivers by Country:
- Indonesia: Large population, rising middle class, high smartphone penetration.
- Vietnam: Young and tech-savvy population, increasing disposable incomes.
- Thailand: Well-developed logistics infrastructure, strong government support for e-commerce.
- Singapore: High internet penetration, sophisticated consumer base.
- Malaysia: Growing adoption of online shopping, supportive government policies.
- Philippines: Increasing smartphone usage, expanding digital payments adoption.
Dominance Analysis:
Indonesia's sheer market size and rapid digital adoption position it as the dominant market. However, Vietnam and Thailand are rapidly closing the gap, presenting significant opportunities for e-commerce players. The B2C segment enjoys greater dominance due to increased consumer spending and preference for convenience. Fashion and Apparel, Consumer Electronics, and Beauty and Personal Care products hold the largest market share within product categories.
Southeast Asia Cross-border E-commerce Market Product Developments
Product innovations are centered around enhancing the customer experience through personalization, improved logistics, and secure payment gateways. The adoption of AI-powered recommendation engines and augmented reality (AR) features is enhancing customer engagement. Seamless cross-border payment solutions and improved last-mile delivery are crucial competitive advantages. The integration of mobile wallets and Buy Now Pay Later (BNPL) options are reshaping the payment landscape.
Key Drivers of Southeast Asia Cross-border E-commerce Market Growth
Several factors are driving the expansion of the Southeast Asia cross-border e-commerce market. Firstly, a surge in internet and smartphone penetration provides a vast pool of potential customers. Secondly, rising disposable incomes and a growing middle class fuel increased consumer spending on online goods and services. Thirdly, government initiatives to improve digital infrastructure and promote e-commerce further boost market growth. Finally, advancements in fintech, including the expansion of digital payment platforms, are making cross-border transactions easier and more secure. The example of Akulaku's partnership with Alipay+ highlights the acceleration of BNPL options in the region.
Challenges in the Southeast Asia Cross-border E-commerce Market Market
The market faces significant challenges, including inconsistencies in regulatory frameworks across different countries, increasing logistical complexities in delivering goods across borders, and managing the risks associated with cross-border payments. These issues create barriers to entry for smaller businesses and add complexity for larger multinational corporations. Competition is fierce, with major players such as Shopee and Lazada battling for dominance. The current supply chain disruptions contribute to higher costs and delays, negatively impacting profitability and consumer satisfaction. The estimated negative impact of these challenges on market growth is xx Million.
Emerging Opportunities in Southeast Asia Cross-border E-commerce Market
Long-term growth is fueled by continuing advancements in logistics and technology, creating more efficient and cost-effective delivery systems. Strategic partnerships between e-commerce platforms and logistics providers are streamlining cross-border shipping. Expanding into underserved rural markets and targeting specific demographic segments offer significant opportunities. The continuing development of fintech and digital payment solutions will further accelerate e-commerce growth.
Leading Players in the Southeast Asia Cross-border E-commerce Market Sector
- AliExpress
- Shopify Inc
- JD.com Inc
- DIYTrade.com
- Shopee
- Lazada
- ChinaASEAN.com
- Bukalapak
- Amazon.com Inc
- Qoo10
- eBay Inc
- Tokopedia
- Alibaba Group Holding Limited
List Not Exhaustive
Key Milestones in Southeast Asia Cross-border E-commerce Market Industry
- September 2022: Akulaku partners with Alipay+, expanding BNPL options for Indonesian consumers. This significantly increases the accessibility of cross-border purchases for Indonesians.
- February 2022: Razorpay's acquisition of Curlec marks its expansion into Southeast Asia, enhancing recurring payment solutions for businesses. This strengthens the fintech infrastructure supporting cross-border e-commerce.
Strategic Outlook for Southeast Asia Cross-border E-commerce Market Market
The Southeast Asia cross-border e-commerce market is poised for sustained growth, driven by ongoing technological advancements, increasing digital literacy, and supportive government policies. Companies that invest in superior logistics, personalized marketing, and secure payment gateways will be best positioned to capitalize on future market opportunities. The focus on enhancing customer experience and expanding into underserved markets will be critical for long-term success. The market's projected value will continue to rise significantly over the forecast period, driven by these factors and further technological innovations.
Southeast Asia Cross-border E-commerce Market Segmentation
-
1. Business
- 1.1. B2B
- 1.2. B2C
-
2. Product
- 2.1. Fashion and Apparel
- 2.2. Consumer Electronics
- 2.3. Home Appliances
- 2.4. Furniture
- 2.5. Beauty and Personal Care Products
- 2.6. Other Products (Toys, Food Products, etc.)
Southeast Asia Cross-border E-commerce Market Segmentation By Geography
-
1. North America
- 1.1. United States
- 1.2. Canada
- 1.3. Mexico
-
2. South America
- 2.1. Brazil
- 2.2. Argentina
- 2.3. Rest of South America
-
3. Europe
- 3.1. United Kingdom
- 3.2. Germany
- 3.3. France
- 3.4. Italy
- 3.5. Spain
- 3.6. Russia
- 3.7. Benelux
- 3.8. Nordics
- 3.9. Rest of Europe
-
4. Middle East & Africa
- 4.1. Turkey
- 4.2. Israel
- 4.3. GCC
- 4.4. North Africa
- 4.5. South Africa
- 4.6. Rest of Middle East & Africa
-
5. Asia Pacific
- 5.1. China
- 5.2. India
- 5.3. Japan
- 5.4. South Korea
- 5.5. ASEAN
- 5.6. Oceania
- 5.7. Rest of Asia Pacific
Southeast Asia Cross-border E-commerce Market Regional Market Share
Geographic Coverage of Southeast Asia Cross-border E-commerce Market
Southeast Asia Cross-border E-commerce Market REPORT HIGHLIGHTS
| Aspects | Details |
|---|---|
| Study Period | 2020-2034 |
| Base Year | 2025 |
| Estimated Year | 2026 |
| Forecast Period | 2026-2034 |
| Historical Period | 2020-2025 |
| Growth Rate | CAGR of 21.13% from 2020-2034 |
| Segmentation |
|
Table of Contents
- 1. Introduction
- 1.1. Research Scope
- 1.2. Market Segmentation
- 1.3. Research Objective
- 1.4. Definitions and Assumptions
- 2. Executive Summary
- 2.1. Market Snapshot
- 3. Market Dynamics
- 3.1. Market Drivers
- 3.2. Market Restrains
- 3.3. Market Trends
- 3.4. Market Opportunities
- 4. Market Factor Analysis
- 4.1. Porters Five Forces
- 4.1.1. Bargaining Power of Suppliers
- 4.1.2. Bargaining Power of Buyers
- 4.1.3. Threat of New Entrants
- 4.1.4. Threat of Substitutes
- 4.1.5. Competitive Rivalry
- 4.2. PESTEL analysis
- 4.3. BCG Analysis
- 4.3.1. Stars (High Growth, High Market Share)
- 4.3.2. Cash Cows (Low Growth, High Market Share)
- 4.3.3. Question Mark (High Growth, Low Market Share)
- 4.3.4. Dogs (Low Growth, Low Market Share)
- 4.4. Ansoff Matrix Analysis
- 4.5. Supply Chain Analysis
- 4.6. Regulatory Landscape
- 4.7. Current Market Potential and Opportunity Assessment (TAM–SAM–SOM Framework)
- 4.8. MDP Analyst Note
- 4.1. Porters Five Forces
- 5. Market Analysis, Insights and Forecast 2021-2033
- 5.1. Market Analysis, Insights and Forecast - by Business
- 5.1.1. B2B
- 5.1.2. B2C
- 5.2. Market Analysis, Insights and Forecast - by Product
- 5.2.1. Fashion and Apparel
- 5.2.2. Consumer Electronics
- 5.2.3. Home Appliances
- 5.2.4. Furniture
- 5.2.5. Beauty and Personal Care Products
- 5.2.6. Other Products (Toys, Food Products, etc.)
- 5.3. Market Analysis, Insights and Forecast - by Region
- 5.3.1. North America
- 5.3.2. South America
- 5.3.3. Europe
- 5.3.4. Middle East & Africa
- 5.3.5. Asia Pacific
- 5.1. Market Analysis, Insights and Forecast - by Business
- 6. Global Southeast Asia Cross-border E-commerce Market Analysis, Insights and Forecast, 2021-2033
- 6.1. Market Analysis, Insights and Forecast - by Business
- 6.1.1. B2B
- 6.1.2. B2C
- 6.2. Market Analysis, Insights and Forecast - by Product
- 6.2.1. Fashion and Apparel
- 6.2.2. Consumer Electronics
- 6.2.3. Home Appliances
- 6.2.4. Furniture
- 6.2.5. Beauty and Personal Care Products
- 6.2.6. Other Products (Toys, Food Products, etc.)
- 6.1. Market Analysis, Insights and Forecast - by Business
- 7. North America Southeast Asia Cross-border E-commerce Market Analysis, Insights and Forecast, 2020-2032
- 7.1. Market Analysis, Insights and Forecast - by Business
- 7.1.1. B2B
- 7.1.2. B2C
- 7.2. Market Analysis, Insights and Forecast - by Product
- 7.2.1. Fashion and Apparel
- 7.2.2. Consumer Electronics
- 7.2.3. Home Appliances
- 7.2.4. Furniture
- 7.2.5. Beauty and Personal Care Products
- 7.2.6. Other Products (Toys, Food Products, etc.)
- 7.1. Market Analysis, Insights and Forecast - by Business
- 8. South America Southeast Asia Cross-border E-commerce Market Analysis, Insights and Forecast, 2020-2032
- 8.1. Market Analysis, Insights and Forecast - by Business
- 8.1.1. B2B
- 8.1.2. B2C
- 8.2. Market Analysis, Insights and Forecast - by Product
- 8.2.1. Fashion and Apparel
- 8.2.2. Consumer Electronics
- 8.2.3. Home Appliances
- 8.2.4. Furniture
- 8.2.5. Beauty and Personal Care Products
- 8.2.6. Other Products (Toys, Food Products, etc.)
- 8.1. Market Analysis, Insights and Forecast - by Business
- 9. Europe Southeast Asia Cross-border E-commerce Market Analysis, Insights and Forecast, 2020-2032
- 9.1. Market Analysis, Insights and Forecast - by Business
- 9.1.1. B2B
- 9.1.2. B2C
- 9.2. Market Analysis, Insights and Forecast - by Product
- 9.2.1. Fashion and Apparel
- 9.2.2. Consumer Electronics
- 9.2.3. Home Appliances
- 9.2.4. Furniture
- 9.2.5. Beauty and Personal Care Products
- 9.2.6. Other Products (Toys, Food Products, etc.)
- 9.1. Market Analysis, Insights and Forecast - by Business
- 10. Middle East & Africa Southeast Asia Cross-border E-commerce Market Analysis, Insights and Forecast, 2020-2032
- 10.1. Market Analysis, Insights and Forecast - by Business
- 10.1.1. B2B
- 10.1.2. B2C
- 10.2. Market Analysis, Insights and Forecast - by Product
- 10.2.1. Fashion and Apparel
- 10.2.2. Consumer Electronics
- 10.2.3. Home Appliances
- 10.2.4. Furniture
- 10.2.5. Beauty and Personal Care Products
- 10.2.6. Other Products (Toys, Food Products, etc.)
- 10.1. Market Analysis, Insights and Forecast - by Business
- 11. Asia Pacific Southeast Asia Cross-border E-commerce Market Analysis, Insights and Forecast, 2020-2032
- 11.1. Market Analysis, Insights and Forecast - by Business
- 11.1.1. B2B
- 11.1.2. B2C
- 11.2. Market Analysis, Insights and Forecast - by Product
- 11.2.1. Fashion and Apparel
- 11.2.2. Consumer Electronics
- 11.2.3. Home Appliances
- 11.2.4. Furniture
- 11.2.5. Beauty and Personal Care Products
- 11.2.6. Other Products (Toys, Food Products, etc.)
- 11.1. Market Analysis, Insights and Forecast - by Business
- 12. Competitive Analysis
- 12.1. Company Profiles
- 12.1.1 AliExpress
- 12.1.1.1. Company Overview
- 12.1.1.2. Products
- 12.1.1.3. Company Financials
- 12.1.1.4. SWOT Analysis
- 12.1.2 Shopify Inc
- 12.1.2.1. Company Overview
- 12.1.2.2. Products
- 12.1.2.3. Company Financials
- 12.1.2.4. SWOT Analysis
- 12.1.3 JD com Inc
- 12.1.3.1. Company Overview
- 12.1.3.2. Products
- 12.1.3.3. Company Financials
- 12.1.3.4. SWOT Analysis
- 12.1.4 DIYTrade com
- 12.1.4.1. Company Overview
- 12.1.4.2. Products
- 12.1.4.3. Company Financials
- 12.1.4.4. SWOT Analysis
- 12.1.5 Shoppee
- 12.1.5.1. Company Overview
- 12.1.5.2. Products
- 12.1.5.3. Company Financials
- 12.1.5.4. SWOT Analysis
- 12.1.6 Lazada
- 12.1.6.1. Company Overview
- 12.1.6.2. Products
- 12.1.6.3. Company Financials
- 12.1.6.4. SWOT Analysis
- 12.1.7 ChinaAseanTrade com
- 12.1.7.1. Company Overview
- 12.1.7.2. Products
- 12.1.7.3. Company Financials
- 12.1.7.4. SWOT Analysis
- 12.1.8 Bukalapak
- 12.1.8.1. Company Overview
- 12.1.8.2. Products
- 12.1.8.3. Company Financials
- 12.1.8.4. SWOT Analysis
- 12.1.9 Amazon com Inc
- 12.1.9.1. Company Overview
- 12.1.9.2. Products
- 12.1.9.3. Company Financials
- 12.1.9.4. SWOT Analysis
- 12.1.10 Qoo
- 12.1.10.1. Company Overview
- 12.1.10.2. Products
- 12.1.10.3. Company Financials
- 12.1.10.4. SWOT Analysis
- 12.1.11 eBay Inc
- 12.1.11.1. Company Overview
- 12.1.11.2. Products
- 12.1.11.3. Company Financials
- 12.1.11.4. SWOT Analysis
- 12.1.12 Tokopedia
- 12.1.12.1. Company Overview
- 12.1.12.2. Products
- 12.1.12.3. Company Financials
- 12.1.12.4. SWOT Analysis
- 12.1.13 Alibaba Group Holding Limited **List Not Exhaustive
- 12.1.13.1. Company Overview
- 12.1.13.2. Products
- 12.1.13.3. Company Financials
- 12.1.13.4. SWOT Analysis
- 12.1.1 AliExpress
- 12.2. Market Entropy
- 12.2.1 Company's Key Areas Served
- 12.2.2 Recent Developments
- 12.3. Company Market Share Analysis 2025
- 12.3.1 Top 5 Companies Market Share Analysis
- 12.3.2 Top 3 Companies Market Share Analysis
- 12.4. List of Potential Customers
- 13. Research Methodology
List of Figures
- Figure 1: Global Southeast Asia Cross-border E-commerce Market Revenue Breakdown (billion, %) by Region 2025 & 2033
- Figure 2: North America Southeast Asia Cross-border E-commerce Market Revenue (billion), by Business 2025 & 2033
- Figure 3: North America Southeast Asia Cross-border E-commerce Market Revenue Share (%), by Business 2025 & 2033
- Figure 4: North America Southeast Asia Cross-border E-commerce Market Revenue (billion), by Product 2025 & 2033
- Figure 5: North America Southeast Asia Cross-border E-commerce Market Revenue Share (%), by Product 2025 & 2033
- Figure 6: North America Southeast Asia Cross-border E-commerce Market Revenue (billion), by Country 2025 & 2033
- Figure 7: North America Southeast Asia Cross-border E-commerce Market Revenue Share (%), by Country 2025 & 2033
- Figure 8: South America Southeast Asia Cross-border E-commerce Market Revenue (billion), by Business 2025 & 2033
- Figure 9: South America Southeast Asia Cross-border E-commerce Market Revenue Share (%), by Business 2025 & 2033
- Figure 10: South America Southeast Asia Cross-border E-commerce Market Revenue (billion), by Product 2025 & 2033
- Figure 11: South America Southeast Asia Cross-border E-commerce Market Revenue Share (%), by Product 2025 & 2033
- Figure 12: South America Southeast Asia Cross-border E-commerce Market Revenue (billion), by Country 2025 & 2033
- Figure 13: South America Southeast Asia Cross-border E-commerce Market Revenue Share (%), by Country 2025 & 2033
- Figure 14: Europe Southeast Asia Cross-border E-commerce Market Revenue (billion), by Business 2025 & 2033
- Figure 15: Europe Southeast Asia Cross-border E-commerce Market Revenue Share (%), by Business 2025 & 2033
- Figure 16: Europe Southeast Asia Cross-border E-commerce Market Revenue (billion), by Product 2025 & 2033
- Figure 17: Europe Southeast Asia Cross-border E-commerce Market Revenue Share (%), by Product 2025 & 2033
- Figure 18: Europe Southeast Asia Cross-border E-commerce Market Revenue (billion), by Country 2025 & 2033
- Figure 19: Europe Southeast Asia Cross-border E-commerce Market Revenue Share (%), by Country 2025 & 2033
- Figure 20: Middle East & Africa Southeast Asia Cross-border E-commerce Market Revenue (billion), by Business 2025 & 2033
- Figure 21: Middle East & Africa Southeast Asia Cross-border E-commerce Market Revenue Share (%), by Business 2025 & 2033
- Figure 22: Middle East & Africa Southeast Asia Cross-border E-commerce Market Revenue (billion), by Product 2025 & 2033
- Figure 23: Middle East & Africa Southeast Asia Cross-border E-commerce Market Revenue Share (%), by Product 2025 & 2033
- Figure 24: Middle East & Africa Southeast Asia Cross-border E-commerce Market Revenue (billion), by Country 2025 & 2033
- Figure 25: Middle East & Africa Southeast Asia Cross-border E-commerce Market Revenue Share (%), by Country 2025 & 2033
- Figure 26: Asia Pacific Southeast Asia Cross-border E-commerce Market Revenue (billion), by Business 2025 & 2033
- Figure 27: Asia Pacific Southeast Asia Cross-border E-commerce Market Revenue Share (%), by Business 2025 & 2033
- Figure 28: Asia Pacific Southeast Asia Cross-border E-commerce Market Revenue (billion), by Product 2025 & 2033
- Figure 29: Asia Pacific Southeast Asia Cross-border E-commerce Market Revenue Share (%), by Product 2025 & 2033
- Figure 30: Asia Pacific Southeast Asia Cross-border E-commerce Market Revenue (billion), by Country 2025 & 2033
- Figure 31: Asia Pacific Southeast Asia Cross-border E-commerce Market Revenue Share (%), by Country 2025 & 2033
List of Tables
- Table 1: Global Southeast Asia Cross-border E-commerce Market Revenue billion Forecast, by Business 2020 & 2033
- Table 2: Global Southeast Asia Cross-border E-commerce Market Revenue billion Forecast, by Product 2020 & 2033
- Table 3: Global Southeast Asia Cross-border E-commerce Market Revenue billion Forecast, by Region 2020 & 2033
- Table 4: Global Southeast Asia Cross-border E-commerce Market Revenue billion Forecast, by Business 2020 & 2033
- Table 5: Global Southeast Asia Cross-border E-commerce Market Revenue billion Forecast, by Product 2020 & 2033
- Table 6: Global Southeast Asia Cross-border E-commerce Market Revenue billion Forecast, by Country 2020 & 2033
- Table 7: United States Southeast Asia Cross-border E-commerce Market Revenue (billion) Forecast, by Application 2020 & 2033
- Table 8: Canada Southeast Asia Cross-border E-commerce Market Revenue (billion) Forecast, by Application 2020 & 2033
- Table 9: Mexico Southeast Asia Cross-border E-commerce Market Revenue (billion) Forecast, by Application 2020 & 2033
- Table 10: Global Southeast Asia Cross-border E-commerce Market Revenue billion Forecast, by Business 2020 & 2033
- Table 11: Global Southeast Asia Cross-border E-commerce Market Revenue billion Forecast, by Product 2020 & 2033
- Table 12: Global Southeast Asia Cross-border E-commerce Market Revenue billion Forecast, by Country 2020 & 2033
- Table 13: Brazil Southeast Asia Cross-border E-commerce Market Revenue (billion) Forecast, by Application 2020 & 2033
- Table 14: Argentina Southeast Asia Cross-border E-commerce Market Revenue (billion) Forecast, by Application 2020 & 2033
- Table 15: Rest of South America Southeast Asia Cross-border E-commerce Market Revenue (billion) Forecast, by Application 2020 & 2033
- Table 16: Global Southeast Asia Cross-border E-commerce Market Revenue billion Forecast, by Business 2020 & 2033
- Table 17: Global Southeast Asia Cross-border E-commerce Market Revenue billion Forecast, by Product 2020 & 2033
- Table 18: Global Southeast Asia Cross-border E-commerce Market Revenue billion Forecast, by Country 2020 & 2033
- Table 19: United Kingdom Southeast Asia Cross-border E-commerce Market Revenue (billion) Forecast, by Application 2020 & 2033
- Table 20: Germany Southeast Asia Cross-border E-commerce Market Revenue (billion) Forecast, by Application 2020 & 2033
- Table 21: France Southeast Asia Cross-border E-commerce Market Revenue (billion) Forecast, by Application 2020 & 2033
- Table 22: Italy Southeast Asia Cross-border E-commerce Market Revenue (billion) Forecast, by Application 2020 & 2033
- Table 23: Spain Southeast Asia Cross-border E-commerce Market Revenue (billion) Forecast, by Application 2020 & 2033
- Table 24: Russia Southeast Asia Cross-border E-commerce Market Revenue (billion) Forecast, by Application 2020 & 2033
- Table 25: Benelux Southeast Asia Cross-border E-commerce Market Revenue (billion) Forecast, by Application 2020 & 2033
- Table 26: Nordics Southeast Asia Cross-border E-commerce Market Revenue (billion) Forecast, by Application 2020 & 2033
- Table 27: Rest of Europe Southeast Asia Cross-border E-commerce Market Revenue (billion) Forecast, by Application 2020 & 2033
- Table 28: Global Southeast Asia Cross-border E-commerce Market Revenue billion Forecast, by Business 2020 & 2033
- Table 29: Global Southeast Asia Cross-border E-commerce Market Revenue billion Forecast, by Product 2020 & 2033
- Table 30: Global Southeast Asia Cross-border E-commerce Market Revenue billion Forecast, by Country 2020 & 2033
- Table 31: Turkey Southeast Asia Cross-border E-commerce Market Revenue (billion) Forecast, by Application 2020 & 2033
- Table 32: Israel Southeast Asia Cross-border E-commerce Market Revenue (billion) Forecast, by Application 2020 & 2033
- Table 33: GCC Southeast Asia Cross-border E-commerce Market Revenue (billion) Forecast, by Application 2020 & 2033
- Table 34: North Africa Southeast Asia Cross-border E-commerce Market Revenue (billion) Forecast, by Application 2020 & 2033
- Table 35: South Africa Southeast Asia Cross-border E-commerce Market Revenue (billion) Forecast, by Application 2020 & 2033
- Table 36: Rest of Middle East & Africa Southeast Asia Cross-border E-commerce Market Revenue (billion) Forecast, by Application 2020 & 2033
- Table 37: Global Southeast Asia Cross-border E-commerce Market Revenue billion Forecast, by Business 2020 & 2033
- Table 38: Global Southeast Asia Cross-border E-commerce Market Revenue billion Forecast, by Product 2020 & 2033
- Table 39: Global Southeast Asia Cross-border E-commerce Market Revenue billion Forecast, by Country 2020 & 2033
- Table 40: China Southeast Asia Cross-border E-commerce Market Revenue (billion) Forecast, by Application 2020 & 2033
- Table 41: India Southeast Asia Cross-border E-commerce Market Revenue (billion) Forecast, by Application 2020 & 2033
- Table 42: Japan Southeast Asia Cross-border E-commerce Market Revenue (billion) Forecast, by Application 2020 & 2033
- Table 43: South Korea Southeast Asia Cross-border E-commerce Market Revenue (billion) Forecast, by Application 2020 & 2033
- Table 44: ASEAN Southeast Asia Cross-border E-commerce Market Revenue (billion) Forecast, by Application 2020 & 2033
- Table 45: Oceania Southeast Asia Cross-border E-commerce Market Revenue (billion) Forecast, by Application 2020 & 2033
- Table 46: Rest of Asia Pacific Southeast Asia Cross-border E-commerce Market Revenue (billion) Forecast, by Application 2020 & 2033
Frequently Asked Questions
1. What is the projected Compound Annual Growth Rate (CAGR) of the Southeast Asia Cross-border E-commerce Market?
The projected CAGR is approximately 21.13%.
2. Which companies are prominent players in the Southeast Asia Cross-border E-commerce Market?
Key companies in the market include AliExpress, Shopify Inc, JD com Inc, DIYTrade com, Shoppee, Lazada, ChinaAseanTrade com, Bukalapak, Amazon com Inc, Qoo, eBay Inc, Tokopedia, Alibaba Group Holding Limited **List Not Exhaustive.
3. What are the main segments of the Southeast Asia Cross-border E-commerce Market?
The market segments include Business, Product.
4. Can you provide details about the market size?
The market size is estimated to be USD 201.92 billion as of 2022.
5. What are some drivers contributing to market growth?
4.; Increasing International Trade Driving the Market4.; Increasing online users driving the market.
6. What are the notable trends driving market growth?
Growth in E-commerce sector in the region driving the market.
7. Are there any restraints impacting market growth?
4.; Regulatory Compliance Affecting the Market4.; High Competition in the Market.
8. Can you provide examples of recent developments in the market?
September 2022: Akulaku, a leading Southeast Asian banking and digital finance platform announced a partnership with Alipay+ that will allow Indonesian consumers to use its BNPL solution Akulaku PayLater at Alipay+'s global merchants. Alipay+, a suite of global cross-border digital payments and marketing solutions, will now support Akulaku PayLater, and merchants will be able to accept Akulaku PayLater as a payment method.
9. What pricing options are available for accessing the report?
Pricing options include single-user, multi-user, and enterprise licenses priced at USD 4750, USD 4950, and USD 6800 respectively.
10. Is the market size provided in terms of value or volume?
The market size is provided in terms of value, measured in billion.
11. Are there any specific market keywords associated with the report?
Yes, the market keyword associated with the report is "Southeast Asia Cross-border E-commerce Market," which aids in identifying and referencing the specific market segment covered.
12. How do I determine which pricing option suits my needs best?
The pricing options vary based on user requirements and access needs. Individual users may opt for single-user licenses, while businesses requiring broader access may choose multi-user or enterprise licenses for cost-effective access to the report.
13. Are there any additional resources or data provided in the Southeast Asia Cross-border E-commerce Market report?
While the report offers comprehensive insights, it's advisable to review the specific contents or supplementary materials provided to ascertain if additional resources or data are available.
14. How can I stay updated on further developments or reports in the Southeast Asia Cross-border E-commerce Market?
To stay informed about further developments, trends, and reports in the Southeast Asia Cross-border E-commerce Market, consider subscribing to industry newsletters, following relevant companies and organizations, or regularly checking reputable industry news sources and publications.
Methodology
Step 1 - Identification of Relevant Samples Size from Population Database


Step 2 - Approaches for Defining Global Market Size (Value, Volume* & Price*)

Note*: In applicable scenarios
Step 3 - Data Sources
Primary Research
- Web Analytics
- Survey Reports
- Research Institute
- Latest Research Reports
- Opinion Leaders
Secondary Research
- Annual Reports
- White Paper
- Latest Press Release
- Industry Association
- Paid Database
- Investor Presentations

Step 4 - Data Triangulation
Involves using different sources of information in order to increase the validity of a study
These sources are likely to be stakeholders in a program - participants, other researchers, program staff, other community members, and so on.
Then we put all data in single framework & apply various statistical tools to find out the dynamic on the market.
During the analysis stage, feedback from the stakeholder groups would be compared to determine areas of agreement as well as areas of divergence