

Key Insights
The global smart pet feeder market is poised for substantial expansion, driven by increasing pet adoption, rising disposable incomes, and the growing demand for convenient, tech-integrated pet care solutions. The market is segmented by application (dogs, cats, others), feeder capacity (under 5L, 5L-7L, over 7L), and geographical region. Projecting from available data, the market size is estimated at 8.1 billion in the base year 2025, with an anticipated Compound Annual Growth Rate (CAGR) of 7.15%. Key growth catalysts include the convenience of automated feeding schedules, precise portion control for pet health management, remote monitoring features, and seamless integration with smart home ecosystems. Emerging trends encompass AI-powered pet recognition, voice command functionality, and health monitoring capabilities. However, market expansion may be tempered by the higher initial investment compared to conventional feeders, potential concerns regarding technical reliability, and the necessity for stable internet connectivity. North America is projected to lead market share due to high pet ownership and technology adoption, followed by Europe and Asia Pacific. The competitive landscape features established brands and emerging innovators, indicating a vibrant market.
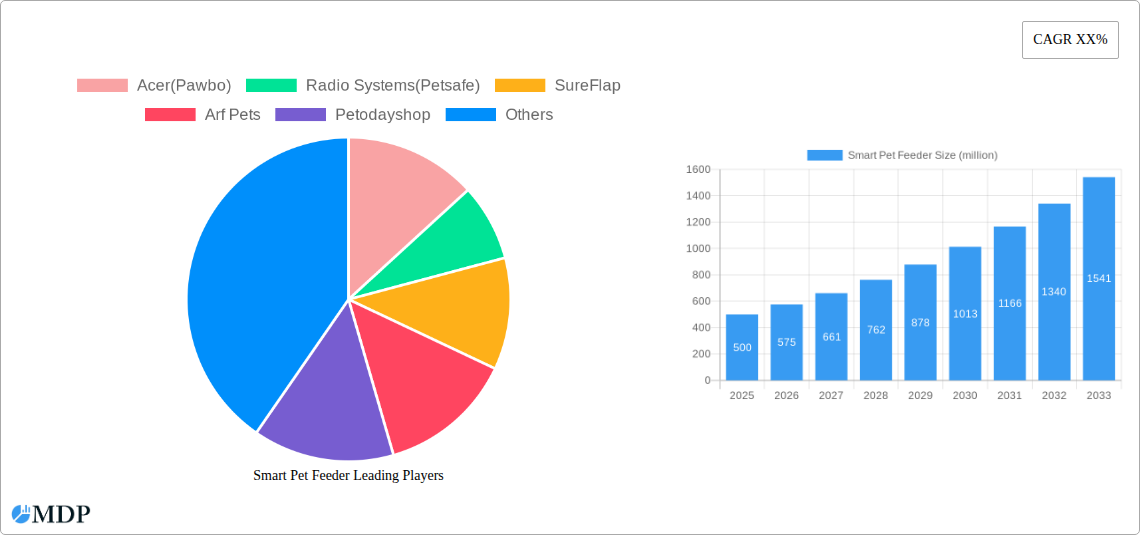
Smart Pet Feeder Market Size (In Billion)
Within the smart pet feeder market, specific segments exhibit varied growth trajectories. Larger capacity feeders (over 7L) are expected to witness accelerated growth, catering to multi-pet households or owners of larger breeds. While the dog segment currently dominates due to higher ownership rates, the cat segment is anticipated to experience significant growth, fueled by increasing feline companionship and a greater embrace of smart technology. Regional market penetration will likely differ, with developed economies demonstrating higher adoption rates. Success in this market will hinge on user-friendly interfaces, dependable connectivity, and innovative features that directly address pet owner needs and enhance the overall pet care experience. Strategic alliances with veterinary professionals and pet retailers can significantly boost market reach and brand recognition.

Smart Pet Feeder Company Market Share
Smart Pet Feeder Market Report: A Comprehensive Analysis of a Multi-Million Dollar Industry (2019-2033)
This comprehensive report provides an in-depth analysis of the global smart pet feeder market, projecting a multi-million dollar valuation by 2033. Leveraging data from 2019-2024 (historical period), with 2025 as the base and estimated year, this report forecasts market trends through 2033 (forecast period). Key players like Acer (Pawbo), Radio Systems (PetSafe), SureFlap, Arf Pets, Petodayshop, WOpet, faroro, DOGNESS Group, OWON SmartLife, and Petkit are analyzed, offering invaluable insights for industry stakeholders seeking to capitalize on this burgeoning market.
Smart Pet Feeder Market Dynamics & Concentration
The smart pet feeder market exhibits a moderately concentrated landscape, with key players vying for market share. Innovation is a major driver, with companies continuously introducing features like app connectivity, portion control, and even camera integration. Regulatory frameworks regarding food safety and data privacy are increasingly influential. Product substitutes include traditional feeders, but the convenience and health benefits of smart feeders are driving market penetration. End-user trends show a preference for automated solutions and remote monitoring capabilities. M&A activity has been moderate, with xx major deals recorded between 2019 and 2024, primarily focused on expanding product lines and geographical reach. Market share is currently dominated by xx players, with the top three companies holding approximately xx% of the market in 2024.
- Market Concentration: Moderately concentrated, with xx% market share held by top 3 players in 2024.
- Innovation Drivers: App connectivity, portion control, camera integration, and AI-powered features.
- Regulatory Frameworks: Focus on food safety, data privacy, and product safety standards.
- M&A Activity: xx major deals between 2019 and 2024, driven by expansion strategies.
Smart Pet Feeder Industry Trends & Analysis
The global smart pet feeder market is experiencing significant growth, driven by increasing pet ownership, rising disposable incomes, and technological advancements. The compound annual growth rate (CAGR) is projected to be xx% between 2025 and 2033. Technological disruptions, such as the integration of AI and IoT, are enhancing functionalities and user experience. Consumer preferences are shifting towards smart, connected devices that offer convenience, health benefits (portion control), and remote monitoring capabilities. Intense competition is driving innovation and price optimization. Market penetration is increasing across all segments, with the highest growth observed in the smart phone integrated feeder segment. The market is witnessing a steady shift from basic models towards advanced features.
Leading Markets & Segments in Smart Pet Feeder
North America is currently the leading market for smart pet feeders, followed by Europe and Asia-Pacific. The dominance of North America is attributed to high pet ownership rates, high disposable incomes, and early adoption of technology. Within application segments, the demand for smart pet feeders for dogs is significantly higher than that of cats or other animals. In terms of capacity, the 5L-7L segment holds the largest market share, representing the preferred feeder capacity for most household pets.
- Key Drivers for North America Dominance: High pet ownership, high disposable income, early adoption of technology.
- Application Segment Analysis: Dogs (xx million units in 2024) > Cats (xx million units in 2024) > Other (xx million units in 2024).
- Capacity Segment Analysis: 5L-7L (xx million units in 2024) > More than 7L (xx million units in 2024) > Less than 5L (xx million units in 2024)
Smart Pet Feeder Product Developments
Recent product innovations focus on enhanced connectivity, improved portion control mechanisms, advanced sensors for food level monitoring, and integration with smart home ecosystems. These developments cater to increasing consumer demands for convenience, pet health monitoring, and seamless integration with existing smart home technology. Competitive advantages are established through unique features, superior app functionality, and robust customer support. The market shows a clear trend towards smaller, more aesthetically pleasing designs, integrating with existing home décor.
Key Drivers of Smart Pet Feeder Growth
The growth of the smart pet feeder market is propelled by several key factors:
- Technological Advancements: Integration of AI, IoT, and smartphone connectivity.
- Increasing Pet Ownership: A global trend driving demand for pet care solutions.
- Rising Disposable Incomes: Enabling consumers to invest in premium pet products.
- Improved Convenience and Safety: Automated feeding reduces the risk of overfeeding and ensures consistent pet care, even during absence.
Challenges in the Smart Pet Feeder Market
The market faces challenges such as:
- High Initial Investment Costs: Smart feeders can be significantly more expensive than traditional feeders, limiting accessibility.
- Technical Glitches and App Reliability: Dependence on technology introduces the risk of malfunctions and app issues.
- Concerns about Data Privacy: Collection and storage of user data raise privacy concerns. This could lead to regulatory hurdles and hinder market expansion.
Emerging Opportunities in Smart Pet Feeder
Long-term growth will be driven by:
- Expansion into Emerging Markets: untapped potential in developing economies with rising pet ownership.
- Strategic Partnerships: collaborations with veterinary clinics and pet food brands.
- Integration with broader wellness platforms: incorporating health data monitoring and other pet wellness features.
Leading Players in the Smart Pet Feeder Sector
- Acer (Pawbo)
- Radio Systems (PetSafe)
- SureFlap
- Arf Pets
- Petodayshop
- WOpet
- faroro
- DOGNESS Group
- OWON SmartLife
- Petkit
Key Milestones in Smart Pet Feeder Industry
- 2020: Launch of the first AI-powered smart feeder with facial recognition.
- 2021: Several major players integrate smart feeders with smart home ecosystems (e.g., Alexa, Google Home).
- 2022: Increased focus on pet health monitoring features in smart feeders.
- 2023: Introduction of subscription-based services for smart feeders.
Strategic Outlook for Smart Pet Feeder Market
The smart pet feeder market presents a significant opportunity for growth, driven by technological advancements, changing consumer preferences, and the increasing humanization of pets. Strategic opportunities lie in expanding product functionalities, developing robust data analytics capabilities, and strengthening partnerships to gain wider market reach. Focus on superior user experience and reliable technology will be crucial for long-term success in this competitive market.
Smart Pet Feeder Segmentation
-
1. Application
- 1.1. Dogs
- 1.2. Cats
- 1.3. Other
-
2. Types
- 2.1. Less Than 5L
- 2.2. 5L-7L
- 2.3. More Than 7L
Smart Pet Feeder Segmentation By Geography
-
1. North America
- 1.1. United States
- 1.2. Canada
- 1.3. Mexico
-
2. South America
- 2.1. Brazil
- 2.2. Argentina
- 2.3. Rest of South America
-
3. Europe
- 3.1. United Kingdom
- 3.2. Germany
- 3.3. France
- 3.4. Italy
- 3.5. Spain
- 3.6. Russia
- 3.7. Benelux
- 3.8. Nordics
- 3.9. Rest of Europe
-
4. Middle East & Africa
- 4.1. Turkey
- 4.2. Israel
- 4.3. GCC
- 4.4. North Africa
- 4.5. South Africa
- 4.6. Rest of Middle East & Africa
-
5. Asia Pacific
- 5.1. China
- 5.2. India
- 5.3. Japan
- 5.4. South Korea
- 5.5. ASEAN
- 5.6. Oceania
- 5.7. Rest of Asia Pacific
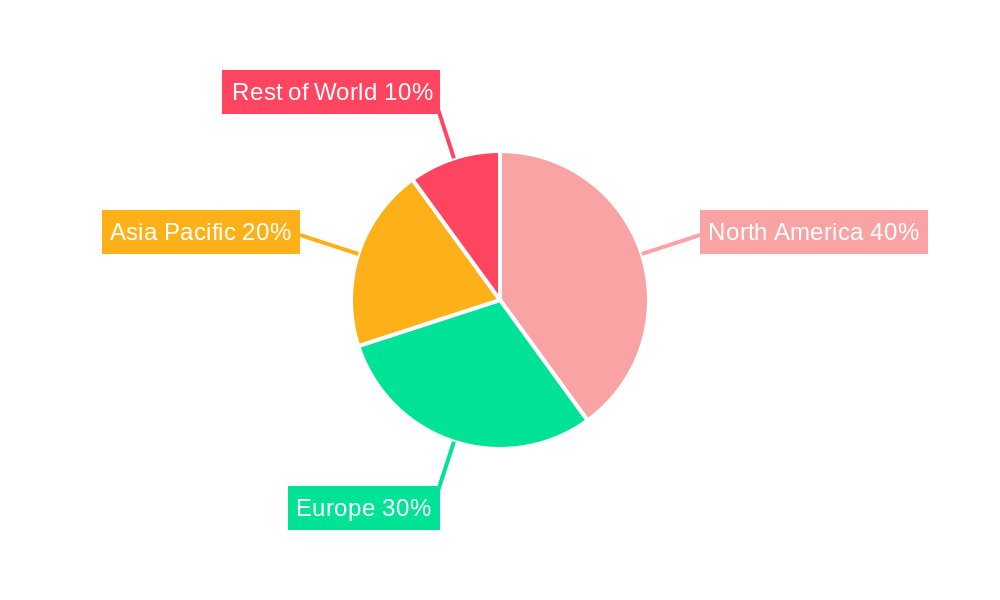
Smart Pet Feeder Regional Market Share
Geographic Coverage of Smart Pet Feeder
Smart Pet Feeder REPORT HIGHLIGHTS
| Aspects | Details |
|---|---|
| Study Period | 2020-2034 |
| Base Year | 2025 |
| Estimated Year | 2026 |
| Forecast Period | 2026-2034 |
| Historical Period | 2020-2025 |
| Growth Rate | CAGR of 7.15% from 2020-2034 |
| Segmentation |
|
Table of Contents
- 1. Introduction
- 1.1. Research Scope
- 1.2. Market Segmentation
- 1.3. Research Methodology
- 1.4. Definitions and Assumptions
- 2. Executive Summary
- 2.1. Introduction
- 3. Market Dynamics
- 3.1. Introduction
- 3.2. Market Drivers
- 3.3. Market Restrains
- 3.4. Market Trends
- 4. Market Factor Analysis
- 4.1. Porters Five Forces
- 4.2. Supply/Value Chain
- 4.3. PESTEL analysis
- 4.4. Market Entropy
- 4.5. Patent/Trademark Analysis
- 5. Global Smart Pet Feeder Analysis, Insights and Forecast, 2020-2032
- 5.1. Market Analysis, Insights and Forecast - by Application
- 5.1.1. Dogs
- 5.1.2. Cats
- 5.1.3. Other
- 5.2. Market Analysis, Insights and Forecast - by Types
- 5.2.1. Less Than 5L
- 5.2.2. 5L-7L
- 5.2.3. More Than 7L
- 5.3. Market Analysis, Insights and Forecast - by Region
- 5.3.1. North America
- 5.3.2. South America
- 5.3.3. Europe
- 5.3.4. Middle East & Africa
- 5.3.5. Asia Pacific
- 5.1. Market Analysis, Insights and Forecast - by Application
- 6. North America Smart Pet Feeder Analysis, Insights and Forecast, 2020-2032
- 6.1. Market Analysis, Insights and Forecast - by Application
- 6.1.1. Dogs
- 6.1.2. Cats
- 6.1.3. Other
- 6.2. Market Analysis, Insights and Forecast - by Types
- 6.2.1. Less Than 5L
- 6.2.2. 5L-7L
- 6.2.3. More Than 7L
- 6.1. Market Analysis, Insights and Forecast - by Application
- 7. South America Smart Pet Feeder Analysis, Insights and Forecast, 2020-2032
- 7.1. Market Analysis, Insights and Forecast - by Application
- 7.1.1. Dogs
- 7.1.2. Cats
- 7.1.3. Other
- 7.2. Market Analysis, Insights and Forecast - by Types
- 7.2.1. Less Than 5L
- 7.2.2. 5L-7L
- 7.2.3. More Than 7L
- 7.1. Market Analysis, Insights and Forecast - by Application
- 8. Europe Smart Pet Feeder Analysis, Insights and Forecast, 2020-2032
- 8.1. Market Analysis, Insights and Forecast - by Application
- 8.1.1. Dogs
- 8.1.2. Cats
- 8.1.3. Other
- 8.2. Market Analysis, Insights and Forecast - by Types
- 8.2.1. Less Than 5L
- 8.2.2. 5L-7L
- 8.2.3. More Than 7L
- 8.1. Market Analysis, Insights and Forecast - by Application
- 9. Middle East & Africa Smart Pet Feeder Analysis, Insights and Forecast, 2020-2032
- 9.1. Market Analysis, Insights and Forecast - by Application
- 9.1.1. Dogs
- 9.1.2. Cats
- 9.1.3. Other
- 9.2. Market Analysis, Insights and Forecast - by Types
- 9.2.1. Less Than 5L
- 9.2.2. 5L-7L
- 9.2.3. More Than 7L
- 9.1. Market Analysis, Insights and Forecast - by Application
- 10. Asia Pacific Smart Pet Feeder Analysis, Insights and Forecast, 2020-2032
- 10.1. Market Analysis, Insights and Forecast - by Application
- 10.1.1. Dogs
- 10.1.2. Cats
- 10.1.3. Other
- 10.2. Market Analysis, Insights and Forecast - by Types
- 10.2.1. Less Than 5L
- 10.2.2. 5L-7L
- 10.2.3. More Than 7L
- 10.1. Market Analysis, Insights and Forecast - by Application
- 11. Competitive Analysis
- 11.1. Global Market Share Analysis 2025
- 11.2. Company Profiles
- 11.2.1 Acer(Pawbo)
- 11.2.1.1. Overview
- 11.2.1.2. Products
- 11.2.1.3. SWOT Analysis
- 11.2.1.4. Recent Developments
- 11.2.1.5. Financials (Based on Availability)
- 11.2.2 Radio Systems(Petsafe)
- 11.2.2.1. Overview
- 11.2.2.2. Products
- 11.2.2.3. SWOT Analysis
- 11.2.2.4. Recent Developments
- 11.2.2.5. Financials (Based on Availability)
- 11.2.3 SureFlap
- 11.2.3.1. Overview
- 11.2.3.2. Products
- 11.2.3.3. SWOT Analysis
- 11.2.3.4. Recent Developments
- 11.2.3.5. Financials (Based on Availability)
- 11.2.4 Arf Pets
- 11.2.4.1. Overview
- 11.2.4.2. Products
- 11.2.4.3. SWOT Analysis
- 11.2.4.4. Recent Developments
- 11.2.4.5. Financials (Based on Availability)
- 11.2.5 Petodayshop
- 11.2.5.1. Overview
- 11.2.5.2. Products
- 11.2.5.3. SWOT Analysis
- 11.2.5.4. Recent Developments
- 11.2.5.5. Financials (Based on Availability)
- 11.2.6 WOpet
- 11.2.6.1. Overview
- 11.2.6.2. Products
- 11.2.6.3. SWOT Analysis
- 11.2.6.4. Recent Developments
- 11.2.6.5. Financials (Based on Availability)
- 11.2.7 faroro
- 11.2.7.1. Overview
- 11.2.7.2. Products
- 11.2.7.3. SWOT Analysis
- 11.2.7.4. Recent Developments
- 11.2.7.5. Financials (Based on Availability)
- 11.2.8 DOGNESS Group
- 11.2.8.1. Overview
- 11.2.8.2. Products
- 11.2.8.3. SWOT Analysis
- 11.2.8.4. Recent Developments
- 11.2.8.5. Financials (Based on Availability)
- 11.2.9 OWON SmartLife
- 11.2.9.1. Overview
- 11.2.9.2. Products
- 11.2.9.3. SWOT Analysis
- 11.2.9.4. Recent Developments
- 11.2.9.5. Financials (Based on Availability)
- 11.2.10 Petkit
- 11.2.10.1. Overview
- 11.2.10.2. Products
- 11.2.10.3. SWOT Analysis
- 11.2.10.4. Recent Developments
- 11.2.10.5. Financials (Based on Availability)
- 11.2.1 Acer(Pawbo)
List of Figures
- Figure 1: Global Smart Pet Feeder Revenue Breakdown (billion, %) by Region 2025 & 2033
- Figure 2: Global Smart Pet Feeder Volume Breakdown (K, %) by Region 2025 & 2033
- Figure 3: North America Smart Pet Feeder Revenue (billion), by Application 2025 & 2033
- Figure 4: North America Smart Pet Feeder Volume (K), by Application 2025 & 2033
- Figure 5: North America Smart Pet Feeder Revenue Share (%), by Application 2025 & 2033
- Figure 6: North America Smart Pet Feeder Volume Share (%), by Application 2025 & 2033
- Figure 7: North America Smart Pet Feeder Revenue (billion), by Types 2025 & 2033
- Figure 8: North America Smart Pet Feeder Volume (K), by Types 2025 & 2033
- Figure 9: North America Smart Pet Feeder Revenue Share (%), by Types 2025 & 2033
- Figure 10: North America Smart Pet Feeder Volume Share (%), by Types 2025 & 2033
- Figure 11: North America Smart Pet Feeder Revenue (billion), by Country 2025 & 2033
- Figure 12: North America Smart Pet Feeder Volume (K), by Country 2025 & 2033
- Figure 13: North America Smart Pet Feeder Revenue Share (%), by Country 2025 & 2033
- Figure 14: North America Smart Pet Feeder Volume Share (%), by Country 2025 & 2033
- Figure 15: South America Smart Pet Feeder Revenue (billion), by Application 2025 & 2033
- Figure 16: South America Smart Pet Feeder Volume (K), by Application 2025 & 2033
- Figure 17: South America Smart Pet Feeder Revenue Share (%), by Application 2025 & 2033
- Figure 18: South America Smart Pet Feeder Volume Share (%), by Application 2025 & 2033
- Figure 19: South America Smart Pet Feeder Revenue (billion), by Types 2025 & 2033
- Figure 20: South America Smart Pet Feeder Volume (K), by Types 2025 & 2033
- Figure 21: South America Smart Pet Feeder Revenue Share (%), by Types 2025 & 2033
- Figure 22: South America Smart Pet Feeder Volume Share (%), by Types 2025 & 2033
- Figure 23: South America Smart Pet Feeder Revenue (billion), by Country 2025 & 2033
- Figure 24: South America Smart Pet Feeder Volume (K), by Country 2025 & 2033
- Figure 25: South America Smart Pet Feeder Revenue Share (%), by Country 2025 & 2033
- Figure 26: South America Smart Pet Feeder Volume Share (%), by Country 2025 & 2033
- Figure 27: Europe Smart Pet Feeder Revenue (billion), by Application 2025 & 2033
- Figure 28: Europe Smart Pet Feeder Volume (K), by Application 2025 & 2033
- Figure 29: Europe Smart Pet Feeder Revenue Share (%), by Application 2025 & 2033
- Figure 30: Europe Smart Pet Feeder Volume Share (%), by Application 2025 & 2033
- Figure 31: Europe Smart Pet Feeder Revenue (billion), by Types 2025 & 2033
- Figure 32: Europe Smart Pet Feeder Volume (K), by Types 2025 & 2033
- Figure 33: Europe Smart Pet Feeder Revenue Share (%), by Types 2025 & 2033
- Figure 34: Europe Smart Pet Feeder Volume Share (%), by Types 2025 & 2033
- Figure 35: Europe Smart Pet Feeder Revenue (billion), by Country 2025 & 2033
- Figure 36: Europe Smart Pet Feeder Volume (K), by Country 2025 & 2033
- Figure 37: Europe Smart Pet Feeder Revenue Share (%), by Country 2025 & 2033
- Figure 38: Europe Smart Pet Feeder Volume Share (%), by Country 2025 & 2033
- Figure 39: Middle East & Africa Smart Pet Feeder Revenue (billion), by Application 2025 & 2033
- Figure 40: Middle East & Africa Smart Pet Feeder Volume (K), by Application 2025 & 2033
- Figure 41: Middle East & Africa Smart Pet Feeder Revenue Share (%), by Application 2025 & 2033
- Figure 42: Middle East & Africa Smart Pet Feeder Volume Share (%), by Application 2025 & 2033
- Figure 43: Middle East & Africa Smart Pet Feeder Revenue (billion), by Types 2025 & 2033
- Figure 44: Middle East & Africa Smart Pet Feeder Volume (K), by Types 2025 & 2033
- Figure 45: Middle East & Africa Smart Pet Feeder Revenue Share (%), by Types 2025 & 2033
- Figure 46: Middle East & Africa Smart Pet Feeder Volume Share (%), by Types 2025 & 2033
- Figure 47: Middle East & Africa Smart Pet Feeder Revenue (billion), by Country 2025 & 2033
- Figure 48: Middle East & Africa Smart Pet Feeder Volume (K), by Country 2025 & 2033
- Figure 49: Middle East & Africa Smart Pet Feeder Revenue Share (%), by Country 2025 & 2033
- Figure 50: Middle East & Africa Smart Pet Feeder Volume Share (%), by Country 2025 & 2033
- Figure 51: Asia Pacific Smart Pet Feeder Revenue (billion), by Application 2025 & 2033
- Figure 52: Asia Pacific Smart Pet Feeder Volume (K), by Application 2025 & 2033
- Figure 53: Asia Pacific Smart Pet Feeder Revenue Share (%), by Application 2025 & 2033
- Figure 54: Asia Pacific Smart Pet Feeder Volume Share (%), by Application 2025 & 2033
- Figure 55: Asia Pacific Smart Pet Feeder Revenue (billion), by Types 2025 & 2033
- Figure 56: Asia Pacific Smart Pet Feeder Volume (K), by Types 2025 & 2033
- Figure 57: Asia Pacific Smart Pet Feeder Revenue Share (%), by Types 2025 & 2033
- Figure 58: Asia Pacific Smart Pet Feeder Volume Share (%), by Types 2025 & 2033
- Figure 59: Asia Pacific Smart Pet Feeder Revenue (billion), by Country 2025 & 2033
- Figure 60: Asia Pacific Smart Pet Feeder Volume (K), by Country 2025 & 2033
- Figure 61: Asia Pacific Smart Pet Feeder Revenue Share (%), by Country 2025 & 2033
- Figure 62: Asia Pacific Smart Pet Feeder Volume Share (%), by Country 2025 & 2033
List of Tables
- Table 1: Global Smart Pet Feeder Revenue billion Forecast, by Application 2020 & 2033
- Table 2: Global Smart Pet Feeder Volume K Forecast, by Application 2020 & 2033
- Table 3: Global Smart Pet Feeder Revenue billion Forecast, by Types 2020 & 2033
- Table 4: Global Smart Pet Feeder Volume K Forecast, by Types 2020 & 2033
- Table 5: Global Smart Pet Feeder Revenue billion Forecast, by Region 2020 & 2033
- Table 6: Global Smart Pet Feeder Volume K Forecast, by Region 2020 & 2033
- Table 7: Global Smart Pet Feeder Revenue billion Forecast, by Application 2020 & 2033
- Table 8: Global Smart Pet Feeder Volume K Forecast, by Application 2020 & 2033
- Table 9: Global Smart Pet Feeder Revenue billion Forecast, by Types 2020 & 2033
- Table 10: Global Smart Pet Feeder Volume K Forecast, by Types 2020 & 2033
- Table 11: Global Smart Pet Feeder Revenue billion Forecast, by Country 2020 & 2033
- Table 12: Global Smart Pet Feeder Volume K Forecast, by Country 2020 & 2033
- Table 13: United States Smart Pet Feeder Revenue (billion) Forecast, by Application 2020 & 2033
- Table 14: United States Smart Pet Feeder Volume (K) Forecast, by Application 2020 & 2033
- Table 15: Canada Smart Pet Feeder Revenue (billion) Forecast, by Application 2020 & 2033
- Table 16: Canada Smart Pet Feeder Volume (K) Forecast, by Application 2020 & 2033
- Table 17: Mexico Smart Pet Feeder Revenue (billion) Forecast, by Application 2020 & 2033
- Table 18: Mexico Smart Pet Feeder Volume (K) Forecast, by Application 2020 & 2033
- Table 19: Global Smart Pet Feeder Revenue billion Forecast, by Application 2020 & 2033
- Table 20: Global Smart Pet Feeder Volume K Forecast, by Application 2020 & 2033
- Table 21: Global Smart Pet Feeder Revenue billion Forecast, by Types 2020 & 2033
- Table 22: Global Smart Pet Feeder Volume K Forecast, by Types 2020 & 2033
- Table 23: Global Smart Pet Feeder Revenue billion Forecast, by Country 2020 & 2033
- Table 24: Global Smart Pet Feeder Volume K Forecast, by Country 2020 & 2033
- Table 25: Brazil Smart Pet Feeder Revenue (billion) Forecast, by Application 2020 & 2033
- Table 26: Brazil Smart Pet Feeder Volume (K) Forecast, by Application 2020 & 2033
- Table 27: Argentina Smart Pet Feeder Revenue (billion) Forecast, by Application 2020 & 2033
- Table 28: Argentina Smart Pet Feeder Volume (K) Forecast, by Application 2020 & 2033
- Table 29: Rest of South America Smart Pet Feeder Revenue (billion) Forecast, by Application 2020 & 2033
- Table 30: Rest of South America Smart Pet Feeder Volume (K) Forecast, by Application 2020 & 2033
- Table 31: Global Smart Pet Feeder Revenue billion Forecast, by Application 2020 & 2033
- Table 32: Global Smart Pet Feeder Volume K Forecast, by Application 2020 & 2033
- Table 33: Global Smart Pet Feeder Revenue billion Forecast, by Types 2020 & 2033
- Table 34: Global Smart Pet Feeder Volume K Forecast, by Types 2020 & 2033
- Table 35: Global Smart Pet Feeder Revenue billion Forecast, by Country 2020 & 2033
- Table 36: Global Smart Pet Feeder Volume K Forecast, by Country 2020 & 2033
- Table 37: United Kingdom Smart Pet Feeder Revenue (billion) Forecast, by Application 2020 & 2033
- Table 38: United Kingdom Smart Pet Feeder Volume (K) Forecast, by Application 2020 & 2033
- Table 39: Germany Smart Pet Feeder Revenue (billion) Forecast, by Application 2020 & 2033
- Table 40: Germany Smart Pet Feeder Volume (K) Forecast, by Application 2020 & 2033
- Table 41: France Smart Pet Feeder Revenue (billion) Forecast, by Application 2020 & 2033
- Table 42: France Smart Pet Feeder Volume (K) Forecast, by Application 2020 & 2033
- Table 43: Italy Smart Pet Feeder Revenue (billion) Forecast, by Application 2020 & 2033
- Table 44: Italy Smart Pet Feeder Volume (K) Forecast, by Application 2020 & 2033
- Table 45: Spain Smart Pet Feeder Revenue (billion) Forecast, by Application 2020 & 2033
- Table 46: Spain Smart Pet Feeder Volume (K) Forecast, by Application 2020 & 2033
- Table 47: Russia Smart Pet Feeder Revenue (billion) Forecast, by Application 2020 & 2033
- Table 48: Russia Smart Pet Feeder Volume (K) Forecast, by Application 2020 & 2033
- Table 49: Benelux Smart Pet Feeder Revenue (billion) Forecast, by Application 2020 & 2033
- Table 50: Benelux Smart Pet Feeder Volume (K) Forecast, by Application 2020 & 2033
- Table 51: Nordics Smart Pet Feeder Revenue (billion) Forecast, by Application 2020 & 2033
- Table 52: Nordics Smart Pet Feeder Volume (K) Forecast, by Application 2020 & 2033
- Table 53: Rest of Europe Smart Pet Feeder Revenue (billion) Forecast, by Application 2020 & 2033
- Table 54: Rest of Europe Smart Pet Feeder Volume (K) Forecast, by Application 2020 & 2033
- Table 55: Global Smart Pet Feeder Revenue billion Forecast, by Application 2020 & 2033
- Table 56: Global Smart Pet Feeder Volume K Forecast, by Application 2020 & 2033
- Table 57: Global Smart Pet Feeder Revenue billion Forecast, by Types 2020 & 2033
- Table 58: Global Smart Pet Feeder Volume K Forecast, by Types 2020 & 2033
- Table 59: Global Smart Pet Feeder Revenue billion Forecast, by Country 2020 & 2033
- Table 60: Global Smart Pet Feeder Volume K Forecast, by Country 2020 & 2033
- Table 61: Turkey Smart Pet Feeder Revenue (billion) Forecast, by Application 2020 & 2033
- Table 62: Turkey Smart Pet Feeder Volume (K) Forecast, by Application 2020 & 2033
- Table 63: Israel Smart Pet Feeder Revenue (billion) Forecast, by Application 2020 & 2033
- Table 64: Israel Smart Pet Feeder Volume (K) Forecast, by Application 2020 & 2033
- Table 65: GCC Smart Pet Feeder Revenue (billion) Forecast, by Application 2020 & 2033
- Table 66: GCC Smart Pet Feeder Volume (K) Forecast, by Application 2020 & 2033
- Table 67: North Africa Smart Pet Feeder Revenue (billion) Forecast, by Application 2020 & 2033
- Table 68: North Africa Smart Pet Feeder Volume (K) Forecast, by Application 2020 & 2033
- Table 69: South Africa Smart Pet Feeder Revenue (billion) Forecast, by Application 2020 & 2033
- Table 70: South Africa Smart Pet Feeder Volume (K) Forecast, by Application 2020 & 2033
- Table 71: Rest of Middle East & Africa Smart Pet Feeder Revenue (billion) Forecast, by Application 2020 & 2033
- Table 72: Rest of Middle East & Africa Smart Pet Feeder Volume (K) Forecast, by Application 2020 & 2033
- Table 73: Global Smart Pet Feeder Revenue billion Forecast, by Application 2020 & 2033
- Table 74: Global Smart Pet Feeder Volume K Forecast, by Application 2020 & 2033
- Table 75: Global Smart Pet Feeder Revenue billion Forecast, by Types 2020 & 2033
- Table 76: Global Smart Pet Feeder Volume K Forecast, by Types 2020 & 2033
- Table 77: Global Smart Pet Feeder Revenue billion Forecast, by Country 2020 & 2033
- Table 78: Global Smart Pet Feeder Volume K Forecast, by Country 2020 & 2033
- Table 79: China Smart Pet Feeder Revenue (billion) Forecast, by Application 2020 & 2033
- Table 80: China Smart Pet Feeder Volume (K) Forecast, by Application 2020 & 2033
- Table 81: India Smart Pet Feeder Revenue (billion) Forecast, by Application 2020 & 2033
- Table 82: India Smart Pet Feeder Volume (K) Forecast, by Application 2020 & 2033
- Table 83: Japan Smart Pet Feeder Revenue (billion) Forecast, by Application 2020 & 2033
- Table 84: Japan Smart Pet Feeder Volume (K) Forecast, by Application 2020 & 2033
- Table 85: South Korea Smart Pet Feeder Revenue (billion) Forecast, by Application 2020 & 2033
- Table 86: South Korea Smart Pet Feeder Volume (K) Forecast, by Application 2020 & 2033
- Table 87: ASEAN Smart Pet Feeder Revenue (billion) Forecast, by Application 2020 & 2033
- Table 88: ASEAN Smart Pet Feeder Volume (K) Forecast, by Application 2020 & 2033
- Table 89: Oceania Smart Pet Feeder Revenue (billion) Forecast, by Application 2020 & 2033
- Table 90: Oceania Smart Pet Feeder Volume (K) Forecast, by Application 2020 & 2033
- Table 91: Rest of Asia Pacific Smart Pet Feeder Revenue (billion) Forecast, by Application 2020 & 2033
- Table 92: Rest of Asia Pacific Smart Pet Feeder Volume (K) Forecast, by Application 2020 & 2033
Frequently Asked Questions
1. What is the projected Compound Annual Growth Rate (CAGR) of the Smart Pet Feeder?
The projected CAGR is approximately 7.15%.
2. Which companies are prominent players in the Smart Pet Feeder?
Key companies in the market include Acer(Pawbo), Radio Systems(Petsafe), SureFlap, Arf Pets, Petodayshop, WOpet, faroro, DOGNESS Group, OWON SmartLife, Petkit.
3. What are the main segments of the Smart Pet Feeder?
The market segments include Application, Types.
4. Can you provide details about the market size?
The market size is estimated to be USD 8.1 billion as of 2022.
5. What are some drivers contributing to market growth?
N/A
6. What are the notable trends driving market growth?
N/A
7. Are there any restraints impacting market growth?
N/A
8. Can you provide examples of recent developments in the market?
N/A
9. What pricing options are available for accessing the report?
Pricing options include single-user, multi-user, and enterprise licenses priced at USD 3950.00, USD 5925.00, and USD 7900.00 respectively.
10. Is the market size provided in terms of value or volume?
The market size is provided in terms of value, measured in billion and volume, measured in K.
11. Are there any specific market keywords associated with the report?
Yes, the market keyword associated with the report is "Smart Pet Feeder," which aids in identifying and referencing the specific market segment covered.
12. How do I determine which pricing option suits my needs best?
The pricing options vary based on user requirements and access needs. Individual users may opt for single-user licenses, while businesses requiring broader access may choose multi-user or enterprise licenses for cost-effective access to the report.
13. Are there any additional resources or data provided in the Smart Pet Feeder report?
While the report offers comprehensive insights, it's advisable to review the specific contents or supplementary materials provided to ascertain if additional resources or data are available.
14. How can I stay updated on further developments or reports in the Smart Pet Feeder?
To stay informed about further developments, trends, and reports in the Smart Pet Feeder, consider subscribing to industry newsletters, following relevant companies and organizations, or regularly checking reputable industry news sources and publications.
Methodology
Step 1 - Identification of Relevant Samples Size from Population Database


Step 2 - Approaches for Defining Global Market Size (Value, Volume* & Price*)

Note*: In applicable scenarios
Step 3 - Data Sources
Primary Research
- Web Analytics
- Survey Reports
- Research Institute
- Latest Research Reports
- Opinion Leaders
Secondary Research
- Annual Reports
- White Paper
- Latest Press Release
- Industry Association
- Paid Database
- Investor Presentations

Step 4 - Data Triangulation
Involves using different sources of information in order to increase the validity of a study
These sources are likely to be stakeholders in a program - participants, other researchers, program staff, other community members, and so on.
Then we put all data in single framework & apply various statistical tools to find out the dynamic on the market.
During the analysis stage, feedback from the stakeholder groups would be compared to determine areas of agreement as well as areas of divergence