

Key Insights
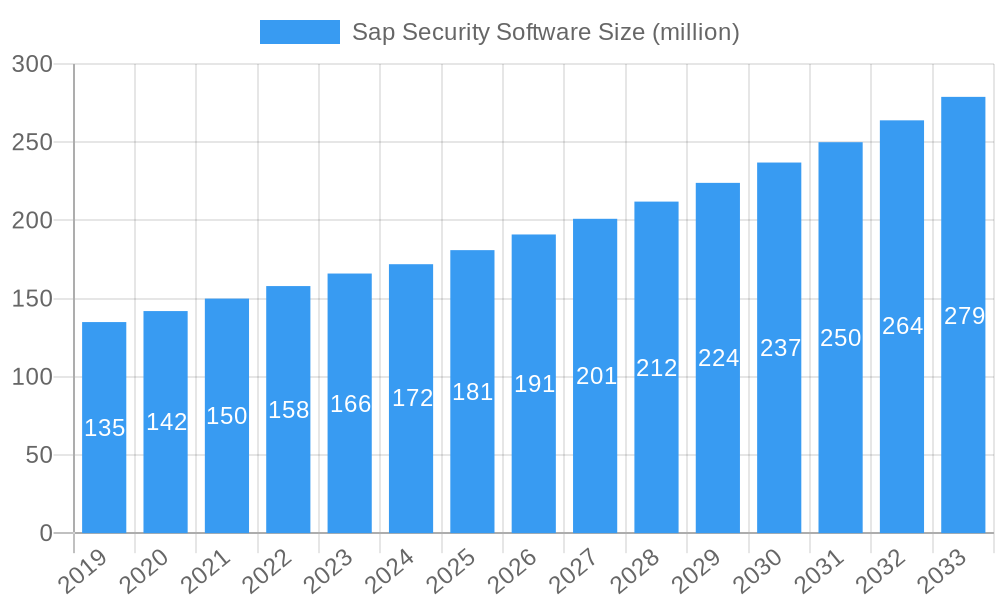
The SAP Security Software market is poised for robust growth, projected to reach $172 million by 2025, driven by an anticipated Compound Annual Growth Rate (CAGR) of 5.3% from 2019-2033. This expansion is fueled by the increasing complexity of SAP landscapes, the escalating threat of cyberattacks targeting enterprise resource planning (ERP) systems, and the growing regulatory compliance demands faced by organizations worldwide. Large enterprises, in particular, are significant adopters of SAP security solutions due to the critical nature of their SAP environments and the substantial financial and reputational risks associated with security breaches. SMEs are also increasingly recognizing the importance of robust SAP security, leading to a growing demand for more accessible and cost-effective solutions. Cloud-based security solutions are gaining traction as businesses migrate their SAP instances to the cloud, offering scalability, flexibility, and advanced threat detection capabilities.
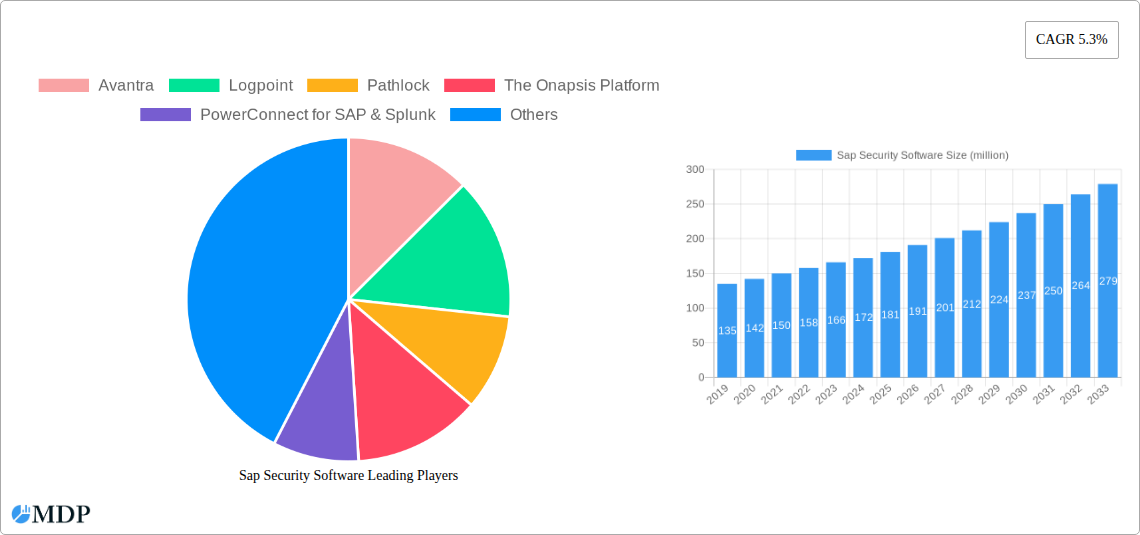
Sap Security Software Market Size (In Million)
The market is characterized by key trends such as the rising adoption of AI and machine learning for predictive threat intelligence and automated incident response, enhancing the efficacy of SAP security software. Integration with broader cybersecurity platforms and a focus on continuous monitoring and vulnerability management are also crucial. However, the market faces restraints including the high cost of implementation and maintenance for some advanced solutions, a shortage of skilled cybersecurity professionals specializing in SAP, and the inherent complexity of securing deeply integrated SAP systems. Companies like Avantra, Logpoint, Pathlock, The Onapsis Platform, and SAP Enterprise Threat Detection are at the forefront, offering innovative solutions to address these challenges. Geographically, North America and Europe are leading markets due to their mature economies and strong emphasis on cybersecurity. The Asia Pacific region is expected to witness significant growth due to rapid digitalization and increasing SAP adoption.
Sap Security Software Company Market Share
Unlocking SAP Security: A Comprehensive Market Report
Gain deep insights into the rapidly evolving SAP security software landscape. This in-depth report analyzes market dynamics, key trends, leading players, and future opportunities within the SAP security ecosystem. Essential for CSOs, IT Security Managers, procurement teams, and strategic investors seeking to navigate and capitalize on this critical market. Forecasts extend to 2033, providing unparalleled foresight.
Sap Security Software Market Dynamics & Concentration
The SAP security software market is characterized by a moderate to high level of concentration, driven by the increasing complexity of SAP environments and the escalating sophistication of cyber threats. Major players are investing heavily in research and development to offer comprehensive solutions that address critical vulnerabilities, compliance requirements, and operational risks. Innovation is a primary driver, with a constant push towards leveraging AI and machine learning for predictive threat detection and automated response. Regulatory frameworks, such as GDPR, SOX, and industry-specific mandates, are significantly shaping market demand, compelling organizations to invest in robust security measures. Product substitutes, while present in niche areas, are largely insufficient to replace the specialized nature of SAP security solutions. End-user trends show a strong preference for integrated security platforms that offer end-to-end visibility and control across SAP applications, both cloud-based and on-premise. Merger and acquisition (M&A) activities are on the rise, with an estimated XX M&A deals expected in the forecast period, as larger entities seek to consolidate market share and acquire innovative technologies. Companies like Avantra, Logpoint, Pathlock, The Onapsis Platform, PowerConnect for SAP & Splunk, Bowbridge, Layer Seven, Microsoft, SAP Enterprise Threat Detection, SecurityBridge, Security Hub, and XM Cyber are actively participating in this dynamic landscape. Market share is fluid, with leading vendors holding substantial portions, but continuous innovation is enabling new entrants to gain traction, especially in specialized areas.
Sap Security Software Industry Trends & Analysis
The SAP security software industry is poised for substantial growth, projected to experience a Compound Annual Growth Rate (CAGR) of approximately XX% during the forecast period of 2025–2033. This robust expansion is fueled by several interconnected market growth drivers. Firstly, the increasing adoption of cloud-based SAP solutions, such as SAP S/4HANA Cloud, necessitates advanced cloud security postures and compliance management, driving demand for specialized cloud security tools. Secondly, the escalating number of sophisticated cyberattacks targeting SAP systems, including ransomware, data breaches, and business logic exploits, is forcing organizations to prioritize comprehensive security strategies. The estimated XX million attack attempts on SAP systems annually underscore this critical need. Technological disruptions are a constant feature, with the integration of AI and machine learning becoming standard for proactive threat detection, anomaly identification, and automated incident response. This shift from reactive to proactive security is a key trend. Consumer preferences are increasingly leaning towards unified security platforms that offer seamless integration with existing IT infrastructure and provide a single pane of glass for managing SAP security risks. The competitive dynamics within the industry are intensifying, with established players like Microsoft and SAP Enterprise Threat Detection facing increasing competition from agile innovators such as SecurityBridge and XM Cyber. Market penetration for advanced SAP security solutions is expected to rise from XX% in the base year of 2025 to an estimated XX% by 2033. The sheer volume of sensitive business data managed within SAP systems, valued in the trillions of dollars, makes securing these environments paramount. Furthermore, the growing trend of digital transformation, where businesses are heavily reliant on SAP for core operations, amplifies the security imperative. The historical period (2019–2024) has laid the groundwork for this accelerated growth, marked by increasing awareness of SAP-specific vulnerabilities and the initial adoption of specialized security tools.
Leading Markets & Segments in Sap Security Software
The Large Enterprise segment is currently the dominant market and is projected to maintain its leadership throughout the forecast period, driven by the complexity and criticality of their SAP deployments. These organizations manage vast amounts of sensitive data, have extensive SAP footprints, and face higher regulatory scrutiny, making robust SAP security software a non-negotiable investment. The estimated market size for SAP security software in Large Enterprises is expected to reach XX million by 2033.
- Key Drivers for Large Enterprise Dominance:
- Complex SAP Landscapes: Large enterprises often run multiple SAP modules and custom applications, creating intricate attack surfaces that require sophisticated security solutions.
- Strict Regulatory Compliance: Mandates like SOX, GDPR, and industry-specific regulations necessitate stringent access controls, audit trails, and data protection measures.
- High Business Impact of Breaches: A security incident within a large enterprise can result in catastrophic financial losses, reputational damage, and operational paralysis.
- Budgetary Allocation for Security: Larger organizations typically have dedicated budgets for cybersecurity, enabling them to invest in premium SAP security solutions.
Within the Type segment, Cloud-based SAP security software is experiencing the fastest growth and is expected to significantly outpace on-premise solutions by 2033. This is directly correlated with the widespread migration of SAP workloads to cloud environments, including public, private, and hybrid clouds. The estimated market share for cloud-based SAP security is projected to reach XX% by the end of the forecast period.
- Key Drivers for Cloud-based Dominance:
- Scalability and Flexibility: Cloud solutions offer inherent scalability and flexibility, allowing organizations to adapt their security needs as their cloud SAP environments evolve.
- Reduced Infrastructure Overhead: Organizations can offload the burden of managing and maintaining security infrastructure to cloud providers, focusing on strategic security management.
- Enhanced Accessibility and Collaboration: Cloud-based security tools facilitate easier access and collaboration for distributed security teams.
- Integration with Cloud Ecosystems: Seamless integration with other cloud security services and platforms enhances overall security posture.
While the SMEs segment is growing, its market share is expected to remain smaller compared to large enterprises due to budgetary constraints and less complex SAP deployments. However, the increasing availability of SaaS-based, more affordable SAP security solutions is driving adoption within this segment.
The On-premise segment, while still significant, is seeing a gradual shift towards cloud-native solutions as organizations modernize their SAP infrastructure. However, many legacy SAP systems will continue to operate on-premise for the foreseeable future, maintaining a steady demand for on-premise security software.
Sap Security Software Product Developments
The SAP security software market is witnessing a surge in product innovations driven by the need to address evolving threats and complex SAP environments. Key developments include the integration of Artificial Intelligence (AI) and Machine Learning (ML) for advanced threat detection, anomaly analysis, and proactive vulnerability management. Solutions are increasingly offering automated remediation capabilities, reducing the time to respond to security incidents. Furthermore, there's a growing emphasis on comprehensive identity and access management (IAM) solutions specifically tailored for SAP, ensuring least privilege access and continuous monitoring of user activities. Competitive advantages are being gained through enhanced reporting and compliance features, simplifying the process for organizations to meet stringent regulatory requirements. The market is also seeing a trend towards more integrated platforms, such as The Onapsis Platform and SecurityBridge, offering a unified approach to SAP security, rather than disparate point solutions.
Key Drivers of Sap Security Software Growth
The growth of the SAP security software market is propelled by a confluence of critical factors. The escalating sophistication and frequency of cyberattacks targeting SAP systems are paramount, with threat actors increasingly recognizing SAP as a high-value target due to the sensitive financial and operational data it houses. Regulatory compliance remains a significant catalyst, with global mandates like GDPR and SOX compelling organizations to invest in robust security measures to avoid substantial penalties. Technological advancements, particularly in AI and machine learning, are enabling more effective and proactive threat detection and response mechanisms. The widespread adoption of SAP cloud solutions (e.g., SAP S/4HANA Cloud) necessitates specialized cloud security solutions, further driving market expansion. The inherent complexity of SAP environments, with their intricate configurations and custom developments, creates a persistent demand for specialized security expertise and tools.
Challenges in the Sap Security Software Market
Despite robust growth prospects, the SAP security software market faces several notable challenges. The sheer complexity and often bespoke nature of SAP implementations make it difficult for security solutions to offer universal compatibility and efficacy, leading to integration challenges. A significant shortage of skilled SAP security professionals further exacerbates the problem, hindering effective deployment and management of security tools. The high cost associated with comprehensive SAP security solutions can be a barrier for Small and Medium-sized Enterprises (SMEs), limiting their ability to adopt advanced protective measures. Additionally, the rapidly evolving threat landscape requires continuous updates and adaptation of security software, posing an ongoing challenge for vendors to stay ahead of emerging threats. The estimated cost of a significant SAP security breach for a large enterprise can run into tens of millions of dollars, highlighting the financial implications of these challenges.
Emerging Opportunities in Sap Security Software
The SAP security software market is ripe with emerging opportunities. The increasing adoption of SAP S/4HANA across industries presents a significant opportunity for vendors offering migration and security services tailored to this new platform. The growing trend of hybrid cloud deployments for SAP environments creates a demand for integrated security solutions that can seamlessly bridge on-premise and cloud security postures. Furthermore, the rise of Industrial Internet of Things (IIoT) and the integration of SAP with operational technology (OT) systems open up new avenues for specialized security solutions addressing the unique vulnerabilities of these converging environments. Strategic partnerships between SAP security vendors and cloud providers, as well as with managed security service providers (MSSPs), are poised to expand market reach and enhance customer value.
Leading Players in the Sap Security Software Sector
- Avantra
- Logpoint
- Pathlock
- The Onapsis Platform
- PowerConnect for SAP & Splunk
- Bowbridge
- Layer Seven
- Microsoft
- SAP Enterprise Threat Detection
- SecurityBridge
- Security Hub
- XM Cyber
Key Milestones in Sap Security Software Industry
- 2019: Increased focus on SAP security vulnerabilities due to high-profile data breaches.
- 2020: Launch of advanced cloud-native SAP security solutions.
- 2021: Significant uptick in M&A activity as larger cybersecurity firms acquire specialized SAP security vendors.
- 2022: Growing adoption of AI and ML in SAP threat detection platforms.
- 2023: Enhanced regulatory pressure driving demand for compliance-focused SAP security tools.
- 2024: Broader market awareness of SAP-specific risks and proactive security measures.
- 2025 (Base Year): Estimated market size for SAP security software reaches XX million.
- 2026: Expectation of further consolidation and integration of SAP security solutions.
- 2028: Projected substantial growth in cloud-based SAP security adoption.
- 2030: Maturation of AI-driven security capabilities within SAP ecosystems.
- 2033 (Forecast End): Anticipated market size for SAP security software to reach XX million.
Strategic Outlook for Sap Security Software Market
The strategic outlook for the SAP security software market is exceptionally promising, driven by continuous technological innovation and the undeniable criticality of securing SAP environments. Future growth accelerators will include the deepening integration of AI and ML for predictive threat intelligence and automated incident response, further reducing mean time to detect (MTTD) and mean time to respond (MTTR). The ongoing migration to SAP S/4HANA and cloud-based solutions will necessitate specialized security solutions, creating sustained demand. Strategic partnerships and alliances will play a pivotal role in expanding market reach and offering comprehensive security suites. Organizations will increasingly seek end-to-end visibility and control across their entire SAP landscape, from application to infrastructure, driving demand for integrated platforms. The market is expected to witness a continued trend towards SaaS-based offerings, making advanced security more accessible to a wider range of businesses.
Sap Security Software Segmentation
-
1. Application
- 1.1. Large Enterprised
- 1.2. SMEs
-
2. Type
- 2.1. Cloud-based
- 2.2. On-premise
Sap Security Software Segmentation By Geography
-
1. North America
- 1.1. United States
- 1.2. Canada
- 1.3. Mexico
-
2. South America
- 2.1. Brazil
- 2.2. Argentina
- 2.3. Rest of South America
-
3. Europe
- 3.1. United Kingdom
- 3.2. Germany
- 3.3. France
- 3.4. Italy
- 3.5. Spain
- 3.6. Russia
- 3.7. Benelux
- 3.8. Nordics
- 3.9. Rest of Europe
-
4. Middle East & Africa
- 4.1. Turkey
- 4.2. Israel
- 4.3. GCC
- 4.4. North Africa
- 4.5. South Africa
- 4.6. Rest of Middle East & Africa
-
5. Asia Pacific
- 5.1. China
- 5.2. India
- 5.3. Japan
- 5.4. South Korea
- 5.5. ASEAN
- 5.6. Oceania
- 5.7. Rest of Asia Pacific
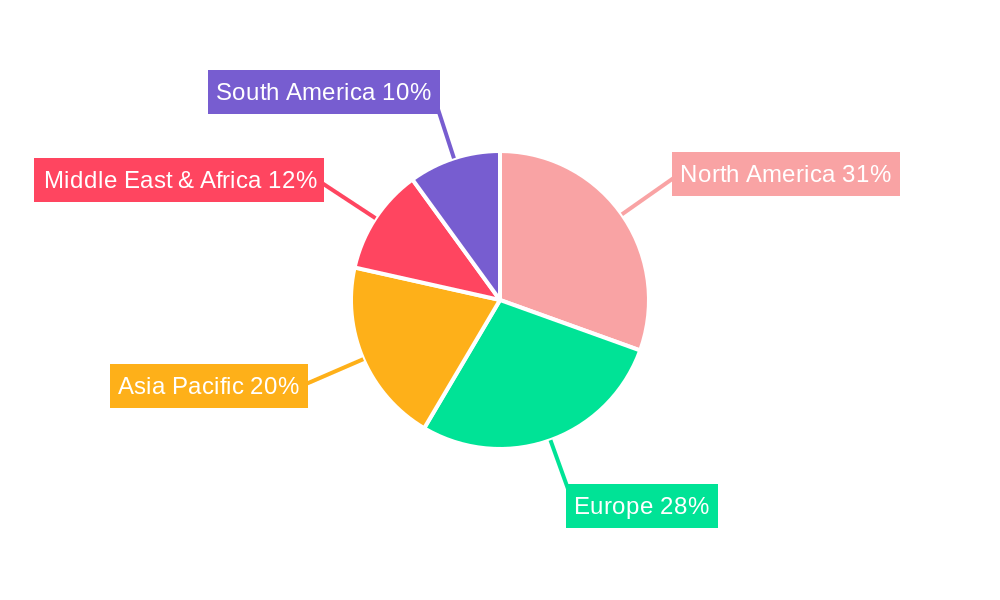
Sap Security Software Regional Market Share
Geographic Coverage of Sap Security Software
Sap Security Software REPORT HIGHLIGHTS
| Aspects | Details |
|---|---|
| Study Period | 2020-2034 |
| Base Year | 2025 |
| Estimated Year | 2026 |
| Forecast Period | 2026-2034 |
| Historical Period | 2020-2025 |
| Growth Rate | CAGR of 5.3% from 2020-2034 |
| Segmentation |
|
Table of Contents
- 1. Introduction
- 1.1. Research Scope
- 1.2. Market Segmentation
- 1.3. Research Methodology
- 1.4. Definitions and Assumptions
- 2. Executive Summary
- 2.1. Introduction
- 3. Market Dynamics
- 3.1. Introduction
- 3.2. Market Drivers
- 3.3. Market Restrains
- 3.4. Market Trends
- 4. Market Factor Analysis
- 4.1. Porters Five Forces
- 4.2. Supply/Value Chain
- 4.3. PESTEL analysis
- 4.4. Market Entropy
- 4.5. Patent/Trademark Analysis
- 5. Global Sap Security Software Analysis, Insights and Forecast, 2020-2032
- 5.1. Market Analysis, Insights and Forecast - by Application
- 5.1.1. Large Enterprised
- 5.1.2. SMEs
- 5.2. Market Analysis, Insights and Forecast - by Type
- 5.2.1. Cloud-based
- 5.2.2. On-premise
- 5.3. Market Analysis, Insights and Forecast - by Region
- 5.3.1. North America
- 5.3.2. South America
- 5.3.3. Europe
- 5.3.4. Middle East & Africa
- 5.3.5. Asia Pacific
- 5.1. Market Analysis, Insights and Forecast - by Application
- 6. North America Sap Security Software Analysis, Insights and Forecast, 2020-2032
- 6.1. Market Analysis, Insights and Forecast - by Application
- 6.1.1. Large Enterprised
- 6.1.2. SMEs
- 6.2. Market Analysis, Insights and Forecast - by Type
- 6.2.1. Cloud-based
- 6.2.2. On-premise
- 6.1. Market Analysis, Insights and Forecast - by Application
- 7. South America Sap Security Software Analysis, Insights and Forecast, 2020-2032
- 7.1. Market Analysis, Insights and Forecast - by Application
- 7.1.1. Large Enterprised
- 7.1.2. SMEs
- 7.2. Market Analysis, Insights and Forecast - by Type
- 7.2.1. Cloud-based
- 7.2.2. On-premise
- 7.1. Market Analysis, Insights and Forecast - by Application
- 8. Europe Sap Security Software Analysis, Insights and Forecast, 2020-2032
- 8.1. Market Analysis, Insights and Forecast - by Application
- 8.1.1. Large Enterprised
- 8.1.2. SMEs
- 8.2. Market Analysis, Insights and Forecast - by Type
- 8.2.1. Cloud-based
- 8.2.2. On-premise
- 8.1. Market Analysis, Insights and Forecast - by Application
- 9. Middle East & Africa Sap Security Software Analysis, Insights and Forecast, 2020-2032
- 9.1. Market Analysis, Insights and Forecast - by Application
- 9.1.1. Large Enterprised
- 9.1.2. SMEs
- 9.2. Market Analysis, Insights and Forecast - by Type
- 9.2.1. Cloud-based
- 9.2.2. On-premise
- 9.1. Market Analysis, Insights and Forecast - by Application
- 10. Asia Pacific Sap Security Software Analysis, Insights and Forecast, 2020-2032
- 10.1. Market Analysis, Insights and Forecast - by Application
- 10.1.1. Large Enterprised
- 10.1.2. SMEs
- 10.2. Market Analysis, Insights and Forecast - by Type
- 10.2.1. Cloud-based
- 10.2.2. On-premise
- 10.1. Market Analysis, Insights and Forecast - by Application
- 11. Competitive Analysis
- 11.1. Global Market Share Analysis 2025
- 11.2. Company Profiles
- 11.2.1 Avantra
- 11.2.1.1. Overview
- 11.2.1.2. Products
- 11.2.1.3. SWOT Analysis
- 11.2.1.4. Recent Developments
- 11.2.1.5. Financials (Based on Availability)
- 11.2.2 Logpoint
- 11.2.2.1. Overview
- 11.2.2.2. Products
- 11.2.2.3. SWOT Analysis
- 11.2.2.4. Recent Developments
- 11.2.2.5. Financials (Based on Availability)
- 11.2.3 Pathlock
- 11.2.3.1. Overview
- 11.2.3.2. Products
- 11.2.3.3. SWOT Analysis
- 11.2.3.4. Recent Developments
- 11.2.3.5. Financials (Based on Availability)
- 11.2.4 The Onapsis Platform
- 11.2.4.1. Overview
- 11.2.4.2. Products
- 11.2.4.3. SWOT Analysis
- 11.2.4.4. Recent Developments
- 11.2.4.5. Financials (Based on Availability)
- 11.2.5 PowerConnect for SAP & Splunk
- 11.2.5.1. Overview
- 11.2.5.2. Products
- 11.2.5.3. SWOT Analysis
- 11.2.5.4. Recent Developments
- 11.2.5.5. Financials (Based on Availability)
- 11.2.6 Bowbridge
- 11.2.6.1. Overview
- 11.2.6.2. Products
- 11.2.6.3. SWOT Analysis
- 11.2.6.4. Recent Developments
- 11.2.6.5. Financials (Based on Availability)
- 11.2.7 Layer Seven
- 11.2.7.1. Overview
- 11.2.7.2. Products
- 11.2.7.3. SWOT Analysis
- 11.2.7.4. Recent Developments
- 11.2.7.5. Financials (Based on Availability)
- 11.2.8 Microsoft
- 11.2.8.1. Overview
- 11.2.8.2. Products
- 11.2.8.3. SWOT Analysis
- 11.2.8.4. Recent Developments
- 11.2.8.5. Financials (Based on Availability)
- 11.2.9 SAP Enterprise Threat Detection
- 11.2.9.1. Overview
- 11.2.9.2. Products
- 11.2.9.3. SWOT Analysis
- 11.2.9.4. Recent Developments
- 11.2.9.5. Financials (Based on Availability)
- 11.2.10 SecurityBridge
- 11.2.10.1. Overview
- 11.2.10.2. Products
- 11.2.10.3. SWOT Analysis
- 11.2.10.4. Recent Developments
- 11.2.10.5. Financials (Based on Availability)
- 11.2.11 Security Hub
- 11.2.11.1. Overview
- 11.2.11.2. Products
- 11.2.11.3. SWOT Analysis
- 11.2.11.4. Recent Developments
- 11.2.11.5. Financials (Based on Availability)
- 11.2.12 XM Cyber
- 11.2.12.1. Overview
- 11.2.12.2. Products
- 11.2.12.3. SWOT Analysis
- 11.2.12.4. Recent Developments
- 11.2.12.5. Financials (Based on Availability)
- 11.2.1 Avantra
List of Figures
- Figure 1: Global Sap Security Software Revenue Breakdown (million, %) by Region 2025 & 2033
- Figure 2: North America Sap Security Software Revenue (million), by Application 2025 & 2033
- Figure 3: North America Sap Security Software Revenue Share (%), by Application 2025 & 2033
- Figure 4: North America Sap Security Software Revenue (million), by Type 2025 & 2033
- Figure 5: North America Sap Security Software Revenue Share (%), by Type 2025 & 2033
- Figure 6: North America Sap Security Software Revenue (million), by Country 2025 & 2033
- Figure 7: North America Sap Security Software Revenue Share (%), by Country 2025 & 2033
- Figure 8: South America Sap Security Software Revenue (million), by Application 2025 & 2033
- Figure 9: South America Sap Security Software Revenue Share (%), by Application 2025 & 2033
- Figure 10: South America Sap Security Software Revenue (million), by Type 2025 & 2033
- Figure 11: South America Sap Security Software Revenue Share (%), by Type 2025 & 2033
- Figure 12: South America Sap Security Software Revenue (million), by Country 2025 & 2033
- Figure 13: South America Sap Security Software Revenue Share (%), by Country 2025 & 2033
- Figure 14: Europe Sap Security Software Revenue (million), by Application 2025 & 2033
- Figure 15: Europe Sap Security Software Revenue Share (%), by Application 2025 & 2033
- Figure 16: Europe Sap Security Software Revenue (million), by Type 2025 & 2033
- Figure 17: Europe Sap Security Software Revenue Share (%), by Type 2025 & 2033
- Figure 18: Europe Sap Security Software Revenue (million), by Country 2025 & 2033
- Figure 19: Europe Sap Security Software Revenue Share (%), by Country 2025 & 2033
- Figure 20: Middle East & Africa Sap Security Software Revenue (million), by Application 2025 & 2033
- Figure 21: Middle East & Africa Sap Security Software Revenue Share (%), by Application 2025 & 2033
- Figure 22: Middle East & Africa Sap Security Software Revenue (million), by Type 2025 & 2033
- Figure 23: Middle East & Africa Sap Security Software Revenue Share (%), by Type 2025 & 2033
- Figure 24: Middle East & Africa Sap Security Software Revenue (million), by Country 2025 & 2033
- Figure 25: Middle East & Africa Sap Security Software Revenue Share (%), by Country 2025 & 2033
- Figure 26: Asia Pacific Sap Security Software Revenue (million), by Application 2025 & 2033
- Figure 27: Asia Pacific Sap Security Software Revenue Share (%), by Application 2025 & 2033
- Figure 28: Asia Pacific Sap Security Software Revenue (million), by Type 2025 & 2033
- Figure 29: Asia Pacific Sap Security Software Revenue Share (%), by Type 2025 & 2033
- Figure 30: Asia Pacific Sap Security Software Revenue (million), by Country 2025 & 2033
- Figure 31: Asia Pacific Sap Security Software Revenue Share (%), by Country 2025 & 2033
List of Tables
- Table 1: Global Sap Security Software Revenue million Forecast, by Application 2020 & 2033
- Table 2: Global Sap Security Software Revenue million Forecast, by Type 2020 & 2033
- Table 3: Global Sap Security Software Revenue million Forecast, by Region 2020 & 2033
- Table 4: Global Sap Security Software Revenue million Forecast, by Application 2020 & 2033
- Table 5: Global Sap Security Software Revenue million Forecast, by Type 2020 & 2033
- Table 6: Global Sap Security Software Revenue million Forecast, by Country 2020 & 2033
- Table 7: United States Sap Security Software Revenue (million) Forecast, by Application 2020 & 2033
- Table 8: Canada Sap Security Software Revenue (million) Forecast, by Application 2020 & 2033
- Table 9: Mexico Sap Security Software Revenue (million) Forecast, by Application 2020 & 2033
- Table 10: Global Sap Security Software Revenue million Forecast, by Application 2020 & 2033
- Table 11: Global Sap Security Software Revenue million Forecast, by Type 2020 & 2033
- Table 12: Global Sap Security Software Revenue million Forecast, by Country 2020 & 2033
- Table 13: Brazil Sap Security Software Revenue (million) Forecast, by Application 2020 & 2033
- Table 14: Argentina Sap Security Software Revenue (million) Forecast, by Application 2020 & 2033
- Table 15: Rest of South America Sap Security Software Revenue (million) Forecast, by Application 2020 & 2033
- Table 16: Global Sap Security Software Revenue million Forecast, by Application 2020 & 2033
- Table 17: Global Sap Security Software Revenue million Forecast, by Type 2020 & 2033
- Table 18: Global Sap Security Software Revenue million Forecast, by Country 2020 & 2033
- Table 19: United Kingdom Sap Security Software Revenue (million) Forecast, by Application 2020 & 2033
- Table 20: Germany Sap Security Software Revenue (million) Forecast, by Application 2020 & 2033
- Table 21: France Sap Security Software Revenue (million) Forecast, by Application 2020 & 2033
- Table 22: Italy Sap Security Software Revenue (million) Forecast, by Application 2020 & 2033
- Table 23: Spain Sap Security Software Revenue (million) Forecast, by Application 2020 & 2033
- Table 24: Russia Sap Security Software Revenue (million) Forecast, by Application 2020 & 2033
- Table 25: Benelux Sap Security Software Revenue (million) Forecast, by Application 2020 & 2033
- Table 26: Nordics Sap Security Software Revenue (million) Forecast, by Application 2020 & 2033
- Table 27: Rest of Europe Sap Security Software Revenue (million) Forecast, by Application 2020 & 2033
- Table 28: Global Sap Security Software Revenue million Forecast, by Application 2020 & 2033
- Table 29: Global Sap Security Software Revenue million Forecast, by Type 2020 & 2033
- Table 30: Global Sap Security Software Revenue million Forecast, by Country 2020 & 2033
- Table 31: Turkey Sap Security Software Revenue (million) Forecast, by Application 2020 & 2033
- Table 32: Israel Sap Security Software Revenue (million) Forecast, by Application 2020 & 2033
- Table 33: GCC Sap Security Software Revenue (million) Forecast, by Application 2020 & 2033
- Table 34: North Africa Sap Security Software Revenue (million) Forecast, by Application 2020 & 2033
- Table 35: South Africa Sap Security Software Revenue (million) Forecast, by Application 2020 & 2033
- Table 36: Rest of Middle East & Africa Sap Security Software Revenue (million) Forecast, by Application 2020 & 2033
- Table 37: Global Sap Security Software Revenue million Forecast, by Application 2020 & 2033
- Table 38: Global Sap Security Software Revenue million Forecast, by Type 2020 & 2033
- Table 39: Global Sap Security Software Revenue million Forecast, by Country 2020 & 2033
- Table 40: China Sap Security Software Revenue (million) Forecast, by Application 2020 & 2033
- Table 41: India Sap Security Software Revenue (million) Forecast, by Application 2020 & 2033
- Table 42: Japan Sap Security Software Revenue (million) Forecast, by Application 2020 & 2033
- Table 43: South Korea Sap Security Software Revenue (million) Forecast, by Application 2020 & 2033
- Table 44: ASEAN Sap Security Software Revenue (million) Forecast, by Application 2020 & 2033
- Table 45: Oceania Sap Security Software Revenue (million) Forecast, by Application 2020 & 2033
- Table 46: Rest of Asia Pacific Sap Security Software Revenue (million) Forecast, by Application 2020 & 2033
Frequently Asked Questions
1. What is the projected Compound Annual Growth Rate (CAGR) of the Sap Security Software?
The projected CAGR is approximately 5.3%.
2. Which companies are prominent players in the Sap Security Software?
Key companies in the market include Avantra, Logpoint, Pathlock, The Onapsis Platform, PowerConnect for SAP & Splunk, Bowbridge, Layer Seven, Microsoft, SAP Enterprise Threat Detection, SecurityBridge, Security Hub, XM Cyber.
3. What are the main segments of the Sap Security Software?
The market segments include Application, Type.
4. Can you provide details about the market size?
The market size is estimated to be USD 172 million as of 2022.
5. What are some drivers contributing to market growth?
N/A
6. What are the notable trends driving market growth?
N/A
7. Are there any restraints impacting market growth?
N/A
8. Can you provide examples of recent developments in the market?
N/A
9. What pricing options are available for accessing the report?
Pricing options include single-user, multi-user, and enterprise licenses priced at USD 4900.00, USD 7350.00, and USD 9800.00 respectively.
10. Is the market size provided in terms of value or volume?
The market size is provided in terms of value, measured in million.
11. Are there any specific market keywords associated with the report?
Yes, the market keyword associated with the report is "Sap Security Software," which aids in identifying and referencing the specific market segment covered.
12. How do I determine which pricing option suits my needs best?
The pricing options vary based on user requirements and access needs. Individual users may opt for single-user licenses, while businesses requiring broader access may choose multi-user or enterprise licenses for cost-effective access to the report.
13. Are there any additional resources or data provided in the Sap Security Software report?
While the report offers comprehensive insights, it's advisable to review the specific contents or supplementary materials provided to ascertain if additional resources or data are available.
14. How can I stay updated on further developments or reports in the Sap Security Software?
To stay informed about further developments, trends, and reports in the Sap Security Software, consider subscribing to industry newsletters, following relevant companies and organizations, or regularly checking reputable industry news sources and publications.
Methodology
Step 1 - Identification of Relevant Samples Size from Population Database


Step 2 - Approaches for Defining Global Market Size (Value, Volume* & Price*)

Note*: In applicable scenarios
Step 3 - Data Sources
Primary Research
- Web Analytics
- Survey Reports
- Research Institute
- Latest Research Reports
- Opinion Leaders
Secondary Research
- Annual Reports
- White Paper
- Latest Press Release
- Industry Association
- Paid Database
- Investor Presentations

Step 4 - Data Triangulation
Involves using different sources of information in order to increase the validity of a study
These sources are likely to be stakeholders in a program - participants, other researchers, program staff, other community members, and so on.
Then we put all data in single framework & apply various statistical tools to find out the dynamic on the market.
During the analysis stage, feedback from the stakeholder groups would be compared to determine areas of agreement as well as areas of divergence