

Key Insights
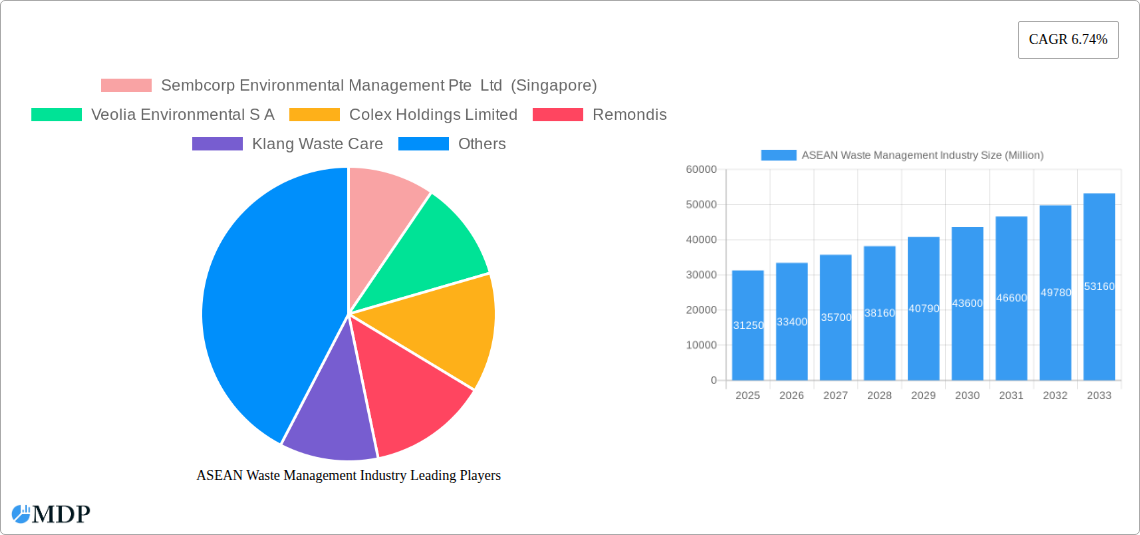
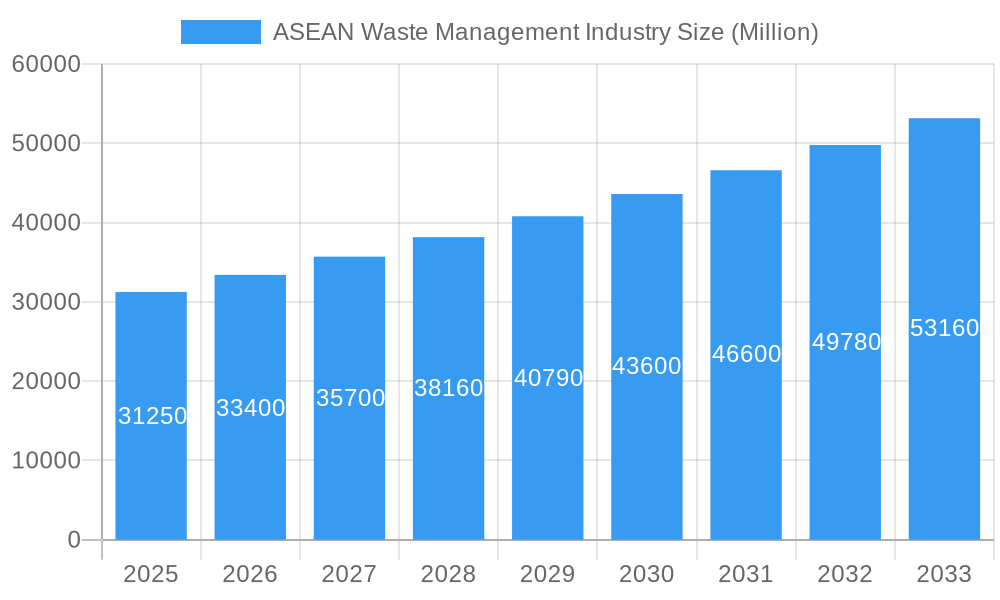
The ASEAN waste management industry, valued at $31.25 billion in 2025, is experiencing robust growth, projected to expand at a Compound Annual Growth Rate (CAGR) of 6.74% from 2025 to 2033. This growth is fueled by several key factors. Rapid urbanization across the region is leading to increased waste generation, necessitating advanced and efficient waste management solutions. Rising environmental awareness among governments and citizens is driving demand for sustainable waste disposal practices, including recycling, composting, and waste-to-energy technologies. Stringent government regulations aimed at reducing landfill reliance and promoting circular economy principles are further propelling market expansion. Furthermore, increasing investments in infrastructure development, particularly in waste processing facilities, are enhancing the industry's capacity to manage the growing waste volumes effectively. The industry is also witnessing technological advancements, such as smart waste management systems and improved recycling technologies, which contribute to improved efficiency and reduced environmental impact.
ASEAN Waste Management Industry Market Size (In Billion)
Key players in this dynamic market include both multinational corporations like Veolia and Sembcorp, and regional companies like Klang Waste Care and Starpal Pte Ltd. Competition is fierce, driving innovation and efficiency improvements. However, challenges remain. Uneven infrastructure development across the region, particularly in less developed areas, presents a significant hurdle. Lack of awareness and participation in recycling programs in some regions also hinder progress. The industry's success will depend on continued investment in infrastructure, technological advancements, public awareness campaigns, and supportive government policies to facilitate a truly sustainable waste management ecosystem throughout ASEAN. The forecast period reveals a significant opportunity for industry stakeholders to capitalize on this expansion through strategic investments, partnerships, and innovative solutions.
ASEAN Waste Management Industry Company Market Share
ASEAN Waste Management Industry: A Comprehensive Market Report (2019-2033)
This comprehensive report provides an in-depth analysis of the ASEAN waste management industry, offering invaluable insights for stakeholders seeking to navigate this dynamic and rapidly evolving market. With a study period spanning 2019-2033, a base year of 2025, and a forecast period of 2025-2033, this report delivers critical data and projections to inform strategic decision-making. The report covers key market segments, leading players, and emerging trends, providing a 360-degree view of the ASEAN waste management landscape. The total market size is predicted to reach xx Million by 2033.
ASEAN Waste Management Industry Market Dynamics & Concentration
The ASEAN waste management market is characterized by a moderate level of concentration, with several large multinational companies and a growing number of regional players vying for market share. Key market dynamics include:
- Market Concentration: The top 5 players hold an estimated xx% market share in 2025, with significant variations across different ASEAN countries.
- Innovation Drivers: Growing environmental concerns, stringent government regulations, and the increasing adoption of circular economy principles are driving innovation in waste management technologies and services.
- Regulatory Frameworks: Varying regulations across ASEAN nations present both opportunities and challenges, influencing investment decisions and operational strategies. Harmonization efforts are underway but face significant hurdles.
- Product Substitutes: Technological advancements are constantly introducing new materials and processes, impacting the demand for traditional waste management solutions. The rise of biodegradable plastics, for example, could reshape market dynamics.
- End-User Trends: A growing awareness of environmental responsibility among consumers is driving demand for sustainable waste management practices. This is particularly evident in urban areas with higher concentrations of waste generation.
- M&A Activities: The industry has witnessed a significant number of mergers and acquisitions (M&A) in recent years, estimated at xx deals in the last 5 years, signaling consolidation and expansion efforts by major players.
ASEAN Waste Management Industry Industry Trends & Analysis
The ASEAN waste management industry is experiencing robust growth, driven by several key factors. The Compound Annual Growth Rate (CAGR) is projected to be xx% during the forecast period (2025-2033). Key trends include:
- Market Growth Drivers: Rapid urbanization, rising disposable incomes, and increasing industrial activity are contributing to substantial waste generation, fueling demand for efficient waste management solutions. Government initiatives promoting sustainable waste management further bolster market growth.
- Technological Disruptions: Advancements in waste-to-energy technologies, smart waste management systems, and AI-powered waste sorting are transforming industry practices, enhancing efficiency, and creating new revenue streams.
- Consumer Preferences: Growing consumer awareness of environmental issues is driving demand for environmentally friendly waste disposal and recycling options. This shift in consumer behaviour is influencing industry practices and product development.
- Competitive Dynamics: The market is characterized by intense competition among established players and emerging companies, leading to continuous innovation and price pressures. Strategic partnerships and collaborations are becoming increasingly important. Market penetration for advanced recycling technologies is estimated at xx% in 2025 and projected to increase to xx% by 2033.
Leading Markets & Segments in ASEAN Waste Management Industry
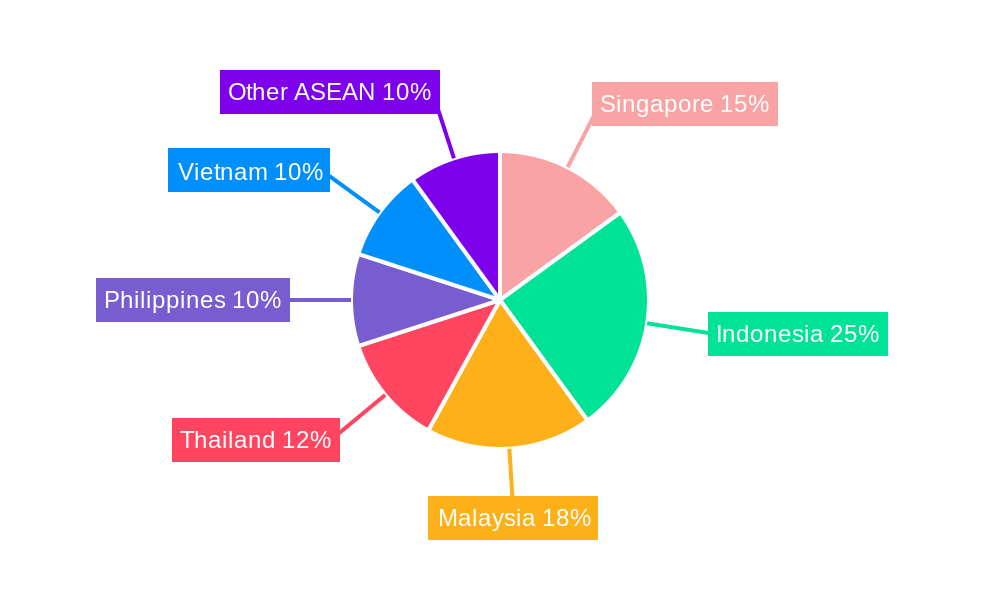
While the entire ASEAN region presents significant opportunities, certain countries and segments exhibit faster growth. Singapore, Indonesia, and Malaysia are leading markets due to their higher waste generation rates and robust economies. Within segments, the industrial waste management segment holds a significant market share, followed by municipal solid waste management.
- Key Drivers for Dominant Regions:
- Singapore: Stringent environmental regulations, strong government support, and advanced infrastructure.
- Indonesia: Rapid urbanization, industrial growth, and increasing government focus on waste management.
- Malaysia: Similar factors to Indonesia, with additional emphasis on palm oil waste management.
- Dominance Analysis: Singapore's dominance stems from its early adoption of advanced technologies and stringent environmental regulations. Indonesia and Malaysia are catching up rapidly, attracting substantial investment and experiencing significant growth in their respective waste management sectors. The industrial waste management segment’s dominance reflects higher profitability margins and a growing need for specialized solutions from manufacturing and industrial facilities.
ASEAN Waste Management Industry Product Developments
Recent product innovations focus on enhancing efficiency, reducing environmental impact, and improving resource recovery. Advancements in waste-to-energy technologies, automated waste sorting systems, and innovative recycling methods are transforming the industry. These advancements cater to growing demand for sustainable and cost-effective waste management solutions, improving market fit and offering competitive advantages.
Key Drivers of ASEAN Waste Management Industry Growth
Several factors are driving the growth of the ASEAN waste management industry:
- Technological Advancements: The development and adoption of advanced waste-to-energy technologies, automated sorting systems, and innovative recycling technologies are significantly improving efficiency and sustainability.
- Economic Growth: Rapid economic growth across the ASEAN region leads to increased waste generation, creating a greater demand for comprehensive waste management solutions.
- Stringent Government Regulations: Governments are increasingly implementing stricter regulations regarding waste management, encouraging the development and adoption of sustainable practices and technologies. For example, the extended producer responsibility (EPR) schemes are influencing packaging design and recycling rates.
Challenges in the ASEAN Waste Management Industry Market
Despite significant growth potential, the ASEAN waste management market faces challenges:
- Regulatory Hurdles: Inconsistent and sometimes unclear regulations across different ASEAN countries create complexities for businesses operating regionally. The lack of harmonized standards hampers efficient implementation and investment decisions.
- Supply Chain Issues: Inadequate infrastructure and logistical challenges, especially in rural areas, hinder waste collection and processing, impacting efficiency and costs.
- Competitive Pressures: Intense competition among existing and emerging players leads to price wars and challenges in maintaining profitability.
Emerging Opportunities in ASEAN Waste Management Industry
The long-term outlook for the ASEAN waste management market is positive. Emerging opportunities include:
- Technological Breakthroughs: Further advancements in AI-powered waste sorting, waste-to-biofuel technologies, and advanced recycling methods will create new market opportunities.
- Strategic Partnerships: Collaborations between private companies, government agencies, and research institutions will accelerate innovation and market development.
- Market Expansion: Expansion into underserved rural areas and the development of new waste management solutions for specific waste streams (e.g., e-waste) presents substantial growth potential.
Leading Players in the ASEAN Waste Management Industry Sector
- Sembcorp Environmental Management Pte Ltd (Singapore)
- Veolia Environmental S A
- Colex Holdings Limited
- Remondis
- Klang Waste Care
- Starpal Pte Ltd
- Blue Planet Environmental Solutions
- Greenway Environmental
- PT Prasadha Pamunah Limbah Industri - PPLI
- Boon Poh Refuse Disposal Pte Ltd
- Suez Environment
- Earth Recycling Services Ltd
- ALBA Group Asia
- Se Cure Waste Management
List Not Exhaustive
Key Milestones in ASEAN Waste Management Industry Industry
- December 2022: Launch of Rebottle initiative by Singapore Polytechnic and SembWaste, aiming to boost PET bottle recycling in Singapore. This signifies a step towards a more circular economy and improved recycling rates.
- June 2022: PT Prasadha Pamunah Waste Industries (PPLI) established a representative office in the Wijayakusuma Industrial Area, Indonesia. This signals expansion into a key growth market and increased access to industrial waste streams.
Strategic Outlook for ASEAN Waste Management Industry Market
The ASEAN waste management market is poised for continued strong growth, driven by technological innovation, supportive government policies, and increasing consumer awareness. Strategic opportunities exist for companies that can leverage advanced technologies, build strong partnerships, and adapt to the evolving regulatory landscape. The market's future hinges on effective collaboration across stakeholders to create a truly sustainable and efficient waste management ecosystem across the region.
ASEAN Waste Management Industry Segmentation
-
1. Waste type
- 1.1. Industrial waste
- 1.2. Municipal solid waste
- 1.3. E-waste
- 1.4. Other Waste types
-
2. Disposal methods
- 2.1. Collection
- 2.2. Landfill
- 2.3. Others
-
3. Geography
- 3.1. Indonesia
- 3.2. Thailand
- 3.3. Malaysia
- 3.4. Singapore
- 3.5. Rest of ASEAN
ASEAN Waste Management Industry Segmentation By Geography
- 1. Indonesia
- 2. Thailand
- 3. Malaysia
- 4. Singapore
- 5. Rest of ASEAN
ASEAN Waste Management Industry Regional Market Share
Geographic Coverage of ASEAN Waste Management Industry
ASEAN Waste Management Industry REPORT HIGHLIGHTS
| Aspects | Details |
|---|---|
| Study Period | 2020-2034 |
| Base Year | 2025 |
| Estimated Year | 2026 |
| Forecast Period | 2026-2034 |
| Historical Period | 2020-2025 |
| Growth Rate | CAGR of 6.74% from 2020-2034 |
| Segmentation |
|
Table of Contents
- 1. Introduction
- 1.1. Research Scope
- 1.2. Market Segmentation
- 1.3. Research Objective
- 1.4. Definitions and Assumptions
- 2. Executive Summary
- 2.1. Market Snapshot
- 3. Market Dynamics
- 3.1. Market Drivers
- 3.2. Market Restrains
- 3.3. Market Trends
- 3.4. Market Opportunities
- 4. Market Factor Analysis
- 4.1. Porters Five Forces
- 4.1.1. Bargaining Power of Suppliers
- 4.1.2. Bargaining Power of Buyers
- 4.1.3. Threat of New Entrants
- 4.1.4. Threat of Substitutes
- 4.1.5. Competitive Rivalry
- 4.2. PESTEL analysis
- 4.3. BCG Analysis
- 4.3.1. Stars (High Growth, High Market Share)
- 4.3.2. Cash Cows (Low Growth, High Market Share)
- 4.3.3. Question Mark (High Growth, Low Market Share)
- 4.3.4. Dogs (Low Growth, Low Market Share)
- 4.4. Ansoff Matrix Analysis
- 4.5. Supply Chain Analysis
- 4.6. Regulatory Landscape
- 4.7. Current Market Potential and Opportunity Assessment (TAM–SAM–SOM Framework)
- 4.8. MDP Analyst Note
- 4.1. Porters Five Forces
- 5. Market Analysis, Insights and Forecast 2021-2033
- 5.1. Market Analysis, Insights and Forecast - by Waste type
- 5.1.1. Industrial waste
- 5.1.2. Municipal solid waste
- 5.1.3. E-waste
- 5.1.4. Other Waste types
- 5.2. Market Analysis, Insights and Forecast - by Disposal methods
- 5.2.1. Collection
- 5.2.2. Landfill
- 5.2.3. Others
- 5.3. Market Analysis, Insights and Forecast - by Geography
- 5.3.1. Indonesia
- 5.3.2. Thailand
- 5.3.3. Malaysia
- 5.3.4. Singapore
- 5.3.5. Rest of ASEAN
- 5.4. Market Analysis, Insights and Forecast - by Region
- 5.4.1. Indonesia
- 5.4.2. Thailand
- 5.4.3. Malaysia
- 5.4.4. Singapore
- 5.4.5. Rest of ASEAN
- 5.1. Market Analysis, Insights and Forecast - by Waste type
- 6. Global ASEAN Waste Management Industry Analysis, Insights and Forecast, 2021-2033
- 6.1. Market Analysis, Insights and Forecast - by Waste type
- 6.1.1. Industrial waste
- 6.1.2. Municipal solid waste
- 6.1.3. E-waste
- 6.1.4. Other Waste types
- 6.2. Market Analysis, Insights and Forecast - by Disposal methods
- 6.2.1. Collection
- 6.2.2. Landfill
- 6.2.3. Others
- 6.3. Market Analysis, Insights and Forecast - by Geography
- 6.3.1. Indonesia
- 6.3.2. Thailand
- 6.3.3. Malaysia
- 6.3.4. Singapore
- 6.3.5. Rest of ASEAN
- 6.1. Market Analysis, Insights and Forecast - by Waste type
- 7. Indonesia ASEAN Waste Management Industry Analysis, Insights and Forecast, 2020-2032
- 7.1. Market Analysis, Insights and Forecast - by Waste type
- 7.1.1. Industrial waste
- 7.1.2. Municipal solid waste
- 7.1.3. E-waste
- 7.1.4. Other Waste types
- 7.2. Market Analysis, Insights and Forecast - by Disposal methods
- 7.2.1. Collection
- 7.2.2. Landfill
- 7.2.3. Others
- 7.3. Market Analysis, Insights and Forecast - by Geography
- 7.3.1. Indonesia
- 7.3.2. Thailand
- 7.3.3. Malaysia
- 7.3.4. Singapore
- 7.3.5. Rest of ASEAN
- 7.1. Market Analysis, Insights and Forecast - by Waste type
- 8. Thailand ASEAN Waste Management Industry Analysis, Insights and Forecast, 2020-2032
- 8.1. Market Analysis, Insights and Forecast - by Waste type
- 8.1.1. Industrial waste
- 8.1.2. Municipal solid waste
- 8.1.3. E-waste
- 8.1.4. Other Waste types
- 8.2. Market Analysis, Insights and Forecast - by Disposal methods
- 8.2.1. Collection
- 8.2.2. Landfill
- 8.2.3. Others
- 8.3. Market Analysis, Insights and Forecast - by Geography
- 8.3.1. Indonesia
- 8.3.2. Thailand
- 8.3.3. Malaysia
- 8.3.4. Singapore
- 8.3.5. Rest of ASEAN
- 8.1. Market Analysis, Insights and Forecast - by Waste type
- 9. Malaysia ASEAN Waste Management Industry Analysis, Insights and Forecast, 2020-2032
- 9.1. Market Analysis, Insights and Forecast - by Waste type
- 9.1.1. Industrial waste
- 9.1.2. Municipal solid waste
- 9.1.3. E-waste
- 9.1.4. Other Waste types
- 9.2. Market Analysis, Insights and Forecast - by Disposal methods
- 9.2.1. Collection
- 9.2.2. Landfill
- 9.2.3. Others
- 9.3. Market Analysis, Insights and Forecast - by Geography
- 9.3.1. Indonesia
- 9.3.2. Thailand
- 9.3.3. Malaysia
- 9.3.4. Singapore
- 9.3.5. Rest of ASEAN
- 9.1. Market Analysis, Insights and Forecast - by Waste type
- 10. Singapore ASEAN Waste Management Industry Analysis, Insights and Forecast, 2020-2032
- 10.1. Market Analysis, Insights and Forecast - by Waste type
- 10.1.1. Industrial waste
- 10.1.2. Municipal solid waste
- 10.1.3. E-waste
- 10.1.4. Other Waste types
- 10.2. Market Analysis, Insights and Forecast - by Disposal methods
- 10.2.1. Collection
- 10.2.2. Landfill
- 10.2.3. Others
- 10.3. Market Analysis, Insights and Forecast - by Geography
- 10.3.1. Indonesia
- 10.3.2. Thailand
- 10.3.3. Malaysia
- 10.3.4. Singapore
- 10.3.5. Rest of ASEAN
- 10.1. Market Analysis, Insights and Forecast - by Waste type
- 11. Rest of ASEAN ASEAN Waste Management Industry Analysis, Insights and Forecast, 2020-2032
- 11.1. Market Analysis, Insights and Forecast - by Waste type
- 11.1.1. Industrial waste
- 11.1.2. Municipal solid waste
- 11.1.3. E-waste
- 11.1.4. Other Waste types
- 11.2. Market Analysis, Insights and Forecast - by Disposal methods
- 11.2.1. Collection
- 11.2.2. Landfill
- 11.2.3. Others
- 11.3. Market Analysis, Insights and Forecast - by Geography
- 11.3.1. Indonesia
- 11.3.2. Thailand
- 11.3.3. Malaysia
- 11.3.4. Singapore
- 11.3.5. Rest of ASEAN
- 11.1. Market Analysis, Insights and Forecast - by Waste type
- 12. Competitive Analysis
- 12.1. Company Profiles
- 12.1.1 Sembcorp Environmental Management Pte Ltd (Singapore)
- 12.1.1.1. Company Overview
- 12.1.1.2. Products
- 12.1.1.3. Company Financials
- 12.1.1.4. SWOT Analysis
- 12.1.2 Veolia Environmental S A
- 12.1.2.1. Company Overview
- 12.1.2.2. Products
- 12.1.2.3. Company Financials
- 12.1.2.4. SWOT Analysis
- 12.1.3 Colex Holdings Limited
- 12.1.3.1. Company Overview
- 12.1.3.2. Products
- 12.1.3.3. Company Financials
- 12.1.3.4. SWOT Analysis
- 12.1.4 Remondis
- 12.1.4.1. Company Overview
- 12.1.4.2. Products
- 12.1.4.3. Company Financials
- 12.1.4.4. SWOT Analysis
- 12.1.5 Klang Waste Care
- 12.1.5.1. Company Overview
- 12.1.5.2. Products
- 12.1.5.3. Company Financials
- 12.1.5.4. SWOT Analysis
- 12.1.6 Starpal Pte Ltd
- 12.1.6.1. Company Overview
- 12.1.6.2. Products
- 12.1.6.3. Company Financials
- 12.1.6.4. SWOT Analysis
- 12.1.7 Blue Planet Environmental Solutions
- 12.1.7.1. Company Overview
- 12.1.7.2. Products
- 12.1.7.3. Company Financials
- 12.1.7.4. SWOT Analysis
- 12.1.8 Greenway Environmental
- 12.1.8.1. Company Overview
- 12.1.8.2. Products
- 12.1.8.3. Company Financials
- 12.1.8.4. SWOT Analysis
- 12.1.9 PT Prasadha Pamunah Limbah Industri - PPLI
- 12.1.9.1. Company Overview
- 12.1.9.2. Products
- 12.1.9.3. Company Financials
- 12.1.9.4. SWOT Analysis
- 12.1.10 Boon Poh Refuse Disposal Pte Ltd
- 12.1.10.1. Company Overview
- 12.1.10.2. Products
- 12.1.10.3. Company Financials
- 12.1.10.4. SWOT Analysis
- 12.1.11 Suez Environment
- 12.1.11.1. Company Overview
- 12.1.11.2. Products
- 12.1.11.3. Company Financials
- 12.1.11.4. SWOT Analysis
- 12.1.12 Earth Recycling Services Ltd
- 12.1.12.1. Company Overview
- 12.1.12.2. Products
- 12.1.12.3. Company Financials
- 12.1.12.4. SWOT Analysis
- 12.1.13 ALBA Group Asia
- 12.1.13.1. Company Overview
- 12.1.13.2. Products
- 12.1.13.3. Company Financials
- 12.1.13.4. SWOT Analysis
- 12.1.14 Se Cure Waste Management**List Not Exhaustive
- 12.1.14.1. Company Overview
- 12.1.14.2. Products
- 12.1.14.3. Company Financials
- 12.1.14.4. SWOT Analysis
- 12.1.1 Sembcorp Environmental Management Pte Ltd (Singapore)
- 12.2. Market Entropy
- 12.2.1 Company's Key Areas Served
- 12.2.2 Recent Developments
- 12.3. Company Market Share Analysis 2025
- 12.3.1 Top 5 Companies Market Share Analysis
- 12.3.2 Top 3 Companies Market Share Analysis
- 12.4. List of Potential Customers
- 13. Research Methodology
List of Figures
- Figure 1: Global ASEAN Waste Management Industry Revenue Breakdown (Million, %) by Region 2025 & 2033
- Figure 2: Global ASEAN Waste Management Industry Volume Breakdown (Billion, %) by Region 2025 & 2033
- Figure 3: Indonesia ASEAN Waste Management Industry Revenue (Million), by Waste type 2025 & 2033
- Figure 4: Indonesia ASEAN Waste Management Industry Volume (Billion), by Waste type 2025 & 2033
- Figure 5: Indonesia ASEAN Waste Management Industry Revenue Share (%), by Waste type 2025 & 2033
- Figure 6: Indonesia ASEAN Waste Management Industry Volume Share (%), by Waste type 2025 & 2033
- Figure 7: Indonesia ASEAN Waste Management Industry Revenue (Million), by Disposal methods 2025 & 2033
- Figure 8: Indonesia ASEAN Waste Management Industry Volume (Billion), by Disposal methods 2025 & 2033
- Figure 9: Indonesia ASEAN Waste Management Industry Revenue Share (%), by Disposal methods 2025 & 2033
- Figure 10: Indonesia ASEAN Waste Management Industry Volume Share (%), by Disposal methods 2025 & 2033
- Figure 11: Indonesia ASEAN Waste Management Industry Revenue (Million), by Geography 2025 & 2033
- Figure 12: Indonesia ASEAN Waste Management Industry Volume (Billion), by Geography 2025 & 2033
- Figure 13: Indonesia ASEAN Waste Management Industry Revenue Share (%), by Geography 2025 & 2033
- Figure 14: Indonesia ASEAN Waste Management Industry Volume Share (%), by Geography 2025 & 2033
- Figure 15: Indonesia ASEAN Waste Management Industry Revenue (Million), by Country 2025 & 2033
- Figure 16: Indonesia ASEAN Waste Management Industry Volume (Billion), by Country 2025 & 2033
- Figure 17: Indonesia ASEAN Waste Management Industry Revenue Share (%), by Country 2025 & 2033
- Figure 18: Indonesia ASEAN Waste Management Industry Volume Share (%), by Country 2025 & 2033
- Figure 19: Thailand ASEAN Waste Management Industry Revenue (Million), by Waste type 2025 & 2033
- Figure 20: Thailand ASEAN Waste Management Industry Volume (Billion), by Waste type 2025 & 2033
- Figure 21: Thailand ASEAN Waste Management Industry Revenue Share (%), by Waste type 2025 & 2033
- Figure 22: Thailand ASEAN Waste Management Industry Volume Share (%), by Waste type 2025 & 2033
- Figure 23: Thailand ASEAN Waste Management Industry Revenue (Million), by Disposal methods 2025 & 2033
- Figure 24: Thailand ASEAN Waste Management Industry Volume (Billion), by Disposal methods 2025 & 2033
- Figure 25: Thailand ASEAN Waste Management Industry Revenue Share (%), by Disposal methods 2025 & 2033
- Figure 26: Thailand ASEAN Waste Management Industry Volume Share (%), by Disposal methods 2025 & 2033
- Figure 27: Thailand ASEAN Waste Management Industry Revenue (Million), by Geography 2025 & 2033
- Figure 28: Thailand ASEAN Waste Management Industry Volume (Billion), by Geography 2025 & 2033
- Figure 29: Thailand ASEAN Waste Management Industry Revenue Share (%), by Geography 2025 & 2033
- Figure 30: Thailand ASEAN Waste Management Industry Volume Share (%), by Geography 2025 & 2033
- Figure 31: Thailand ASEAN Waste Management Industry Revenue (Million), by Country 2025 & 2033
- Figure 32: Thailand ASEAN Waste Management Industry Volume (Billion), by Country 2025 & 2033
- Figure 33: Thailand ASEAN Waste Management Industry Revenue Share (%), by Country 2025 & 2033
- Figure 34: Thailand ASEAN Waste Management Industry Volume Share (%), by Country 2025 & 2033
- Figure 35: Malaysia ASEAN Waste Management Industry Revenue (Million), by Waste type 2025 & 2033
- Figure 36: Malaysia ASEAN Waste Management Industry Volume (Billion), by Waste type 2025 & 2033
- Figure 37: Malaysia ASEAN Waste Management Industry Revenue Share (%), by Waste type 2025 & 2033
- Figure 38: Malaysia ASEAN Waste Management Industry Volume Share (%), by Waste type 2025 & 2033
- Figure 39: Malaysia ASEAN Waste Management Industry Revenue (Million), by Disposal methods 2025 & 2033
- Figure 40: Malaysia ASEAN Waste Management Industry Volume (Billion), by Disposal methods 2025 & 2033
- Figure 41: Malaysia ASEAN Waste Management Industry Revenue Share (%), by Disposal methods 2025 & 2033
- Figure 42: Malaysia ASEAN Waste Management Industry Volume Share (%), by Disposal methods 2025 & 2033
- Figure 43: Malaysia ASEAN Waste Management Industry Revenue (Million), by Geography 2025 & 2033
- Figure 44: Malaysia ASEAN Waste Management Industry Volume (Billion), by Geography 2025 & 2033
- Figure 45: Malaysia ASEAN Waste Management Industry Revenue Share (%), by Geography 2025 & 2033
- Figure 46: Malaysia ASEAN Waste Management Industry Volume Share (%), by Geography 2025 & 2033
- Figure 47: Malaysia ASEAN Waste Management Industry Revenue (Million), by Country 2025 & 2033
- Figure 48: Malaysia ASEAN Waste Management Industry Volume (Billion), by Country 2025 & 2033
- Figure 49: Malaysia ASEAN Waste Management Industry Revenue Share (%), by Country 2025 & 2033
- Figure 50: Malaysia ASEAN Waste Management Industry Volume Share (%), by Country 2025 & 2033
- Figure 51: Singapore ASEAN Waste Management Industry Revenue (Million), by Waste type 2025 & 2033
- Figure 52: Singapore ASEAN Waste Management Industry Volume (Billion), by Waste type 2025 & 2033
- Figure 53: Singapore ASEAN Waste Management Industry Revenue Share (%), by Waste type 2025 & 2033
- Figure 54: Singapore ASEAN Waste Management Industry Volume Share (%), by Waste type 2025 & 2033
- Figure 55: Singapore ASEAN Waste Management Industry Revenue (Million), by Disposal methods 2025 & 2033
- Figure 56: Singapore ASEAN Waste Management Industry Volume (Billion), by Disposal methods 2025 & 2033
- Figure 57: Singapore ASEAN Waste Management Industry Revenue Share (%), by Disposal methods 2025 & 2033
- Figure 58: Singapore ASEAN Waste Management Industry Volume Share (%), by Disposal methods 2025 & 2033
- Figure 59: Singapore ASEAN Waste Management Industry Revenue (Million), by Geography 2025 & 2033
- Figure 60: Singapore ASEAN Waste Management Industry Volume (Billion), by Geography 2025 & 2033
- Figure 61: Singapore ASEAN Waste Management Industry Revenue Share (%), by Geography 2025 & 2033
- Figure 62: Singapore ASEAN Waste Management Industry Volume Share (%), by Geography 2025 & 2033
- Figure 63: Singapore ASEAN Waste Management Industry Revenue (Million), by Country 2025 & 2033
- Figure 64: Singapore ASEAN Waste Management Industry Volume (Billion), by Country 2025 & 2033
- Figure 65: Singapore ASEAN Waste Management Industry Revenue Share (%), by Country 2025 & 2033
- Figure 66: Singapore ASEAN Waste Management Industry Volume Share (%), by Country 2025 & 2033
- Figure 67: Rest of ASEAN ASEAN Waste Management Industry Revenue (Million), by Waste type 2025 & 2033
- Figure 68: Rest of ASEAN ASEAN Waste Management Industry Volume (Billion), by Waste type 2025 & 2033
- Figure 69: Rest of ASEAN ASEAN Waste Management Industry Revenue Share (%), by Waste type 2025 & 2033
- Figure 70: Rest of ASEAN ASEAN Waste Management Industry Volume Share (%), by Waste type 2025 & 2033
- Figure 71: Rest of ASEAN ASEAN Waste Management Industry Revenue (Million), by Disposal methods 2025 & 2033
- Figure 72: Rest of ASEAN ASEAN Waste Management Industry Volume (Billion), by Disposal methods 2025 & 2033
- Figure 73: Rest of ASEAN ASEAN Waste Management Industry Revenue Share (%), by Disposal methods 2025 & 2033
- Figure 74: Rest of ASEAN ASEAN Waste Management Industry Volume Share (%), by Disposal methods 2025 & 2033
- Figure 75: Rest of ASEAN ASEAN Waste Management Industry Revenue (Million), by Geography 2025 & 2033
- Figure 76: Rest of ASEAN ASEAN Waste Management Industry Volume (Billion), by Geography 2025 & 2033
- Figure 77: Rest of ASEAN ASEAN Waste Management Industry Revenue Share (%), by Geography 2025 & 2033
- Figure 78: Rest of ASEAN ASEAN Waste Management Industry Volume Share (%), by Geography 2025 & 2033
- Figure 79: Rest of ASEAN ASEAN Waste Management Industry Revenue (Million), by Country 2025 & 2033
- Figure 80: Rest of ASEAN ASEAN Waste Management Industry Volume (Billion), by Country 2025 & 2033
- Figure 81: Rest of ASEAN ASEAN Waste Management Industry Revenue Share (%), by Country 2025 & 2033
- Figure 82: Rest of ASEAN ASEAN Waste Management Industry Volume Share (%), by Country 2025 & 2033
List of Tables
- Table 1: Global ASEAN Waste Management Industry Revenue Million Forecast, by Waste type 2020 & 2033
- Table 2: Global ASEAN Waste Management Industry Volume Billion Forecast, by Waste type 2020 & 2033
- Table 3: Global ASEAN Waste Management Industry Revenue Million Forecast, by Disposal methods 2020 & 2033
- Table 4: Global ASEAN Waste Management Industry Volume Billion Forecast, by Disposal methods 2020 & 2033
- Table 5: Global ASEAN Waste Management Industry Revenue Million Forecast, by Geography 2020 & 2033
- Table 6: Global ASEAN Waste Management Industry Volume Billion Forecast, by Geography 2020 & 2033
- Table 7: Global ASEAN Waste Management Industry Revenue Million Forecast, by Region 2020 & 2033
- Table 8: Global ASEAN Waste Management Industry Volume Billion Forecast, by Region 2020 & 2033
- Table 9: Global ASEAN Waste Management Industry Revenue Million Forecast, by Waste type 2020 & 2033
- Table 10: Global ASEAN Waste Management Industry Volume Billion Forecast, by Waste type 2020 & 2033
- Table 11: Global ASEAN Waste Management Industry Revenue Million Forecast, by Disposal methods 2020 & 2033
- Table 12: Global ASEAN Waste Management Industry Volume Billion Forecast, by Disposal methods 2020 & 2033
- Table 13: Global ASEAN Waste Management Industry Revenue Million Forecast, by Geography 2020 & 2033
- Table 14: Global ASEAN Waste Management Industry Volume Billion Forecast, by Geography 2020 & 2033
- Table 15: Global ASEAN Waste Management Industry Revenue Million Forecast, by Country 2020 & 2033
- Table 16: Global ASEAN Waste Management Industry Volume Billion Forecast, by Country 2020 & 2033
- Table 17: Global ASEAN Waste Management Industry Revenue Million Forecast, by Waste type 2020 & 2033
- Table 18: Global ASEAN Waste Management Industry Volume Billion Forecast, by Waste type 2020 & 2033
- Table 19: Global ASEAN Waste Management Industry Revenue Million Forecast, by Disposal methods 2020 & 2033
- Table 20: Global ASEAN Waste Management Industry Volume Billion Forecast, by Disposal methods 2020 & 2033
- Table 21: Global ASEAN Waste Management Industry Revenue Million Forecast, by Geography 2020 & 2033
- Table 22: Global ASEAN Waste Management Industry Volume Billion Forecast, by Geography 2020 & 2033
- Table 23: Global ASEAN Waste Management Industry Revenue Million Forecast, by Country 2020 & 2033
- Table 24: Global ASEAN Waste Management Industry Volume Billion Forecast, by Country 2020 & 2033
- Table 25: Global ASEAN Waste Management Industry Revenue Million Forecast, by Waste type 2020 & 2033
- Table 26: Global ASEAN Waste Management Industry Volume Billion Forecast, by Waste type 2020 & 2033
- Table 27: Global ASEAN Waste Management Industry Revenue Million Forecast, by Disposal methods 2020 & 2033
- Table 28: Global ASEAN Waste Management Industry Volume Billion Forecast, by Disposal methods 2020 & 2033
- Table 29: Global ASEAN Waste Management Industry Revenue Million Forecast, by Geography 2020 & 2033
- Table 30: Global ASEAN Waste Management Industry Volume Billion Forecast, by Geography 2020 & 2033
- Table 31: Global ASEAN Waste Management Industry Revenue Million Forecast, by Country 2020 & 2033
- Table 32: Global ASEAN Waste Management Industry Volume Billion Forecast, by Country 2020 & 2033
- Table 33: Global ASEAN Waste Management Industry Revenue Million Forecast, by Waste type 2020 & 2033
- Table 34: Global ASEAN Waste Management Industry Volume Billion Forecast, by Waste type 2020 & 2033
- Table 35: Global ASEAN Waste Management Industry Revenue Million Forecast, by Disposal methods 2020 & 2033
- Table 36: Global ASEAN Waste Management Industry Volume Billion Forecast, by Disposal methods 2020 & 2033
- Table 37: Global ASEAN Waste Management Industry Revenue Million Forecast, by Geography 2020 & 2033
- Table 38: Global ASEAN Waste Management Industry Volume Billion Forecast, by Geography 2020 & 2033
- Table 39: Global ASEAN Waste Management Industry Revenue Million Forecast, by Country 2020 & 2033
- Table 40: Global ASEAN Waste Management Industry Volume Billion Forecast, by Country 2020 & 2033
- Table 41: Global ASEAN Waste Management Industry Revenue Million Forecast, by Waste type 2020 & 2033
- Table 42: Global ASEAN Waste Management Industry Volume Billion Forecast, by Waste type 2020 & 2033
- Table 43: Global ASEAN Waste Management Industry Revenue Million Forecast, by Disposal methods 2020 & 2033
- Table 44: Global ASEAN Waste Management Industry Volume Billion Forecast, by Disposal methods 2020 & 2033
- Table 45: Global ASEAN Waste Management Industry Revenue Million Forecast, by Geography 2020 & 2033
- Table 46: Global ASEAN Waste Management Industry Volume Billion Forecast, by Geography 2020 & 2033
- Table 47: Global ASEAN Waste Management Industry Revenue Million Forecast, by Country 2020 & 2033
- Table 48: Global ASEAN Waste Management Industry Volume Billion Forecast, by Country 2020 & 2033
Frequently Asked Questions
1. What is the projected Compound Annual Growth Rate (CAGR) of the ASEAN Waste Management Industry?
The projected CAGR is approximately 6.74%.
2. Which companies are prominent players in the ASEAN Waste Management Industry?
Key companies in the market include Sembcorp Environmental Management Pte Ltd (Singapore), Veolia Environmental S A, Colex Holdings Limited, Remondis, Klang Waste Care, Starpal Pte Ltd, Blue Planet Environmental Solutions, Greenway Environmental, PT Prasadha Pamunah Limbah Industri - PPLI, Boon Poh Refuse Disposal Pte Ltd, Suez Environment, Earth Recycling Services Ltd, ALBA Group Asia, Se Cure Waste Management**List Not Exhaustive.
3. What are the main segments of the ASEAN Waste Management Industry?
The market segments include Waste type, Disposal methods, Geography.
4. Can you provide details about the market size?
The market size is estimated to be USD 31.25 Million as of 2022.
5. What are some drivers contributing to market growth?
N/A
6. What are the notable trends driving market growth?
Indonesia Advances Zero-Plastic Waste Ambitions with Public-Private Partnership to Build Waste Management Capacity and Capability.
7. Are there any restraints impacting market growth?
N/A
8. Can you provide examples of recent developments in the market?
December 2022: A cooperative venture called Rebottle between Singapore Polytechnic (SP) and SembWaste, a fully owned subsidiary of Sembcorp Industries (Sembcorp) intends to increase the amount of PET bottles that are recycled in Singapore, beginning with the Punggol Shore area.June 2022: The introduction of a representative office in the Wijayakusuma Industrial Area was conducted on Thursday, June 30, 2022, making it a significant day in the history of PT Prasadha Pamunah Waste Industries (PPLI). The Wijayakusuma Industrial Estate's management, PT KIW, has leased space to the newly established PT PPLI representative office (Persero). Selling land for industrial usage, renting Ready-to-Use Factory Buildings (BPSP), and leasing space for offices are all part of PT KIW's primary business. The PT PPLI-DESI representative office will be opened with the intention of being a dependable partner for businesses, the Indonesian government, and other stakeholders, and contributing to Indonesia's economic and environmental growth.
9. What pricing options are available for accessing the report?
Pricing options include single-user, multi-user, and enterprise licenses priced at USD 4750, USD 5250, and USD 8750 respectively.
10. Is the market size provided in terms of value or volume?
The market size is provided in terms of value, measured in Million and volume, measured in Billion.
11. Are there any specific market keywords associated with the report?
Yes, the market keyword associated with the report is "ASEAN Waste Management Industry," which aids in identifying and referencing the specific market segment covered.
12. How do I determine which pricing option suits my needs best?
The pricing options vary based on user requirements and access needs. Individual users may opt for single-user licenses, while businesses requiring broader access may choose multi-user or enterprise licenses for cost-effective access to the report.
13. Are there any additional resources or data provided in the ASEAN Waste Management Industry report?
While the report offers comprehensive insights, it's advisable to review the specific contents or supplementary materials provided to ascertain if additional resources or data are available.
14. How can I stay updated on further developments or reports in the ASEAN Waste Management Industry?
To stay informed about further developments, trends, and reports in the ASEAN Waste Management Industry, consider subscribing to industry newsletters, following relevant companies and organizations, or regularly checking reputable industry news sources and publications.
Methodology
Step 1 - Identification of Relevant Samples Size from Population Database


Step 2 - Approaches for Defining Global Market Size (Value, Volume* & Price*)

Note*: In applicable scenarios
Step 3 - Data Sources
Primary Research
- Web Analytics
- Survey Reports
- Research Institute
- Latest Research Reports
- Opinion Leaders
Secondary Research
- Annual Reports
- White Paper
- Latest Press Release
- Industry Association
- Paid Database
- Investor Presentations

Step 4 - Data Triangulation
Involves using different sources of information in order to increase the validity of a study
These sources are likely to be stakeholders in a program - participants, other researchers, program staff, other community members, and so on.
Then we put all data in single framework & apply various statistical tools to find out the dynamic on the market.
During the analysis stage, feedback from the stakeholder groups would be compared to determine areas of agreement as well as areas of divergence