

Key Insights
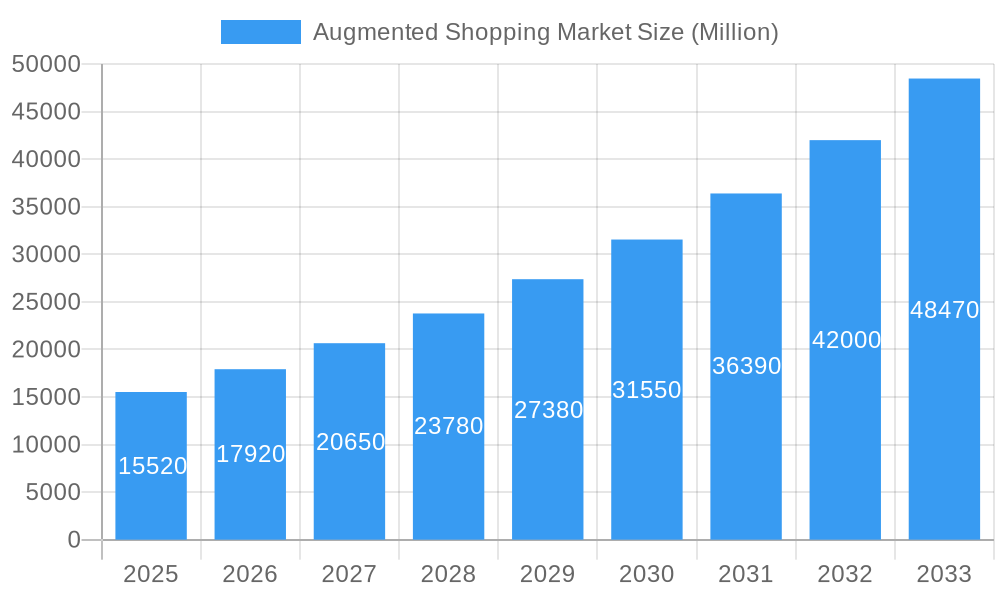
The augmented reality (AR) shopping market is experiencing robust growth, projected to reach $15.52 billion in 2025 and maintain a Compound Annual Growth Rate (CAGR) of 15.78% from 2025 to 2033. This expansion is fueled by several key factors. Firstly, the increasing adoption of smartphones and other mobile devices equipped with advanced AR capabilities provides a readily accessible platform for immersive shopping experiences. Consumers are increasingly drawn to interactive features that allow them to virtually try on clothes, visualize furniture in their homes, or examine products in 3D before purchasing, leading to higher conversion rates and reduced return rates for businesses. Secondly, technological advancements in AR software and hardware are continually improving the quality and realism of these experiences, making them more engaging and persuasive. Companies are investing heavily in developing more sophisticated AR applications, incorporating features like realistic lighting, detailed textures, and interactive elements that enhance the overall shopping experience. Furthermore, the growing integration of AR into e-commerce platforms is broadening market reach and accessibility.
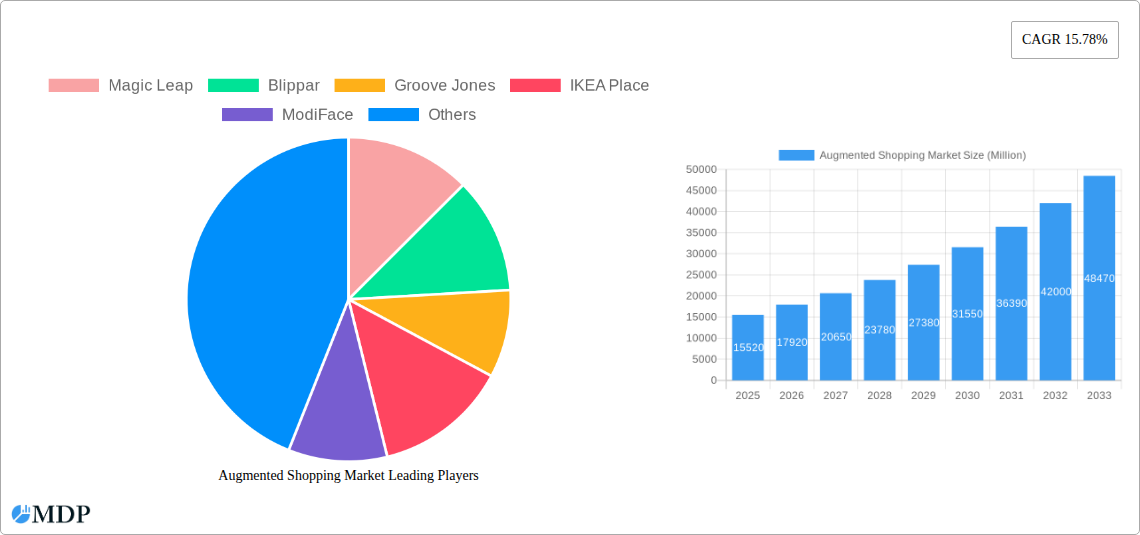
Augmented Shopping Market Market Size (In Billion)
The market's growth is not without challenges. High development costs associated with creating high-quality AR applications and the need for robust internet connectivity in some applications can act as restraints. However, ongoing innovation and decreasing hardware costs are mitigating these barriers. Key players such as Magic Leap, Blippar, Groove Jones, IKEA Place, ModiFace, Obsess, HoloLens, Zugara Inc, PTC Vuforia, and Apple are actively shaping the market landscape through continuous innovation and strategic partnerships. Market segmentation is likely driven by application type (e.g., virtual try-ons, product visualization), device type (e.g., smartphones, tablets, smart glasses), and industry verticals (e.g., fashion, furniture, cosmetics). Regional variations in technology adoption and consumer behavior will also influence market growth, with North America and Europe likely leading in early adoption. The forecast period of 2025-2033 promises continued expansion, driven by technological innovation and rising consumer demand for personalized and engaging shopping experiences.
Augmented Shopping Market Company Market Share
Augmented Shopping Market: A Comprehensive Report (2019-2033)
This in-depth report provides a comprehensive analysis of the Augmented Shopping Market, projecting robust growth and significant transformations throughout the forecast period (2025-2033). With a study period spanning 2019-2024, and a base year of 2025, this report offers invaluable insights for industry stakeholders, investors, and businesses seeking to navigate this rapidly evolving market. The market is expected to reach xx Million by 2033, exhibiting a healthy CAGR of xx%. This report leverages extensive data analysis and expert insights to provide actionable intelligence on market dynamics, leading players, emerging trends, and lucrative opportunities.
Augmented Shopping Market Market Dynamics & Concentration
The Augmented Shopping Market is characterized by a dynamic interplay of factors impacting its growth and concentration. While the market is relatively fragmented, with several key players vying for market share, strategic partnerships and acquisitions are steadily shaping the landscape. The market share of the top 5 players is estimated at xx%, leaving significant room for new entrants and disruptive technologies. Innovation plays a pivotal role, with continuous advancements in AR technology driving new applications and enhancing user experiences. Regulatory frameworks, particularly concerning data privacy and consumer protection, are increasingly important. Furthermore, the rise of virtual try-on features and immersive shopping experiences is pushing out traditional methods. The market witnessed xx M&A deals in the historical period (2019-2024), signaling strong consolidation trends.
- Market Concentration: Moderately fragmented, with top 5 players holding xx% market share.
- Innovation Drivers: Advancements in AR technology, improved user interfaces, and enhanced realism.
- Regulatory Frameworks: Data privacy regulations (e.g., GDPR, CCPA) and consumer protection laws significantly influence market activities.
- Product Substitutes: Traditional in-store and online shopping remain primary substitutes.
- End-User Trends: Growing preference for personalized and interactive shopping experiences.
- M&A Activities: xx M&A deals in 2019-2024, indicating consolidation trends and strategic investments.
Augmented Shopping Market Industry Trends & Analysis
The Augmented Shopping Market is experiencing phenomenal growth, driven by several key factors. The increasing adoption of smartphones and other smart devices capable of supporting AR applications forms a crucial foundation. Consumers are increasingly embracing immersive shopping experiences, fueled by a desire for convenience, personalization, and enhanced product visualization. Technological disruptions, particularly in areas such as computer vision, 3D modeling, and AI-powered personalization, are continuously pushing the boundaries of what's possible. The rise of social commerce and influencer marketing is also significantly impacting consumer behavior and driving augmented shopping adoption. Competitive dynamics are intense, with established players and new entrants constantly vying for market share through innovation and strategic partnerships. This fierce competition is beneficial for consumers, as it leads to better products and services.
- Market Growth Drivers: Smartphone penetration, consumer demand for personalized experiences, technological advancements.
- Technological Disruptions: AI-powered personalization, improved AR tracking, and 3D modeling technologies.
- Consumer Preferences: Demand for immersive, interactive, and convenient shopping experiences.
- Competitive Dynamics: Intense competition among established players and new entrants.
Leading Markets & Segments in Augmented Shopping Market
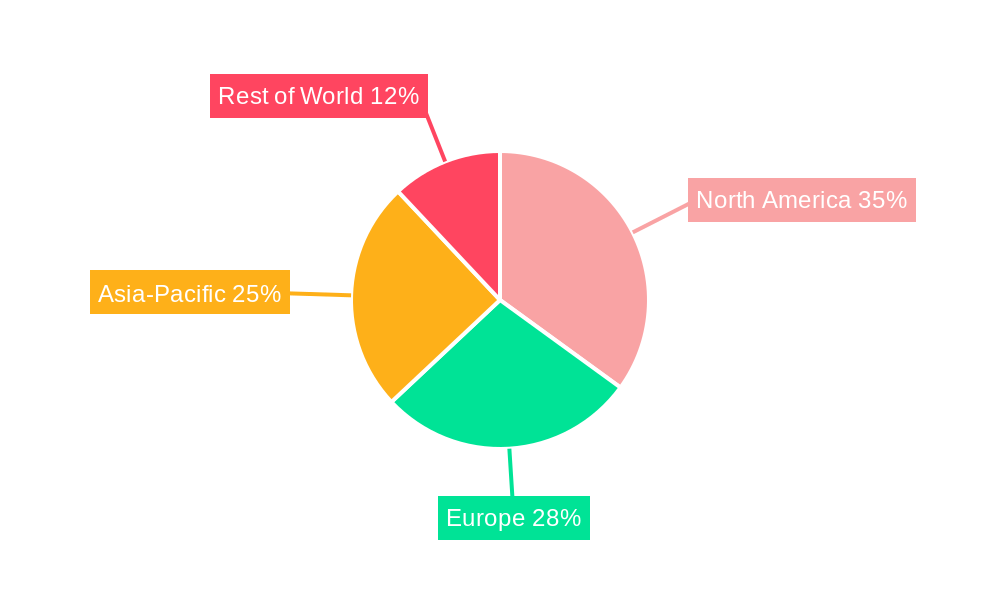
The North American market currently dominates the Augmented Shopping Market, driven by high smartphone penetration, robust technological infrastructure, and a strong consumer base receptive to new technologies. The European market is also exhibiting considerable growth, although at a slightly slower pace. Asia-Pacific is expected to experience substantial growth in the coming years. The apparel and footwear segment holds the largest market share, followed by the furniture and home decor segment.
- Key Drivers for North America: High smartphone penetration, strong tech infrastructure, early adoption of new technologies, and high disposable income.
- Key Drivers for Europe: Increasing smartphone penetration, growing consumer interest in AR technologies, and supportive government initiatives.
- Key Drivers for Asia-Pacific: Rapid smartphone adoption, rising middle class, and expanding e-commerce sector.
- Dominant Segment: Apparel and footwear, driven by the ability to virtually try on clothes and shoes.
Augmented Shopping Market Product Developments
Significant advancements in AR technology have led to the development of more sophisticated and user-friendly augmented shopping applications. These innovations include improved 3D modeling capabilities, enhanced image recognition, and more realistic virtual try-on experiences. Furthermore, the integration of AI-powered personalization features is tailoring shopping experiences to individual consumer preferences. These product improvements are designed to enhance consumer engagement, drive sales, and solidify market positions. The integration of AR with other technologies, such as VR and mixed reality (MR), is paving the way for truly immersive shopping environments.
Key Drivers of Augmented Shopping Market Growth
Technological advancements in AR, AI, and 3D modeling are central to the market's growth trajectory. The rising adoption of smartphones and widespread internet access expands the market’s potential consumer base. The growing preference among consumers for convenient and personalized shopping experiences significantly accelerates market expansion. Favorable regulatory environments and governmental support for technological innovation further boost market growth. Finally, strategic partnerships between technology companies and retailers are accelerating the integration of AR technologies into the shopping experience.
Challenges in the Augmented Shopping Market Market
High initial investment costs for AR infrastructure and application development can pose a barrier to entry for some companies. The requirement for high-quality internet connectivity and powerful devices can limit accessibility in some regions. Competition is intensifying, with existing players and newcomers striving for market dominance. Data privacy and security concerns are also key challenges, necessitating robust data protection measures. The complexities involved in seamlessly integrating AR technology into existing retail ecosystems can pose challenges for businesses.
Emerging Opportunities in Augmented Shopping Market
The integration of augmented reality with other technologies, such as the metaverse, offers exciting opportunities. The expansion of augmented shopping into emerging markets with rapidly growing smartphone penetration represents a vast untapped potential. Strategic partnerships between technology providers, retailers, and brands will create new opportunities for innovation and market expansion. The development of more sophisticated and engaging AR applications that go beyond basic virtual try-ons is expected to increase consumer engagement.
Leading Players in the Augmented Shopping Market Sector
- Magic Leap
- Blippar
- Groove Jones
- IKEA Place (Website unavailable)
- ModiFace
- Obsess
- HoloLens (Website unavailable)
- Zugara Inc (Website unavailable)
- PTC Vuforia
- Apple Inc
Key Milestones in Augmented Shopping Market Industry
- August 2023: Blackjack Promotions launched an immersive AR campaign for families in collaboration with Dufry. This demonstrates the growing use of AR in travel retail.
- May 2024: Google and Magic Leap partnered to develop AR and optical solutions, signifying a major strategic move in the AR landscape. This collaboration signifies a significant push towards more advanced AR technologies for shopping applications.
Strategic Outlook for Augmented Shopping Market Market
The Augmented Shopping Market is poised for sustained growth, driven by ongoing technological advancements, increasing consumer adoption, and strategic partnerships across the industry. Future market potential lies in the development of even more sophisticated and immersive AR experiences, seamless integration with other technologies, and expansion into new markets. Companies that successfully navigate the challenges and capitalize on the emerging opportunities are well-positioned to capture significant market share in the years to come. The strategic focus should be on continuous innovation, strategic partnerships, and a customer-centric approach to application development.
Augmented Shopping Market Segmentation
-
1. Component
- 1.1. Solutions
- 1.2. Services
-
2. Application
- 2.1. Furniture and Lighting
- 2.2. Beauty and Cosmetics
- 2.3. Apparel Fitting
- 2.4. Grocery Shopping
- 2.5. Footwear
- 2.6. Other Applications
Augmented Shopping Market Segmentation By Geography
-
1. North America
- 1.1. United States
- 1.2. Canada
- 1.3. Rest of North America
-
2. Europe
- 2.1. Germany
- 2.2. United Kingdom
- 2.3. France
- 2.4. Russia
- 2.5. Spain
- 2.6. Rest of Europe
-
3. Asia Pacific
- 3.1. India
- 3.2. China
- 3.3. Japan
- 3.4. Rest of Asia Pacific
-
4. South America
- 4.1. Brazil
- 4.2. Argentina
- 4.3. Rest of South America
-
5. Middle East
- 5.1. United Arab Emirates
- 5.2. Saudi Arabia
- 5.3. Rest of Middle East
Augmented Shopping Market Regional Market Share
Geographic Coverage of Augmented Shopping Market
Augmented Shopping Market REPORT HIGHLIGHTS
| Aspects | Details |
|---|---|
| Study Period | 2020-2034 |
| Base Year | 2025 |
| Estimated Year | 2026 |
| Forecast Period | 2026-2034 |
| Historical Period | 2020-2025 |
| Growth Rate | CAGR of 15.78% from 2020-2034 |
| Segmentation |
|
Table of Contents
- 1. Introduction
- 1.1. Research Scope
- 1.2. Market Segmentation
- 1.3. Research Objective
- 1.4. Definitions and Assumptions
- 2. Executive Summary
- 2.1. Market Snapshot
- 3. Market Dynamics
- 3.1. Market Drivers
- 3.2. Market Restrains
- 3.3. Market Trends
- 3.4. Market Opportunities
- 4. Market Factor Analysis
- 4.1. Porters Five Forces
- 4.1.1. Bargaining Power of Suppliers
- 4.1.2. Bargaining Power of Buyers
- 4.1.3. Threat of New Entrants
- 4.1.4. Threat of Substitutes
- 4.1.5. Competitive Rivalry
- 4.2. PESTEL analysis
- 4.3. BCG Analysis
- 4.3.1. Stars (High Growth, High Market Share)
- 4.3.2. Cash Cows (Low Growth, High Market Share)
- 4.3.3. Question Mark (High Growth, Low Market Share)
- 4.3.4. Dogs (Low Growth, Low Market Share)
- 4.4. Ansoff Matrix Analysis
- 4.5. Supply Chain Analysis
- 4.6. Regulatory Landscape
- 4.7. Current Market Potential and Opportunity Assessment (TAM–SAM–SOM Framework)
- 4.8. MDP Analyst Note
- 4.1. Porters Five Forces
- 5. Market Analysis, Insights and Forecast 2021-2033
- 5.1. Market Analysis, Insights and Forecast - by Component
- 5.1.1. Solutions
- 5.1.2. Services
- 5.2. Market Analysis, Insights and Forecast - by Application
- 5.2.1. Furniture and Lighting
- 5.2.2. Beauty and Cosmetics
- 5.2.3. Apparel Fitting
- 5.2.4. Grocery Shopping
- 5.2.5. Footwear
- 5.2.6. Other Applications
- 5.3. Market Analysis, Insights and Forecast - by Region
- 5.3.1. North America
- 5.3.2. Europe
- 5.3.3. Asia Pacific
- 5.3.4. South America
- 5.3.5. Middle East
- 5.1. Market Analysis, Insights and Forecast - by Component
- 6. Global Augmented Shopping Market Analysis, Insights and Forecast, 2021-2033
- 6.1. Market Analysis, Insights and Forecast - by Component
- 6.1.1. Solutions
- 6.1.2. Services
- 6.2. Market Analysis, Insights and Forecast - by Application
- 6.2.1. Furniture and Lighting
- 6.2.2. Beauty and Cosmetics
- 6.2.3. Apparel Fitting
- 6.2.4. Grocery Shopping
- 6.2.5. Footwear
- 6.2.6. Other Applications
- 6.1. Market Analysis, Insights and Forecast - by Component
- 7. North America Augmented Shopping Market Analysis, Insights and Forecast, 2020-2032
- 7.1. Market Analysis, Insights and Forecast - by Component
- 7.1.1. Solutions
- 7.1.2. Services
- 7.2. Market Analysis, Insights and Forecast - by Application
- 7.2.1. Furniture and Lighting
- 7.2.2. Beauty and Cosmetics
- 7.2.3. Apparel Fitting
- 7.2.4. Grocery Shopping
- 7.2.5. Footwear
- 7.2.6. Other Applications
- 7.1. Market Analysis, Insights and Forecast - by Component
- 8. Europe Augmented Shopping Market Analysis, Insights and Forecast, 2020-2032
- 8.1. Market Analysis, Insights and Forecast - by Component
- 8.1.1. Solutions
- 8.1.2. Services
- 8.2. Market Analysis, Insights and Forecast - by Application
- 8.2.1. Furniture and Lighting
- 8.2.2. Beauty and Cosmetics
- 8.2.3. Apparel Fitting
- 8.2.4. Grocery Shopping
- 8.2.5. Footwear
- 8.2.6. Other Applications
- 8.1. Market Analysis, Insights and Forecast - by Component
- 9. Asia Pacific Augmented Shopping Market Analysis, Insights and Forecast, 2020-2032
- 9.1. Market Analysis, Insights and Forecast - by Component
- 9.1.1. Solutions
- 9.1.2. Services
- 9.2. Market Analysis, Insights and Forecast - by Application
- 9.2.1. Furniture and Lighting
- 9.2.2. Beauty and Cosmetics
- 9.2.3. Apparel Fitting
- 9.2.4. Grocery Shopping
- 9.2.5. Footwear
- 9.2.6. Other Applications
- 9.1. Market Analysis, Insights and Forecast - by Component
- 10. South America Augmented Shopping Market Analysis, Insights and Forecast, 2020-2032
- 10.1. Market Analysis, Insights and Forecast - by Component
- 10.1.1. Solutions
- 10.1.2. Services
- 10.2. Market Analysis, Insights and Forecast - by Application
- 10.2.1. Furniture and Lighting
- 10.2.2. Beauty and Cosmetics
- 10.2.3. Apparel Fitting
- 10.2.4. Grocery Shopping
- 10.2.5. Footwear
- 10.2.6. Other Applications
- 10.1. Market Analysis, Insights and Forecast - by Component
- 11. Middle East Augmented Shopping Market Analysis, Insights and Forecast, 2020-2032
- 11.1. Market Analysis, Insights and Forecast - by Component
- 11.1.1. Solutions
- 11.1.2. Services
- 11.2. Market Analysis, Insights and Forecast - by Application
- 11.2.1. Furniture and Lighting
- 11.2.2. Beauty and Cosmetics
- 11.2.3. Apparel Fitting
- 11.2.4. Grocery Shopping
- 11.2.5. Footwear
- 11.2.6. Other Applications
- 11.1. Market Analysis, Insights and Forecast - by Component
- 12. Competitive Analysis
- 12.1. Company Profiles
- 12.1.1 Magic Leap
- 12.1.1.1. Company Overview
- 12.1.1.2. Products
- 12.1.1.3. Company Financials
- 12.1.1.4. SWOT Analysis
- 12.1.2 Blippar
- 12.1.2.1. Company Overview
- 12.1.2.2. Products
- 12.1.2.3. Company Financials
- 12.1.2.4. SWOT Analysis
- 12.1.3 Groove Jones
- 12.1.3.1. Company Overview
- 12.1.3.2. Products
- 12.1.3.3. Company Financials
- 12.1.3.4. SWOT Analysis
- 12.1.4 IKEA Place
- 12.1.4.1. Company Overview
- 12.1.4.2. Products
- 12.1.4.3. Company Financials
- 12.1.4.4. SWOT Analysis
- 12.1.5 ModiFace
- 12.1.5.1. Company Overview
- 12.1.5.2. Products
- 12.1.5.3. Company Financials
- 12.1.5.4. SWOT Analysis
- 12.1.6 Obsess
- 12.1.6.1. Company Overview
- 12.1.6.2. Products
- 12.1.6.3. Company Financials
- 12.1.6.4. SWOT Analysis
- 12.1.7 HoloLens
- 12.1.7.1. Company Overview
- 12.1.7.2. Products
- 12.1.7.3. Company Financials
- 12.1.7.4. SWOT Analysis
- 12.1.8 Zugara Inc
- 12.1.8.1. Company Overview
- 12.1.8.2. Products
- 12.1.8.3. Company Financials
- 12.1.8.4. SWOT Analysis
- 12.1.9 PTC Vuforia
- 12.1.9.1. Company Overview
- 12.1.9.2. Products
- 12.1.9.3. Company Financials
- 12.1.9.4. SWOT Analysis
- 12.1.10 Apple Inc **List Not Exhaustive
- 12.1.10.1. Company Overview
- 12.1.10.2. Products
- 12.1.10.3. Company Financials
- 12.1.10.4. SWOT Analysis
- 12.1.1 Magic Leap
- 12.2. Market Entropy
- 12.2.1 Company's Key Areas Served
- 12.2.2 Recent Developments
- 12.3. Company Market Share Analysis 2025
- 12.3.1 Top 5 Companies Market Share Analysis
- 12.3.2 Top 3 Companies Market Share Analysis
- 12.4. List of Potential Customers
- 13. Research Methodology
List of Figures
- Figure 1: Global Augmented Shopping Market Revenue Breakdown (Million, %) by Region 2025 & 2033
- Figure 2: Global Augmented Shopping Market Volume Breakdown (Billion, %) by Region 2025 & 2033
- Figure 3: North America Augmented Shopping Market Revenue (Million), by Component 2025 & 2033
- Figure 4: North America Augmented Shopping Market Volume (Billion), by Component 2025 & 2033
- Figure 5: North America Augmented Shopping Market Revenue Share (%), by Component 2025 & 2033
- Figure 6: North America Augmented Shopping Market Volume Share (%), by Component 2025 & 2033
- Figure 7: North America Augmented Shopping Market Revenue (Million), by Application 2025 & 2033
- Figure 8: North America Augmented Shopping Market Volume (Billion), by Application 2025 & 2033
- Figure 9: North America Augmented Shopping Market Revenue Share (%), by Application 2025 & 2033
- Figure 10: North America Augmented Shopping Market Volume Share (%), by Application 2025 & 2033
- Figure 11: North America Augmented Shopping Market Revenue (Million), by Country 2025 & 2033
- Figure 12: North America Augmented Shopping Market Volume (Billion), by Country 2025 & 2033
- Figure 13: North America Augmented Shopping Market Revenue Share (%), by Country 2025 & 2033
- Figure 14: North America Augmented Shopping Market Volume Share (%), by Country 2025 & 2033
- Figure 15: Europe Augmented Shopping Market Revenue (Million), by Component 2025 & 2033
- Figure 16: Europe Augmented Shopping Market Volume (Billion), by Component 2025 & 2033
- Figure 17: Europe Augmented Shopping Market Revenue Share (%), by Component 2025 & 2033
- Figure 18: Europe Augmented Shopping Market Volume Share (%), by Component 2025 & 2033
- Figure 19: Europe Augmented Shopping Market Revenue (Million), by Application 2025 & 2033
- Figure 20: Europe Augmented Shopping Market Volume (Billion), by Application 2025 & 2033
- Figure 21: Europe Augmented Shopping Market Revenue Share (%), by Application 2025 & 2033
- Figure 22: Europe Augmented Shopping Market Volume Share (%), by Application 2025 & 2033
- Figure 23: Europe Augmented Shopping Market Revenue (Million), by Country 2025 & 2033
- Figure 24: Europe Augmented Shopping Market Volume (Billion), by Country 2025 & 2033
- Figure 25: Europe Augmented Shopping Market Revenue Share (%), by Country 2025 & 2033
- Figure 26: Europe Augmented Shopping Market Volume Share (%), by Country 2025 & 2033
- Figure 27: Asia Pacific Augmented Shopping Market Revenue (Million), by Component 2025 & 2033
- Figure 28: Asia Pacific Augmented Shopping Market Volume (Billion), by Component 2025 & 2033
- Figure 29: Asia Pacific Augmented Shopping Market Revenue Share (%), by Component 2025 & 2033
- Figure 30: Asia Pacific Augmented Shopping Market Volume Share (%), by Component 2025 & 2033
- Figure 31: Asia Pacific Augmented Shopping Market Revenue (Million), by Application 2025 & 2033
- Figure 32: Asia Pacific Augmented Shopping Market Volume (Billion), by Application 2025 & 2033
- Figure 33: Asia Pacific Augmented Shopping Market Revenue Share (%), by Application 2025 & 2033
- Figure 34: Asia Pacific Augmented Shopping Market Volume Share (%), by Application 2025 & 2033
- Figure 35: Asia Pacific Augmented Shopping Market Revenue (Million), by Country 2025 & 2033
- Figure 36: Asia Pacific Augmented Shopping Market Volume (Billion), by Country 2025 & 2033
- Figure 37: Asia Pacific Augmented Shopping Market Revenue Share (%), by Country 2025 & 2033
- Figure 38: Asia Pacific Augmented Shopping Market Volume Share (%), by Country 2025 & 2033
- Figure 39: South America Augmented Shopping Market Revenue (Million), by Component 2025 & 2033
- Figure 40: South America Augmented Shopping Market Volume (Billion), by Component 2025 & 2033
- Figure 41: South America Augmented Shopping Market Revenue Share (%), by Component 2025 & 2033
- Figure 42: South America Augmented Shopping Market Volume Share (%), by Component 2025 & 2033
- Figure 43: South America Augmented Shopping Market Revenue (Million), by Application 2025 & 2033
- Figure 44: South America Augmented Shopping Market Volume (Billion), by Application 2025 & 2033
- Figure 45: South America Augmented Shopping Market Revenue Share (%), by Application 2025 & 2033
- Figure 46: South America Augmented Shopping Market Volume Share (%), by Application 2025 & 2033
- Figure 47: South America Augmented Shopping Market Revenue (Million), by Country 2025 & 2033
- Figure 48: South America Augmented Shopping Market Volume (Billion), by Country 2025 & 2033
- Figure 49: South America Augmented Shopping Market Revenue Share (%), by Country 2025 & 2033
- Figure 50: South America Augmented Shopping Market Volume Share (%), by Country 2025 & 2033
- Figure 51: Middle East Augmented Shopping Market Revenue (Million), by Component 2025 & 2033
- Figure 52: Middle East Augmented Shopping Market Volume (Billion), by Component 2025 & 2033
- Figure 53: Middle East Augmented Shopping Market Revenue Share (%), by Component 2025 & 2033
- Figure 54: Middle East Augmented Shopping Market Volume Share (%), by Component 2025 & 2033
- Figure 55: Middle East Augmented Shopping Market Revenue (Million), by Application 2025 & 2033
- Figure 56: Middle East Augmented Shopping Market Volume (Billion), by Application 2025 & 2033
- Figure 57: Middle East Augmented Shopping Market Revenue Share (%), by Application 2025 & 2033
- Figure 58: Middle East Augmented Shopping Market Volume Share (%), by Application 2025 & 2033
- Figure 59: Middle East Augmented Shopping Market Revenue (Million), by Country 2025 & 2033
- Figure 60: Middle East Augmented Shopping Market Volume (Billion), by Country 2025 & 2033
- Figure 61: Middle East Augmented Shopping Market Revenue Share (%), by Country 2025 & 2033
- Figure 62: Middle East Augmented Shopping Market Volume Share (%), by Country 2025 & 2033
List of Tables
- Table 1: Global Augmented Shopping Market Revenue Million Forecast, by Component 2020 & 2033
- Table 2: Global Augmented Shopping Market Volume Billion Forecast, by Component 2020 & 2033
- Table 3: Global Augmented Shopping Market Revenue Million Forecast, by Application 2020 & 2033
- Table 4: Global Augmented Shopping Market Volume Billion Forecast, by Application 2020 & 2033
- Table 5: Global Augmented Shopping Market Revenue Million Forecast, by Region 2020 & 2033
- Table 6: Global Augmented Shopping Market Volume Billion Forecast, by Region 2020 & 2033
- Table 7: Global Augmented Shopping Market Revenue Million Forecast, by Component 2020 & 2033
- Table 8: Global Augmented Shopping Market Volume Billion Forecast, by Component 2020 & 2033
- Table 9: Global Augmented Shopping Market Revenue Million Forecast, by Application 2020 & 2033
- Table 10: Global Augmented Shopping Market Volume Billion Forecast, by Application 2020 & 2033
- Table 11: Global Augmented Shopping Market Revenue Million Forecast, by Country 2020 & 2033
- Table 12: Global Augmented Shopping Market Volume Billion Forecast, by Country 2020 & 2033
- Table 13: United States Augmented Shopping Market Revenue (Million) Forecast, by Application 2020 & 2033
- Table 14: United States Augmented Shopping Market Volume (Billion) Forecast, by Application 2020 & 2033
- Table 15: Canada Augmented Shopping Market Revenue (Million) Forecast, by Application 2020 & 2033
- Table 16: Canada Augmented Shopping Market Volume (Billion) Forecast, by Application 2020 & 2033
- Table 17: Rest of North America Augmented Shopping Market Revenue (Million) Forecast, by Application 2020 & 2033
- Table 18: Rest of North America Augmented Shopping Market Volume (Billion) Forecast, by Application 2020 & 2033
- Table 19: Global Augmented Shopping Market Revenue Million Forecast, by Component 2020 & 2033
- Table 20: Global Augmented Shopping Market Volume Billion Forecast, by Component 2020 & 2033
- Table 21: Global Augmented Shopping Market Revenue Million Forecast, by Application 2020 & 2033
- Table 22: Global Augmented Shopping Market Volume Billion Forecast, by Application 2020 & 2033
- Table 23: Global Augmented Shopping Market Revenue Million Forecast, by Country 2020 & 2033
- Table 24: Global Augmented Shopping Market Volume Billion Forecast, by Country 2020 & 2033
- Table 25: Germany Augmented Shopping Market Revenue (Million) Forecast, by Application 2020 & 2033
- Table 26: Germany Augmented Shopping Market Volume (Billion) Forecast, by Application 2020 & 2033
- Table 27: United Kingdom Augmented Shopping Market Revenue (Million) Forecast, by Application 2020 & 2033
- Table 28: United Kingdom Augmented Shopping Market Volume (Billion) Forecast, by Application 2020 & 2033
- Table 29: France Augmented Shopping Market Revenue (Million) Forecast, by Application 2020 & 2033
- Table 30: France Augmented Shopping Market Volume (Billion) Forecast, by Application 2020 & 2033
- Table 31: Russia Augmented Shopping Market Revenue (Million) Forecast, by Application 2020 & 2033
- Table 32: Russia Augmented Shopping Market Volume (Billion) Forecast, by Application 2020 & 2033
- Table 33: Spain Augmented Shopping Market Revenue (Million) Forecast, by Application 2020 & 2033
- Table 34: Spain Augmented Shopping Market Volume (Billion) Forecast, by Application 2020 & 2033
- Table 35: Rest of Europe Augmented Shopping Market Revenue (Million) Forecast, by Application 2020 & 2033
- Table 36: Rest of Europe Augmented Shopping Market Volume (Billion) Forecast, by Application 2020 & 2033
- Table 37: Global Augmented Shopping Market Revenue Million Forecast, by Component 2020 & 2033
- Table 38: Global Augmented Shopping Market Volume Billion Forecast, by Component 2020 & 2033
- Table 39: Global Augmented Shopping Market Revenue Million Forecast, by Application 2020 & 2033
- Table 40: Global Augmented Shopping Market Volume Billion Forecast, by Application 2020 & 2033
- Table 41: Global Augmented Shopping Market Revenue Million Forecast, by Country 2020 & 2033
- Table 42: Global Augmented Shopping Market Volume Billion Forecast, by Country 2020 & 2033
- Table 43: India Augmented Shopping Market Revenue (Million) Forecast, by Application 2020 & 2033
- Table 44: India Augmented Shopping Market Volume (Billion) Forecast, by Application 2020 & 2033
- Table 45: China Augmented Shopping Market Revenue (Million) Forecast, by Application 2020 & 2033
- Table 46: China Augmented Shopping Market Volume (Billion) Forecast, by Application 2020 & 2033
- Table 47: Japan Augmented Shopping Market Revenue (Million) Forecast, by Application 2020 & 2033
- Table 48: Japan Augmented Shopping Market Volume (Billion) Forecast, by Application 2020 & 2033
- Table 49: Rest of Asia Pacific Augmented Shopping Market Revenue (Million) Forecast, by Application 2020 & 2033
- Table 50: Rest of Asia Pacific Augmented Shopping Market Volume (Billion) Forecast, by Application 2020 & 2033
- Table 51: Global Augmented Shopping Market Revenue Million Forecast, by Component 2020 & 2033
- Table 52: Global Augmented Shopping Market Volume Billion Forecast, by Component 2020 & 2033
- Table 53: Global Augmented Shopping Market Revenue Million Forecast, by Application 2020 & 2033
- Table 54: Global Augmented Shopping Market Volume Billion Forecast, by Application 2020 & 2033
- Table 55: Global Augmented Shopping Market Revenue Million Forecast, by Country 2020 & 2033
- Table 56: Global Augmented Shopping Market Volume Billion Forecast, by Country 2020 & 2033
- Table 57: Brazil Augmented Shopping Market Revenue (Million) Forecast, by Application 2020 & 2033
- Table 58: Brazil Augmented Shopping Market Volume (Billion) Forecast, by Application 2020 & 2033
- Table 59: Argentina Augmented Shopping Market Revenue (Million) Forecast, by Application 2020 & 2033
- Table 60: Argentina Augmented Shopping Market Volume (Billion) Forecast, by Application 2020 & 2033
- Table 61: Rest of South America Augmented Shopping Market Revenue (Million) Forecast, by Application 2020 & 2033
- Table 62: Rest of South America Augmented Shopping Market Volume (Billion) Forecast, by Application 2020 & 2033
- Table 63: Global Augmented Shopping Market Revenue Million Forecast, by Component 2020 & 2033
- Table 64: Global Augmented Shopping Market Volume Billion Forecast, by Component 2020 & 2033
- Table 65: Global Augmented Shopping Market Revenue Million Forecast, by Application 2020 & 2033
- Table 66: Global Augmented Shopping Market Volume Billion Forecast, by Application 2020 & 2033
- Table 67: Global Augmented Shopping Market Revenue Million Forecast, by Country 2020 & 2033
- Table 68: Global Augmented Shopping Market Volume Billion Forecast, by Country 2020 & 2033
- Table 69: United Arab Emirates Augmented Shopping Market Revenue (Million) Forecast, by Application 2020 & 2033
- Table 70: United Arab Emirates Augmented Shopping Market Volume (Billion) Forecast, by Application 2020 & 2033
- Table 71: Saudi Arabia Augmented Shopping Market Revenue (Million) Forecast, by Application 2020 & 2033
- Table 72: Saudi Arabia Augmented Shopping Market Volume (Billion) Forecast, by Application 2020 & 2033
- Table 73: Rest of Middle East Augmented Shopping Market Revenue (Million) Forecast, by Application 2020 & 2033
- Table 74: Rest of Middle East Augmented Shopping Market Volume (Billion) Forecast, by Application 2020 & 2033
Frequently Asked Questions
1. What is the projected Compound Annual Growth Rate (CAGR) of the Augmented Shopping Market?
The projected CAGR is approximately 15.78%.
2. Which companies are prominent players in the Augmented Shopping Market?
Key companies in the market include Magic Leap, Blippar, Groove Jones, IKEA Place, ModiFace, Obsess, HoloLens, Zugara Inc, PTC Vuforia, Apple Inc **List Not Exhaustive.
3. What are the main segments of the Augmented Shopping Market?
The market segments include Component , Application.
4. Can you provide details about the market size?
The market size is estimated to be USD 15.52 Million as of 2022.
5. What are some drivers contributing to market growth?
The Growing Number of Smartphone and Tablets is Driving the Market; Technological Advancements is Driving the Market.
6. What are the notable trends driving market growth?
Growing Demand for Furniture and Lighting in Asia-Pacific.
7. Are there any restraints impacting market growth?
The Growing Number of Smartphone and Tablets is Driving the Market; Technological Advancements is Driving the Market.
8. Can you provide examples of recent developments in the market?
May 2024: Alphabet Inc.'s Google and the augmented reality startup Magic Leap Inc. revealed a strategic partnership. The collaboration aims to focus on developing augmented reality (AR) and optical solutions.August 2023: In collaboration with Dufry, Blackjack Promotions, a UK travel retail and brand experience provider, introduced its first immersive augmented reality campaign targeted at families.
9. What pricing options are available for accessing the report?
Pricing options include single-user, multi-user, and enterprise licenses priced at USD 4750, USD 5250, and USD 8750 respectively.
10. Is the market size provided in terms of value or volume?
The market size is provided in terms of value, measured in Million and volume, measured in Billion.
11. Are there any specific market keywords associated with the report?
Yes, the market keyword associated with the report is "Augmented Shopping Market," which aids in identifying and referencing the specific market segment covered.
12. How do I determine which pricing option suits my needs best?
The pricing options vary based on user requirements and access needs. Individual users may opt for single-user licenses, while businesses requiring broader access may choose multi-user or enterprise licenses for cost-effective access to the report.
13. Are there any additional resources or data provided in the Augmented Shopping Market report?
While the report offers comprehensive insights, it's advisable to review the specific contents or supplementary materials provided to ascertain if additional resources or data are available.
14. How can I stay updated on further developments or reports in the Augmented Shopping Market?
To stay informed about further developments, trends, and reports in the Augmented Shopping Market, consider subscribing to industry newsletters, following relevant companies and organizations, or regularly checking reputable industry news sources and publications.
Methodology
Step 1 - Identification of Relevant Samples Size from Population Database


Step 2 - Approaches for Defining Global Market Size (Value, Volume* & Price*)

Note*: In applicable scenarios
Step 3 - Data Sources
Primary Research
- Web Analytics
- Survey Reports
- Research Institute
- Latest Research Reports
- Opinion Leaders
Secondary Research
- Annual Reports
- White Paper
- Latest Press Release
- Industry Association
- Paid Database
- Investor Presentations

Step 4 - Data Triangulation
Involves using different sources of information in order to increase the validity of a study
These sources are likely to be stakeholders in a program - participants, other researchers, program staff, other community members, and so on.
Then we put all data in single framework & apply various statistical tools to find out the dynamic on the market.
During the analysis stage, feedback from the stakeholder groups would be compared to determine areas of agreement as well as areas of divergence