

Key Insights
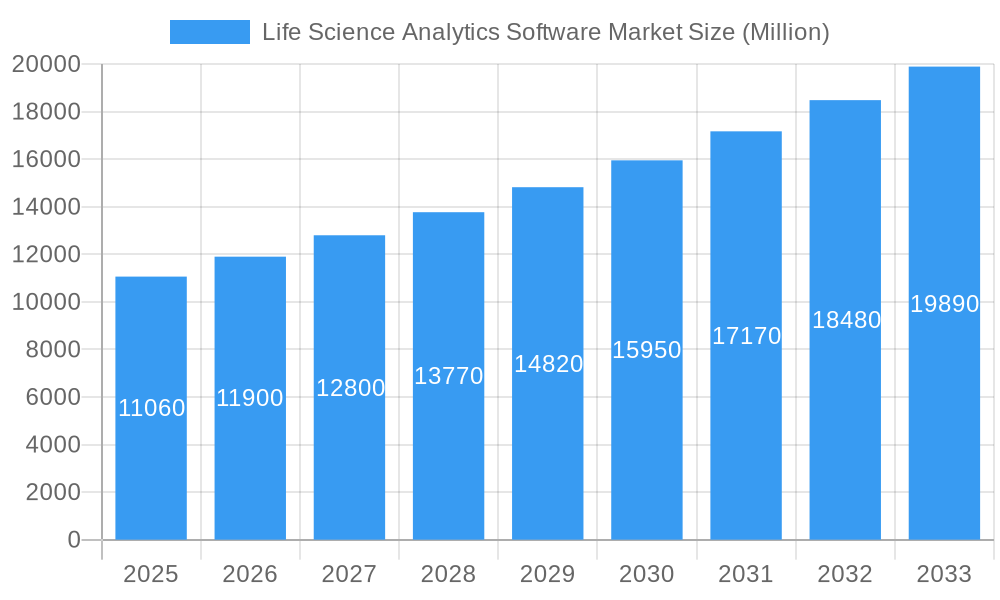
The Life Science Analytics Software market, valued at $11.06 billion in 2025, is projected to experience robust growth, exhibiting a Compound Annual Growth Rate (CAGR) of 7.71% from 2025 to 2033. This expansion is driven by several key factors. The increasing volume of biological data generated through genomics, proteomics, and clinical trials necessitates sophisticated analytical tools for effective processing and interpretation. Furthermore, the rising adoption of cloud-based solutions and advanced analytics techniques, such as machine learning and artificial intelligence (AI), is fueling market growth. Pharmaceutical and biotechnology companies are increasingly leveraging these technologies to accelerate drug discovery, personalize medicine, improve clinical trial efficiency, and optimize supply chains, leading to higher market demand. The market is segmented by product type (descriptive, predictive, and prescriptive analytics), application (research and development, supply chain, sales & marketing), component (software and services), and end-user (clinical research institutions, pharmaceutical and biotechnology companies, and medical device companies). North America currently holds a significant market share, owing to the presence of major players and robust research infrastructure. However, the Asia-Pacific region is expected to witness substantial growth in the coming years, driven by increasing investments in healthcare infrastructure and technological advancements.
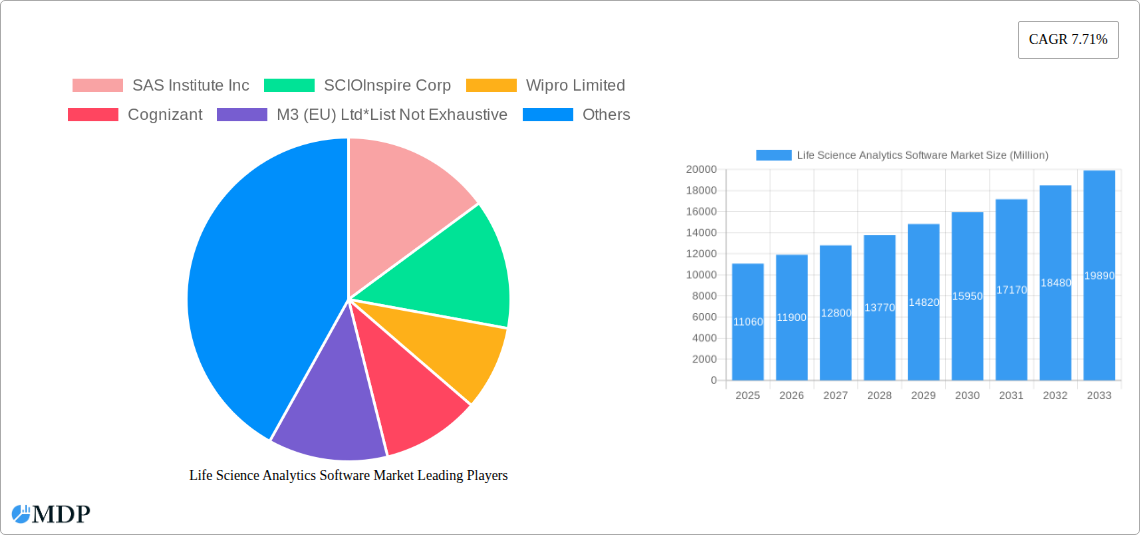
Life Science Analytics Software Market Market Size (In Billion)
The competitive landscape is characterized by a mix of established players like SAS Institute, IBM, and Oracle, alongside specialized life science analytics providers and IT services companies such as Cognizant and Wipro. The market's growth trajectory is influenced by factors such as stringent regulatory requirements for data privacy and security, the need for skilled professionals to manage and interpret complex data sets, and the potential for high initial investment costs in implementing sophisticated analytics solutions. However, the long-term benefits of improved efficiency, reduced development costs, and enhanced decision-making outweigh these challenges, ensuring sustained market growth throughout the forecast period. The continuous evolution of analytical techniques and the integration of emerging technologies will further shape the market's future, promising innovative solutions to address complex challenges in the life sciences sector.
Life Science Analytics Software Market Company Market Share
Life Science Analytics Software Market Report: 2019-2033
This comprehensive report provides an in-depth analysis of the Life Science Analytics Software Market, offering invaluable insights for stakeholders across the pharmaceutical, biotechnology, and medical device industries. With a study period spanning 2019-2033, a base year of 2025, and a forecast period of 2025-2033, this report leverages historical data (2019-2024) to project future market trends and growth opportunities. The report covers key segments, leading players, and emerging trends, providing actionable intelligence to inform strategic decision-making. The market size is projected to reach xx Million by 2033, exhibiting a robust CAGR of xx% during the forecast period.
Life Science Analytics Software Market Dynamics & Concentration
The Life Science Analytics Software market is characterized by a dynamic interplay of factors influencing its growth and concentration. Market concentration is currently [Describe Market Concentration - e.g., moderately concentrated, with a few major players holding significant market share, while numerous smaller players compete in niche segments]. The market is driven by increasing adoption of advanced analytics, regulatory pressures for data-driven decision-making, and a surge in R&D activities within the life sciences sector. Product substitutes, such as traditional statistical methods, pose a limited threat, as the superior analytical capabilities of dedicated software increasingly outweigh their cost advantages. End-user trends favor the adoption of cloud-based solutions and AI-powered analytics.
- Market Share: Top 5 players hold approximately xx% of the market share in 2025.
- M&A Activity: An average of xx M&A deals have been recorded annually during the historical period (2019-2024), primarily driven by strategies to expand product portfolios and technological capabilities.
- Innovation Drivers: The demand for improved efficiency in clinical trials, drug discovery, and supply chain management is driving innovation in predictive and prescriptive analytics.
- Regulatory Frameworks: Stringent regulatory compliance requirements within the life sciences industry propel the adoption of software ensuring data integrity and traceability, driving market growth.
Life Science Analytics Software Market Industry Trends & Analysis
The Life Science Analytics Software market exhibits robust growth, fueled by several key trends. The increasing volume and complexity of data generated across the life sciences value chain necessitate advanced analytical capabilities. The integration of AI and machine learning into these software solutions accelerates the process of drug discovery, clinical trial optimization, and personalized medicine. This is further complemented by rising investments in R&D and the adoption of cloud-based solutions that offer scalability and cost-effectiveness. Growing demand for real-world evidence (RWE) integration also contributes to market growth. Competitive dynamics are marked by both innovation and strategic partnerships to address the specific needs of different segments within the life sciences industry. The market exhibits a significant penetration rate in developed regions, but growth opportunities exist in emerging markets. The market's CAGR is projected to remain consistently strong throughout the forecast period.
Leading Markets & Segments in Life Science Analytics Software Market
The North American region currently dominates the Life Science Analytics Software Market, driven by high R&D investments, stringent regulatory compliance, and early adoption of advanced technologies. Within the market segments, the demand for predictive analytics is significantly high due to the need for proactive decision-making in drug discovery and clinical trials. The pharmaceutical and biotechnology companies constitute the largest end-user segment.
Dominant Region: North America
Leading Segments:
- Product Type: Predictive Analytics (highest market share in 2025)
- Application: Research and Development (highest growth rate in 2025-2033)
- End User: Pharmaceutical and Biotechnology Companies
Key Drivers for North American Dominance: Robust funding for healthcare research, strong regulatory frameworks driving data compliance, and a high concentration of major life science companies.
Key Drivers for Predictive Analytics Dominance: Ability to predict clinical trial outcomes, identify potential drug targets more efficiently, and optimize supply chain management.
Key Drivers for R&D Application Dominance: The critical role of analytics in accelerating drug discovery and development processes.
Key Drivers for Pharmaceutical & Biotechnology Dominance: The high volume of data generated within these organizations and the critical need to glean insights from this data for commercial success.
Life Science Analytics Software Market Product Developments
Recent product developments emphasize integration of AI/ML capabilities, enhanced visualization tools, and cloud-based deployment models. These innovations streamline data analysis, improve decision-making, and cater to the evolving needs of life science organizations. The focus is on providing tailored solutions for specific applications, such as clinical trial optimization and personalized medicine. The competitive landscape is dynamic, with ongoing improvements in analytical algorithms, user interfaces, and data integration capabilities. This is leading to more user-friendly, efficient, and effective software solutions.
Key Drivers of Life Science Analytics Software Market Growth
Several factors drive the growth of this market. Technological advancements in AI and ML significantly improve the speed and accuracy of data analysis, enabling better decision-making. Increasing government funding for research and development fuels market expansion. Stringent regulatory compliance standards necessitate the use of sophisticated analytical tools. The escalating volume of healthcare data, coupled with the imperative for data-driven decision-making, also contributes strongly to market growth.
Challenges in the Life Science Analytics Software Market
Despite the growth potential, the market faces challenges including the high cost of software implementation and maintenance. Data privacy and security concerns are paramount, necessitating robust security measures. The complexity of integrating diverse data sources across different systems can be a significant hurdle. Furthermore, the competitive landscape presents challenges for smaller companies trying to secure market share. The industry faces a shortage of skilled professionals capable of harnessing these sophisticated technologies. This adds to the overall costs and implementation difficulties.
Emerging Opportunities in Life Science Analytics Software Market
The convergence of technologies like AI, Big Data, and cloud computing presents exciting opportunities for innovation. Strategic partnerships between software providers and life science companies are generating unique solutions that better address specific industry requirements. Expansion into emerging markets with growing healthcare infrastructure and a rising demand for advanced analytics will drive substantial future growth. The increasing emphasis on personalized medicine will also greatly increase demand for life science analytics software.
Leading Players in the Life Science Analytics Software Market Sector
- SAS Institute Inc
- SCIOInspire Corp
- Wipro Limited
- Cognizant
- M3 (EU) Ltd
- IBM Corporation
- TAKE Solutions Limited
- Accenture
- IQVIA
- Oracle Corporation
- MaxisIT Inc
- Dynata
Key Milestones in Life Science Analytics Software Market Industry
- July 2022: Charles River Associates launched the Healthcare Claims Analytics Platform (HCAP), leveraging machine learning and patient analytics to improve market understanding and decision-making. This launch signals a growing trend towards integrating advanced analytics into healthcare claims data.
- March 2022: Databricks introduced the Databricks Lakehouse for Healthcare and Life Sciences, a unified platform for data management and AI-powered analytics, impacting disease prediction, medical image classification, and biomarker discovery. This consolidated platform streamlines data processing and analytical capabilities within the life sciences industry.
Strategic Outlook for Life Science Analytics Software Market Market
The Life Science Analytics Software market is poised for significant growth, driven by continued technological advancements, escalating data volumes, and the increasing importance of data-driven decision-making in the life sciences sector. Strategic partnerships and the development of innovative applications catering to niche segments will be crucial in maximizing market penetration and capturing value creation. The market's future success hinges on adapting to evolving regulatory landscapes and addressing data privacy and security concerns. Focusing on user-friendliness and ease of integration with existing systems will be key to expanding market adoption.
Life Science Analytics Software Market Segmentation
-
1. Product Type
- 1.1. Descriptive Analytics
- 1.2. Predictive Analytics
- 1.3. Prescriptive Analytics
-
2. Application
- 2.1. Research and Development
- 2.2. Supply Chain Analytics
- 2.3. Sales and Marketing
- 2.4. Other Applications
-
3. Component
- 3.1. Services
- 3.2. Software
-
4. End User
- 4.1. Clinical Research Institutions
- 4.2. Pharmaceutical and Biotechnology Companies
- 4.3. Medical Device Companies
- 4.4. Other End Users
Life Science Analytics Software Market Segmentation By Geography
-
1. North America
- 1.1. United States
- 1.2. Canada
- 1.3. Mexico
-
2. Europe
- 2.1. Germany
- 2.2. United Kingdom
- 2.3. France
- 2.4. Italy
- 2.5. Spain
- 2.6. Rest of Europe
-
3. Asia Pacific
- 3.1. China
- 3.2. Japan
- 3.3. India
- 3.4. Australia
- 3.5. South Korea
- 3.6. Rest of Asia Pacific
-
4. Middle East and Africa
- 4.1. GCC
- 4.2. South Africa
- 4.3. Rest of Middle East and Africa
-
5. South America
- 5.1. Brazil
- 5.2. Argentina
- 5.3. Rest of South America
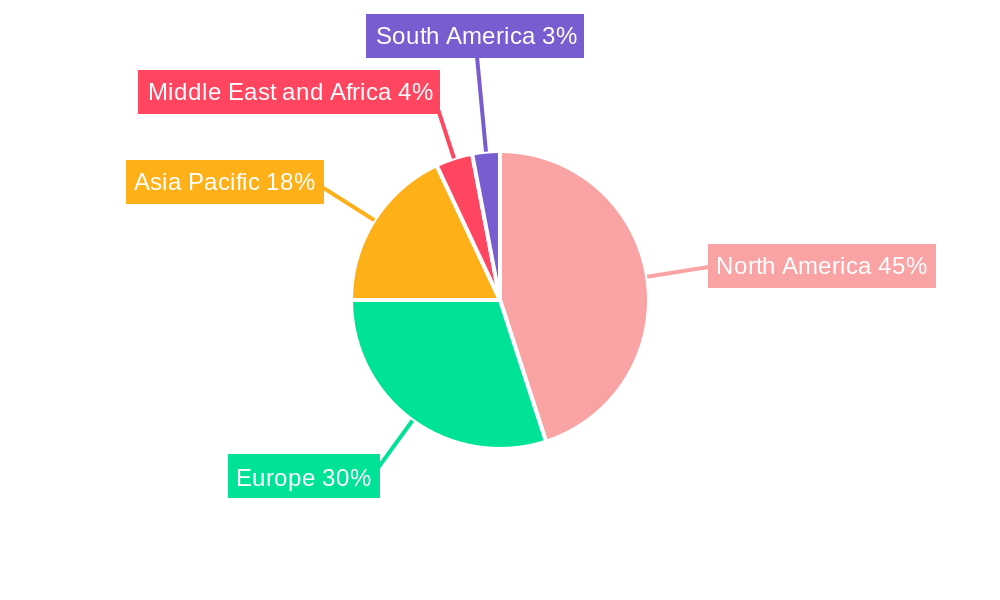
Life Science Analytics Software Market Regional Market Share
Geographic Coverage of Life Science Analytics Software Market
Life Science Analytics Software Market REPORT HIGHLIGHTS
| Aspects | Details |
|---|---|
| Study Period | 2020-2034 |
| Base Year | 2025 |
| Estimated Year | 2026 |
| Forecast Period | 2026-2034 |
| Historical Period | 2020-2025 |
| Growth Rate | CAGR of 7.71% from 2020-2034 |
| Segmentation |
|
Table of Contents
- 1. Introduction
- 1.1. Research Scope
- 1.2. Market Segmentation
- 1.3. Research Objective
- 1.4. Definitions and Assumptions
- 2. Executive Summary
- 2.1. Market Snapshot
- 3. Market Dynamics
- 3.1. Market Drivers
- 3.2. Market Restrains
- 3.3. Market Trends
- 3.4. Market Opportunities
- 4. Market Factor Analysis
- 4.1. Porters Five Forces
- 4.1.1. Bargaining Power of Suppliers
- 4.1.2. Bargaining Power of Buyers
- 4.1.3. Threat of New Entrants
- 4.1.4. Threat of Substitutes
- 4.1.5. Competitive Rivalry
- 4.2. PESTEL analysis
- 4.3. BCG Analysis
- 4.3.1. Stars (High Growth, High Market Share)
- 4.3.2. Cash Cows (Low Growth, High Market Share)
- 4.3.3. Question Mark (High Growth, Low Market Share)
- 4.3.4. Dogs (Low Growth, Low Market Share)
- 4.4. Ansoff Matrix Analysis
- 4.5. Supply Chain Analysis
- 4.6. Regulatory Landscape
- 4.7. Current Market Potential and Opportunity Assessment (TAM–SAM–SOM Framework)
- 4.8. MDP Analyst Note
- 4.1. Porters Five Forces
- 5. Market Analysis, Insights and Forecast 2021-2033
- 5.1. Market Analysis, Insights and Forecast - by Product Type
- 5.1.1. Descriptive Analytics
- 5.1.2. Predictive Analytics
- 5.1.3. Prescriptive Analytics
- 5.2. Market Analysis, Insights and Forecast - by Application
- 5.2.1. Research and Development
- 5.2.2. Supply Chain Analytics
- 5.2.3. Sales and Marketing
- 5.2.4. Other Applications
- 5.3. Market Analysis, Insights and Forecast - by Component
- 5.3.1. Services
- 5.3.2. Software
- 5.4. Market Analysis, Insights and Forecast - by End User
- 5.4.1. Clinical Research Institutions
- 5.4.2. Pharmaceutical and Biotechnology Companies
- 5.4.3. Medical Device Companies
- 5.4.4. Other End Users
- 5.5. Market Analysis, Insights and Forecast - by Region
- 5.5.1. North America
- 5.5.2. Europe
- 5.5.3. Asia Pacific
- 5.5.4. Middle East and Africa
- 5.5.5. South America
- 5.1. Market Analysis, Insights and Forecast - by Product Type
- 6. Global Life Science Analytics Software Market Analysis, Insights and Forecast, 2021-2033
- 6.1. Market Analysis, Insights and Forecast - by Product Type
- 6.1.1. Descriptive Analytics
- 6.1.2. Predictive Analytics
- 6.1.3. Prescriptive Analytics
- 6.2. Market Analysis, Insights and Forecast - by Application
- 6.2.1. Research and Development
- 6.2.2. Supply Chain Analytics
- 6.2.3. Sales and Marketing
- 6.2.4. Other Applications
- 6.3. Market Analysis, Insights and Forecast - by Component
- 6.3.1. Services
- 6.3.2. Software
- 6.4. Market Analysis, Insights and Forecast - by End User
- 6.4.1. Clinical Research Institutions
- 6.4.2. Pharmaceutical and Biotechnology Companies
- 6.4.3. Medical Device Companies
- 6.4.4. Other End Users
- 6.1. Market Analysis, Insights and Forecast - by Product Type
- 7. North America Life Science Analytics Software Market Analysis, Insights and Forecast, 2020-2032
- 7.1. Market Analysis, Insights and Forecast - by Product Type
- 7.1.1. Descriptive Analytics
- 7.1.2. Predictive Analytics
- 7.1.3. Prescriptive Analytics
- 7.2. Market Analysis, Insights and Forecast - by Application
- 7.2.1. Research and Development
- 7.2.2. Supply Chain Analytics
- 7.2.3. Sales and Marketing
- 7.2.4. Other Applications
- 7.3. Market Analysis, Insights and Forecast - by Component
- 7.3.1. Services
- 7.3.2. Software
- 7.4. Market Analysis, Insights and Forecast - by End User
- 7.4.1. Clinical Research Institutions
- 7.4.2. Pharmaceutical and Biotechnology Companies
- 7.4.3. Medical Device Companies
- 7.4.4. Other End Users
- 7.1. Market Analysis, Insights and Forecast - by Product Type
- 8. Europe Life Science Analytics Software Market Analysis, Insights and Forecast, 2020-2032
- 8.1. Market Analysis, Insights and Forecast - by Product Type
- 8.1.1. Descriptive Analytics
- 8.1.2. Predictive Analytics
- 8.1.3. Prescriptive Analytics
- 8.2. Market Analysis, Insights and Forecast - by Application
- 8.2.1. Research and Development
- 8.2.2. Supply Chain Analytics
- 8.2.3. Sales and Marketing
- 8.2.4. Other Applications
- 8.3. Market Analysis, Insights and Forecast - by Component
- 8.3.1. Services
- 8.3.2. Software
- 8.4. Market Analysis, Insights and Forecast - by End User
- 8.4.1. Clinical Research Institutions
- 8.4.2. Pharmaceutical and Biotechnology Companies
- 8.4.3. Medical Device Companies
- 8.4.4. Other End Users
- 8.1. Market Analysis, Insights and Forecast - by Product Type
- 9. Asia Pacific Life Science Analytics Software Market Analysis, Insights and Forecast, 2020-2032
- 9.1. Market Analysis, Insights and Forecast - by Product Type
- 9.1.1. Descriptive Analytics
- 9.1.2. Predictive Analytics
- 9.1.3. Prescriptive Analytics
- 9.2. Market Analysis, Insights and Forecast - by Application
- 9.2.1. Research and Development
- 9.2.2. Supply Chain Analytics
- 9.2.3. Sales and Marketing
- 9.2.4. Other Applications
- 9.3. Market Analysis, Insights and Forecast - by Component
- 9.3.1. Services
- 9.3.2. Software
- 9.4. Market Analysis, Insights and Forecast - by End User
- 9.4.1. Clinical Research Institutions
- 9.4.2. Pharmaceutical and Biotechnology Companies
- 9.4.3. Medical Device Companies
- 9.4.4. Other End Users
- 9.1. Market Analysis, Insights and Forecast - by Product Type
- 10. Middle East and Africa Life Science Analytics Software Market Analysis, Insights and Forecast, 2020-2032
- 10.1. Market Analysis, Insights and Forecast - by Product Type
- 10.1.1. Descriptive Analytics
- 10.1.2. Predictive Analytics
- 10.1.3. Prescriptive Analytics
- 10.2. Market Analysis, Insights and Forecast - by Application
- 10.2.1. Research and Development
- 10.2.2. Supply Chain Analytics
- 10.2.3. Sales and Marketing
- 10.2.4. Other Applications
- 10.3. Market Analysis, Insights and Forecast - by Component
- 10.3.1. Services
- 10.3.2. Software
- 10.4. Market Analysis, Insights and Forecast - by End User
- 10.4.1. Clinical Research Institutions
- 10.4.2. Pharmaceutical and Biotechnology Companies
- 10.4.3. Medical Device Companies
- 10.4.4. Other End Users
- 10.1. Market Analysis, Insights and Forecast - by Product Type
- 11. South America Life Science Analytics Software Market Analysis, Insights and Forecast, 2020-2032
- 11.1. Market Analysis, Insights and Forecast - by Product Type
- 11.1.1. Descriptive Analytics
- 11.1.2. Predictive Analytics
- 11.1.3. Prescriptive Analytics
- 11.2. Market Analysis, Insights and Forecast - by Application
- 11.2.1. Research and Development
- 11.2.2. Supply Chain Analytics
- 11.2.3. Sales and Marketing
- 11.2.4. Other Applications
- 11.3. Market Analysis, Insights and Forecast - by Component
- 11.3.1. Services
- 11.3.2. Software
- 11.4. Market Analysis, Insights and Forecast - by End User
- 11.4.1. Clinical Research Institutions
- 11.4.2. Pharmaceutical and Biotechnology Companies
- 11.4.3. Medical Device Companies
- 11.4.4. Other End Users
- 11.1. Market Analysis, Insights and Forecast - by Product Type
- 12. Competitive Analysis
- 12.1. Company Profiles
- 12.1.1 SAS Institute Inc
- 12.1.1.1. Company Overview
- 12.1.1.2. Products
- 12.1.1.3. Company Financials
- 12.1.1.4. SWOT Analysis
- 12.1.2 SCIOInspire Corp
- 12.1.2.1. Company Overview
- 12.1.2.2. Products
- 12.1.2.3. Company Financials
- 12.1.2.4. SWOT Analysis
- 12.1.3 Wipro Limited
- 12.1.3.1. Company Overview
- 12.1.3.2. Products
- 12.1.3.3. Company Financials
- 12.1.3.4. SWOT Analysis
- 12.1.4 Cognizant
- 12.1.4.1. Company Overview
- 12.1.4.2. Products
- 12.1.4.3. Company Financials
- 12.1.4.4. SWOT Analysis
- 12.1.5 M3 (EU) Ltd*List Not Exhaustive
- 12.1.5.1. Company Overview
- 12.1.5.2. Products
- 12.1.5.3. Company Financials
- 12.1.5.4. SWOT Analysis
- 12.1.6 IBM Corporation
- 12.1.6.1. Company Overview
- 12.1.6.2. Products
- 12.1.6.3. Company Financials
- 12.1.6.4. SWOT Analysis
- 12.1.7 TAKE Solutions Limited
- 12.1.7.1. Company Overview
- 12.1.7.2. Products
- 12.1.7.3. Company Financials
- 12.1.7.4. SWOT Analysis
- 12.1.8 Accenture
- 12.1.8.1. Company Overview
- 12.1.8.2. Products
- 12.1.8.3. Company Financials
- 12.1.8.4. SWOT Analysis
- 12.1.9 IQVIA
- 12.1.9.1. Company Overview
- 12.1.9.2. Products
- 12.1.9.3. Company Financials
- 12.1.9.4. SWOT Analysis
- 12.1.10 Oracle Corporation
- 12.1.10.1. Company Overview
- 12.1.10.2. Products
- 12.1.10.3. Company Financials
- 12.1.10.4. SWOT Analysis
- 12.1.11 MaxisIT Inc
- 12.1.11.1. Company Overview
- 12.1.11.2. Products
- 12.1.11.3. Company Financials
- 12.1.11.4. SWOT Analysis
- 12.1.12 Dynata
- 12.1.12.1. Company Overview
- 12.1.12.2. Products
- 12.1.12.3. Company Financials
- 12.1.12.4. SWOT Analysis
- 12.1.1 SAS Institute Inc
- 12.2. Market Entropy
- 12.2.1 Company's Key Areas Served
- 12.2.2 Recent Developments
- 12.3. Company Market Share Analysis 2025
- 12.3.1 Top 5 Companies Market Share Analysis
- 12.3.2 Top 3 Companies Market Share Analysis
- 12.4. List of Potential Customers
- 13. Research Methodology
List of Figures
- Figure 1: Global Life Science Analytics Software Market Revenue Breakdown (Million, %) by Region 2025 & 2033
- Figure 2: North America Life Science Analytics Software Market Revenue (Million), by Product Type 2025 & 2033
- Figure 3: North America Life Science Analytics Software Market Revenue Share (%), by Product Type 2025 & 2033
- Figure 4: North America Life Science Analytics Software Market Revenue (Million), by Application 2025 & 2033
- Figure 5: North America Life Science Analytics Software Market Revenue Share (%), by Application 2025 & 2033
- Figure 6: North America Life Science Analytics Software Market Revenue (Million), by Component 2025 & 2033
- Figure 7: North America Life Science Analytics Software Market Revenue Share (%), by Component 2025 & 2033
- Figure 8: North America Life Science Analytics Software Market Revenue (Million), by End User 2025 & 2033
- Figure 9: North America Life Science Analytics Software Market Revenue Share (%), by End User 2025 & 2033
- Figure 10: North America Life Science Analytics Software Market Revenue (Million), by Country 2025 & 2033
- Figure 11: North America Life Science Analytics Software Market Revenue Share (%), by Country 2025 & 2033
- Figure 12: Europe Life Science Analytics Software Market Revenue (Million), by Product Type 2025 & 2033
- Figure 13: Europe Life Science Analytics Software Market Revenue Share (%), by Product Type 2025 & 2033
- Figure 14: Europe Life Science Analytics Software Market Revenue (Million), by Application 2025 & 2033
- Figure 15: Europe Life Science Analytics Software Market Revenue Share (%), by Application 2025 & 2033
- Figure 16: Europe Life Science Analytics Software Market Revenue (Million), by Component 2025 & 2033
- Figure 17: Europe Life Science Analytics Software Market Revenue Share (%), by Component 2025 & 2033
- Figure 18: Europe Life Science Analytics Software Market Revenue (Million), by End User 2025 & 2033
- Figure 19: Europe Life Science Analytics Software Market Revenue Share (%), by End User 2025 & 2033
- Figure 20: Europe Life Science Analytics Software Market Revenue (Million), by Country 2025 & 2033
- Figure 21: Europe Life Science Analytics Software Market Revenue Share (%), by Country 2025 & 2033
- Figure 22: Asia Pacific Life Science Analytics Software Market Revenue (Million), by Product Type 2025 & 2033
- Figure 23: Asia Pacific Life Science Analytics Software Market Revenue Share (%), by Product Type 2025 & 2033
- Figure 24: Asia Pacific Life Science Analytics Software Market Revenue (Million), by Application 2025 & 2033
- Figure 25: Asia Pacific Life Science Analytics Software Market Revenue Share (%), by Application 2025 & 2033
- Figure 26: Asia Pacific Life Science Analytics Software Market Revenue (Million), by Component 2025 & 2033
- Figure 27: Asia Pacific Life Science Analytics Software Market Revenue Share (%), by Component 2025 & 2033
- Figure 28: Asia Pacific Life Science Analytics Software Market Revenue (Million), by End User 2025 & 2033
- Figure 29: Asia Pacific Life Science Analytics Software Market Revenue Share (%), by End User 2025 & 2033
- Figure 30: Asia Pacific Life Science Analytics Software Market Revenue (Million), by Country 2025 & 2033
- Figure 31: Asia Pacific Life Science Analytics Software Market Revenue Share (%), by Country 2025 & 2033
- Figure 32: Middle East and Africa Life Science Analytics Software Market Revenue (Million), by Product Type 2025 & 2033
- Figure 33: Middle East and Africa Life Science Analytics Software Market Revenue Share (%), by Product Type 2025 & 2033
- Figure 34: Middle East and Africa Life Science Analytics Software Market Revenue (Million), by Application 2025 & 2033
- Figure 35: Middle East and Africa Life Science Analytics Software Market Revenue Share (%), by Application 2025 & 2033
- Figure 36: Middle East and Africa Life Science Analytics Software Market Revenue (Million), by Component 2025 & 2033
- Figure 37: Middle East and Africa Life Science Analytics Software Market Revenue Share (%), by Component 2025 & 2033
- Figure 38: Middle East and Africa Life Science Analytics Software Market Revenue (Million), by End User 2025 & 2033
- Figure 39: Middle East and Africa Life Science Analytics Software Market Revenue Share (%), by End User 2025 & 2033
- Figure 40: Middle East and Africa Life Science Analytics Software Market Revenue (Million), by Country 2025 & 2033
- Figure 41: Middle East and Africa Life Science Analytics Software Market Revenue Share (%), by Country 2025 & 2033
- Figure 42: South America Life Science Analytics Software Market Revenue (Million), by Product Type 2025 & 2033
- Figure 43: South America Life Science Analytics Software Market Revenue Share (%), by Product Type 2025 & 2033
- Figure 44: South America Life Science Analytics Software Market Revenue (Million), by Application 2025 & 2033
- Figure 45: South America Life Science Analytics Software Market Revenue Share (%), by Application 2025 & 2033
- Figure 46: South America Life Science Analytics Software Market Revenue (Million), by Component 2025 & 2033
- Figure 47: South America Life Science Analytics Software Market Revenue Share (%), by Component 2025 & 2033
- Figure 48: South America Life Science Analytics Software Market Revenue (Million), by End User 2025 & 2033
- Figure 49: South America Life Science Analytics Software Market Revenue Share (%), by End User 2025 & 2033
- Figure 50: South America Life Science Analytics Software Market Revenue (Million), by Country 2025 & 2033
- Figure 51: South America Life Science Analytics Software Market Revenue Share (%), by Country 2025 & 2033
List of Tables
- Table 1: Global Life Science Analytics Software Market Revenue Million Forecast, by Product Type 2020 & 2033
- Table 2: Global Life Science Analytics Software Market Revenue Million Forecast, by Application 2020 & 2033
- Table 3: Global Life Science Analytics Software Market Revenue Million Forecast, by Component 2020 & 2033
- Table 4: Global Life Science Analytics Software Market Revenue Million Forecast, by End User 2020 & 2033
- Table 5: Global Life Science Analytics Software Market Revenue Million Forecast, by Region 2020 & 2033
- Table 6: Global Life Science Analytics Software Market Revenue Million Forecast, by Product Type 2020 & 2033
- Table 7: Global Life Science Analytics Software Market Revenue Million Forecast, by Application 2020 & 2033
- Table 8: Global Life Science Analytics Software Market Revenue Million Forecast, by Component 2020 & 2033
- Table 9: Global Life Science Analytics Software Market Revenue Million Forecast, by End User 2020 & 2033
- Table 10: Global Life Science Analytics Software Market Revenue Million Forecast, by Country 2020 & 2033
- Table 11: United States Life Science Analytics Software Market Revenue (Million) Forecast, by Application 2020 & 2033
- Table 12: Canada Life Science Analytics Software Market Revenue (Million) Forecast, by Application 2020 & 2033
- Table 13: Mexico Life Science Analytics Software Market Revenue (Million) Forecast, by Application 2020 & 2033
- Table 14: Global Life Science Analytics Software Market Revenue Million Forecast, by Product Type 2020 & 2033
- Table 15: Global Life Science Analytics Software Market Revenue Million Forecast, by Application 2020 & 2033
- Table 16: Global Life Science Analytics Software Market Revenue Million Forecast, by Component 2020 & 2033
- Table 17: Global Life Science Analytics Software Market Revenue Million Forecast, by End User 2020 & 2033
- Table 18: Global Life Science Analytics Software Market Revenue Million Forecast, by Country 2020 & 2033
- Table 19: Germany Life Science Analytics Software Market Revenue (Million) Forecast, by Application 2020 & 2033
- Table 20: United Kingdom Life Science Analytics Software Market Revenue (Million) Forecast, by Application 2020 & 2033
- Table 21: France Life Science Analytics Software Market Revenue (Million) Forecast, by Application 2020 & 2033
- Table 22: Italy Life Science Analytics Software Market Revenue (Million) Forecast, by Application 2020 & 2033
- Table 23: Spain Life Science Analytics Software Market Revenue (Million) Forecast, by Application 2020 & 2033
- Table 24: Rest of Europe Life Science Analytics Software Market Revenue (Million) Forecast, by Application 2020 & 2033
- Table 25: Global Life Science Analytics Software Market Revenue Million Forecast, by Product Type 2020 & 2033
- Table 26: Global Life Science Analytics Software Market Revenue Million Forecast, by Application 2020 & 2033
- Table 27: Global Life Science Analytics Software Market Revenue Million Forecast, by Component 2020 & 2033
- Table 28: Global Life Science Analytics Software Market Revenue Million Forecast, by End User 2020 & 2033
- Table 29: Global Life Science Analytics Software Market Revenue Million Forecast, by Country 2020 & 2033
- Table 30: China Life Science Analytics Software Market Revenue (Million) Forecast, by Application 2020 & 2033
- Table 31: Japan Life Science Analytics Software Market Revenue (Million) Forecast, by Application 2020 & 2033
- Table 32: India Life Science Analytics Software Market Revenue (Million) Forecast, by Application 2020 & 2033
- Table 33: Australia Life Science Analytics Software Market Revenue (Million) Forecast, by Application 2020 & 2033
- Table 34: South Korea Life Science Analytics Software Market Revenue (Million) Forecast, by Application 2020 & 2033
- Table 35: Rest of Asia Pacific Life Science Analytics Software Market Revenue (Million) Forecast, by Application 2020 & 2033
- Table 36: Global Life Science Analytics Software Market Revenue Million Forecast, by Product Type 2020 & 2033
- Table 37: Global Life Science Analytics Software Market Revenue Million Forecast, by Application 2020 & 2033
- Table 38: Global Life Science Analytics Software Market Revenue Million Forecast, by Component 2020 & 2033
- Table 39: Global Life Science Analytics Software Market Revenue Million Forecast, by End User 2020 & 2033
- Table 40: Global Life Science Analytics Software Market Revenue Million Forecast, by Country 2020 & 2033
- Table 41: GCC Life Science Analytics Software Market Revenue (Million) Forecast, by Application 2020 & 2033
- Table 42: South Africa Life Science Analytics Software Market Revenue (Million) Forecast, by Application 2020 & 2033
- Table 43: Rest of Middle East and Africa Life Science Analytics Software Market Revenue (Million) Forecast, by Application 2020 & 2033
- Table 44: Global Life Science Analytics Software Market Revenue Million Forecast, by Product Type 2020 & 2033
- Table 45: Global Life Science Analytics Software Market Revenue Million Forecast, by Application 2020 & 2033
- Table 46: Global Life Science Analytics Software Market Revenue Million Forecast, by Component 2020 & 2033
- Table 47: Global Life Science Analytics Software Market Revenue Million Forecast, by End User 2020 & 2033
- Table 48: Global Life Science Analytics Software Market Revenue Million Forecast, by Country 2020 & 2033
- Table 49: Brazil Life Science Analytics Software Market Revenue (Million) Forecast, by Application 2020 & 2033
- Table 50: Argentina Life Science Analytics Software Market Revenue (Million) Forecast, by Application 2020 & 2033
- Table 51: Rest of South America Life Science Analytics Software Market Revenue (Million) Forecast, by Application 2020 & 2033
Frequently Asked Questions
1. What is the projected Compound Annual Growth Rate (CAGR) of the Life Science Analytics Software Market?
The projected CAGR is approximately 7.71%.
2. Which companies are prominent players in the Life Science Analytics Software Market?
Key companies in the market include SAS Institute Inc, SCIOInspire Corp, Wipro Limited, Cognizant, M3 (EU) Ltd*List Not Exhaustive, IBM Corporation, TAKE Solutions Limited, Accenture, IQVIA, Oracle Corporation, MaxisIT Inc, Dynata.
3. What are the main segments of the Life Science Analytics Software Market?
The market segments include Product Type, Application, Component, End User.
4. Can you provide details about the market size?
The market size is estimated to be USD 11.06 Million as of 2022.
5. What are some drivers contributing to market growth?
Rising Adoption of Analytics Solutions in Pharmaceuticals and Clinical Trials; Growing Pressure to Reduce Healthcare Spending and the Need for Improved Patient Outcomes; Emergence of Advanced Analytics Method in Life Science Companies.
6. What are the notable trends driving market growth?
Pharmaceutical and Biotechnology Companies are Expected to Witness the Rapid Growth in Coming Years.
7. Are there any restraints impacting market growth?
Lack of Skilled Personnel; High Implementation Costs.
8. Can you provide examples of recent developments in the market?
July 2022: Charles River Associates launched the company's new data analytics suite, the Healthcare Claims Analytics Platform (HCAP), at the World Orphan Drug Congress USA 2022 in Boston. HCAP delivers the power of machine learning and patient analytics to inform about market understanding and support intelligent decision-making.
9. What pricing options are available for accessing the report?
Pricing options include single-user, multi-user, and enterprise licenses priced at USD 4750, USD 5250, and USD 8750 respectively.
10. Is the market size provided in terms of value or volume?
The market size is provided in terms of value, measured in Million.
11. Are there any specific market keywords associated with the report?
Yes, the market keyword associated with the report is "Life Science Analytics Software Market," which aids in identifying and referencing the specific market segment covered.
12. How do I determine which pricing option suits my needs best?
The pricing options vary based on user requirements and access needs. Individual users may opt for single-user licenses, while businesses requiring broader access may choose multi-user or enterprise licenses for cost-effective access to the report.
13. Are there any additional resources or data provided in the Life Science Analytics Software Market report?
While the report offers comprehensive insights, it's advisable to review the specific contents or supplementary materials provided to ascertain if additional resources or data are available.
14. How can I stay updated on further developments or reports in the Life Science Analytics Software Market?
To stay informed about further developments, trends, and reports in the Life Science Analytics Software Market, consider subscribing to industry newsletters, following relevant companies and organizations, or regularly checking reputable industry news sources and publications.
Methodology
Step 1 - Identification of Relevant Samples Size from Population Database


Step 2 - Approaches for Defining Global Market Size (Value, Volume* & Price*)

Note*: In applicable scenarios
Step 3 - Data Sources
Primary Research
- Web Analytics
- Survey Reports
- Research Institute
- Latest Research Reports
- Opinion Leaders
Secondary Research
- Annual Reports
- White Paper
- Latest Press Release
- Industry Association
- Paid Database
- Investor Presentations

Step 4 - Data Triangulation
Involves using different sources of information in order to increase the validity of a study
These sources are likely to be stakeholders in a program - participants, other researchers, program staff, other community members, and so on.
Then we put all data in single framework & apply various statistical tools to find out the dynamic on the market.
During the analysis stage, feedback from the stakeholder groups would be compared to determine areas of agreement as well as areas of divergence