

Key Insights
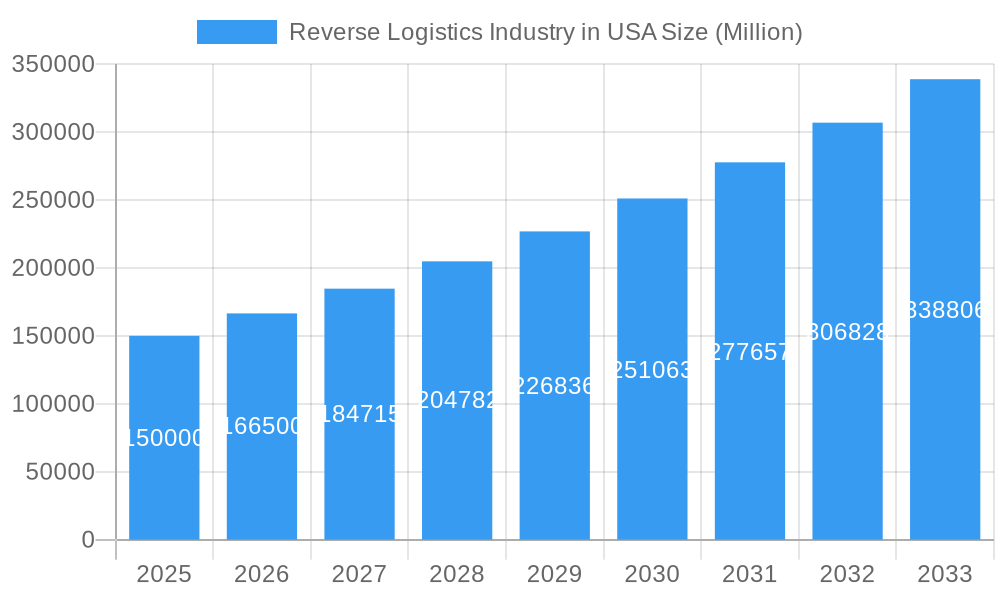
The US reverse logistics market, encompassing activities like returns processing, refurbishment, and disposal, is experiencing robust growth, projected to maintain a Compound Annual Growth Rate (CAGR) exceeding 11% from 2025 to 2033. This expansion is fueled by several key factors. The e-commerce boom continues to drive a significant increase in product returns, demanding efficient and cost-effective reverse logistics solutions. Growing consumer awareness of sustainability and the increasing pressure to reduce waste are also contributing to the market's growth, as businesses prioritize environmentally responsible return management strategies. Furthermore, the rise of subscription-based business models and the increasing complexity of supply chains are adding complexity, driving demand for specialized reverse logistics services. Major segments within the market include consumer and retail (e-commerce leading the way), automotive, healthcare, and other industrial sectors. The functional segments are dominated by transportation (including warehousing and distribution) and value-added services such as refurbishment and disposition. Competitive pressures are evident, with established players like FedEx, UPS, and DHL competing with specialized reverse logistics providers and smaller, regional companies. The geographic distribution across the United States shows strong market presence in all regions, with potentially higher concentrations in areas with dense populations and major transportation hubs.
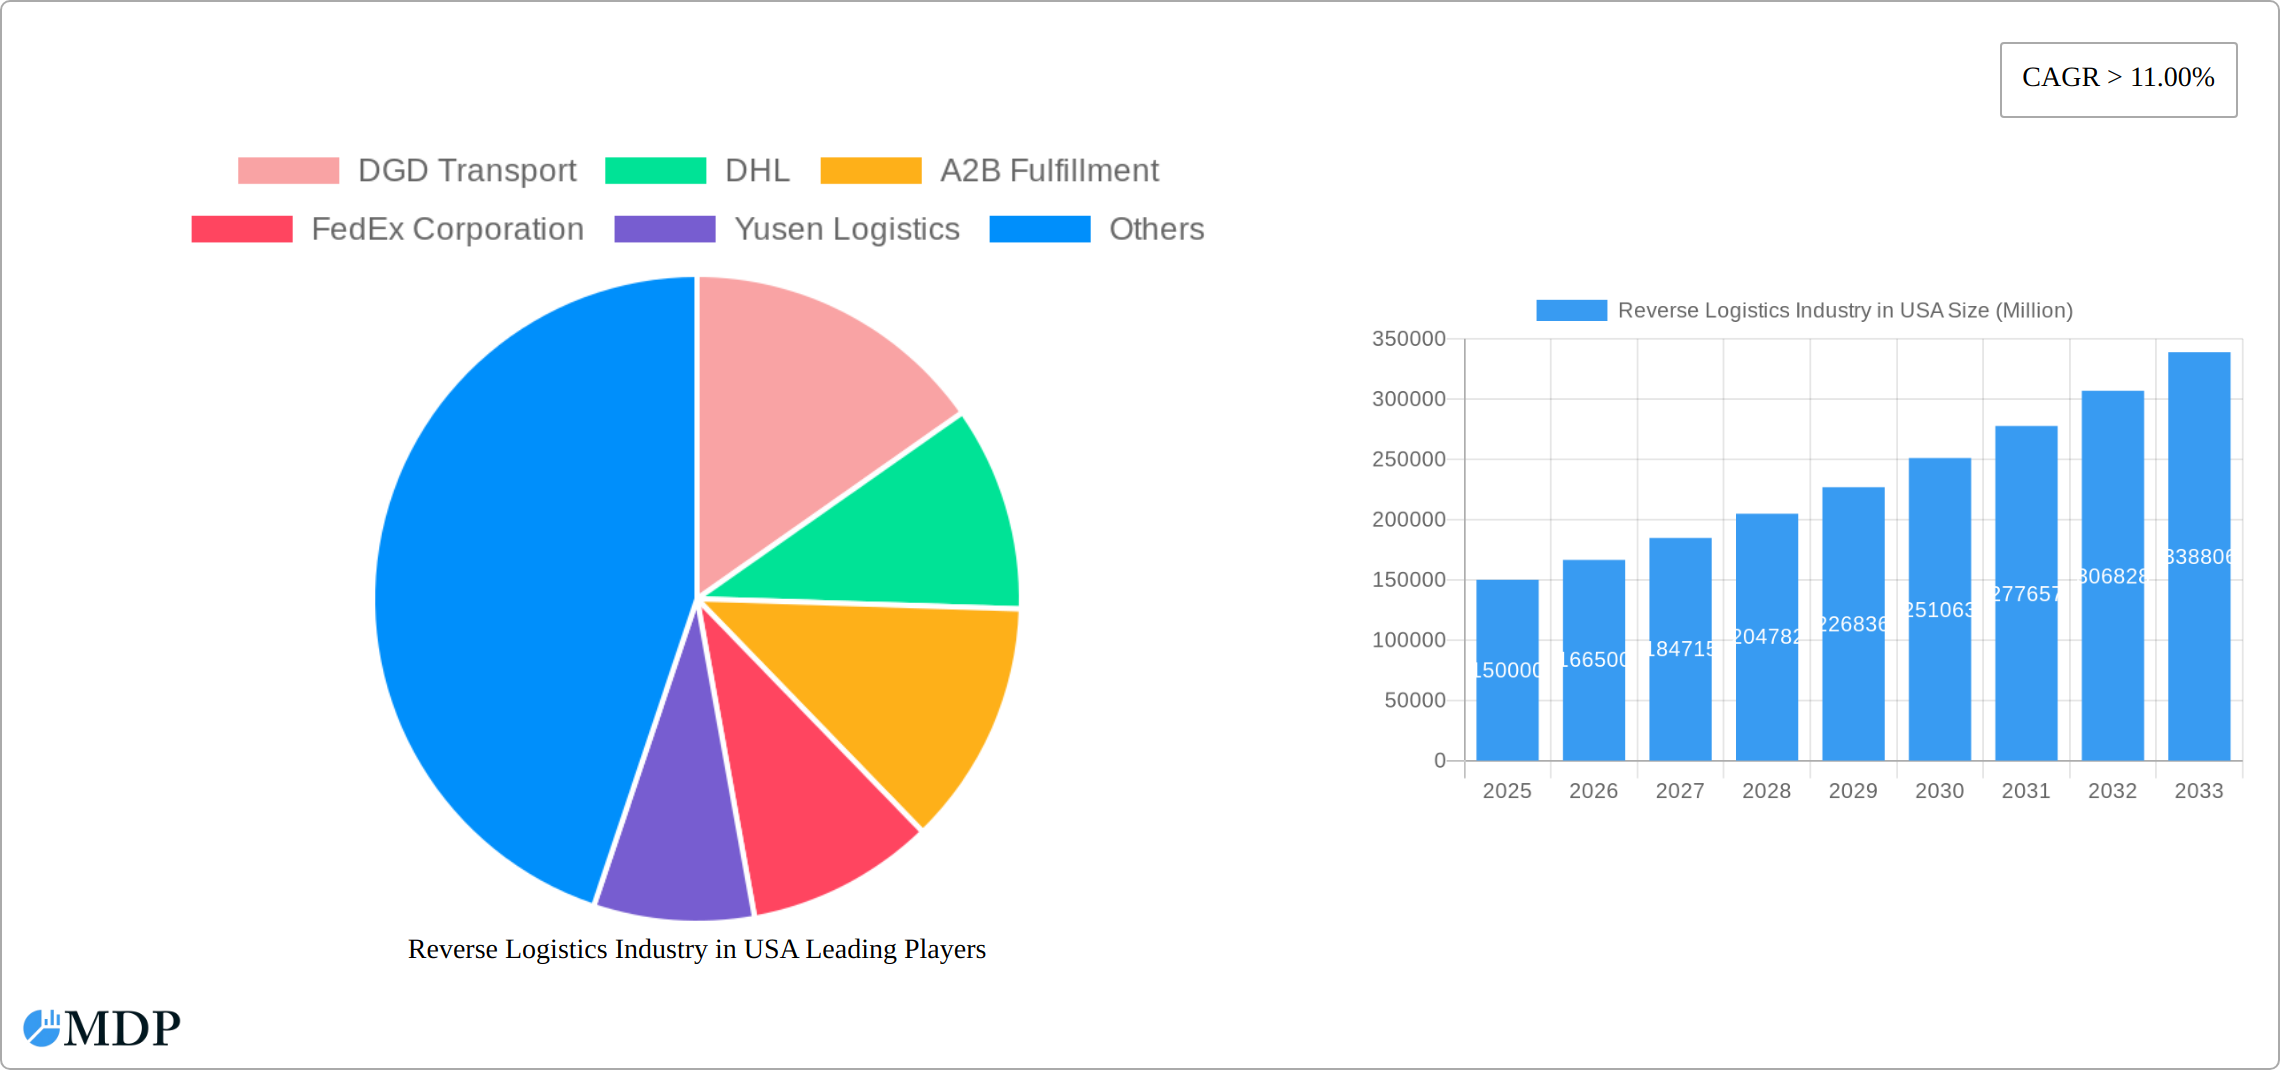
Reverse Logistics Industry in USA Market Size (In Billion)
The market's future trajectory is influenced by several trends. Technological advancements, such as AI-powered logistics optimization and automation in warehousing, are improving efficiency and reducing costs. The increasing adoption of sustainable practices within reverse logistics, such as recycling and repurposing, are not only environmentally beneficial but are also becoming increasingly important for brand reputation and regulatory compliance. However, challenges remain, including rising transportation costs, labor shortages, and the need to manage increasingly complex regulatory requirements surrounding product disposal and waste management. Despite these challenges, the continued growth of e-commerce and the escalating focus on sustainability will likely propel the US reverse logistics market towards significant expansion over the forecast period.
Reverse Logistics Industry in USA Company Market Share
Reverse Logistics Industry in USA: A Comprehensive Market Report (2019-2033)
This in-depth report provides a comprehensive analysis of the Reverse Logistics Industry in the USA, covering market dynamics, trends, leading players, and future growth prospects. With a study period spanning 2019-2033, a base year of 2025, and a forecast period of 2025-2033, this report offers invaluable insights for industry stakeholders, investors, and strategic decision-makers. The market is valued at xx Million in 2025 and is projected to reach xx Million by 2033, exhibiting a CAGR of xx%.
Reverse Logistics Industry in USA Market Dynamics & Concentration
The US reverse logistics market is characterized by moderate concentration, with a few major players holding significant market share. The market's dynamism is driven by several factors including e-commerce growth, increasing consumer returns, stringent environmental regulations, and technological advancements in supply chain management. Innovation in areas like automated returns processing and sustainable packaging solutions is fostering competition. The regulatory landscape, particularly concerning waste management and environmental compliance, significantly impacts industry practices. Product substitutes, such as alternative disposal methods, exert competitive pressure. Consumer trends favoring convenient return processes and sustainable practices shape market demand. Furthermore, the market has witnessed several M&A activities in recent years, with xx deals recorded between 2019 and 2024, consolidating market share amongst key players. Major players like FedEx and UPS hold significant market share, estimated at xx% and xx%, respectively, in 2025.
- Market Concentration: Moderately concentrated, with a few dominant players.
- Innovation Drivers: Automation, sustainable packaging, improved software solutions.
- Regulatory Framework: Stringent environmental regulations impacting waste disposal and packaging.
- Product Substitutes: Alternative waste management and disposal methods.
- End-User Trends: Growing preference for convenient returns and environmentally friendly practices.
- M&A Activity: xx deals recorded between 2019 and 2024, leading to increased market consolidation.
Reverse Logistics Industry in USA Industry Trends & Analysis
The US reverse logistics market is experiencing robust growth, driven primarily by the exponential rise of e-commerce. This surge in online shopping has led to a significant increase in product returns, fueling the demand for efficient and cost-effective reverse logistics solutions. Technological advancements, particularly in areas like AI-powered route optimization and automated warehousing, are further enhancing operational efficiency and reducing costs. Consumer preferences for seamless return experiences and sustainable practices are also shaping market dynamics. The competitive landscape is characterized by intense competition among established players like FedEx, UPS, and DHL, alongside the emergence of specialized reverse logistics providers focusing on niche sectors like apparel and electronics. Market penetration for automated solutions is projected to reach xx% by 2033, driven by cost savings and improved efficiency. The market's CAGR is projected at xx% during the forecast period (2025-2033).
Leading Markets & Segments in Reverse Logistics Industry in USA
The Consumer and Retail segment remains the undisputed leader in the US reverse logistics market, encompassing the burgeoning e-commerce sector, consumer electronics, and the fast-paced apparel industry. In 2025, this segment is projected to account for approximately 60-65% of the total market value, driven by consistently high return rates and evolving consumer expectations for seamless return processes. The Healthcare and Pharmaceuticals sector is experiencing robust growth, fueled by increasingly stringent regulations governing product recalls, the secure handling of sensitive materials, and the critical need for effective cold chain logistics. Within the operational segments, Warehousing, encompassing storage, consolidation, refurbishment, and final disposition, represents a cornerstone of efficient reverse logistics, demanding advanced inventory management and value-added services. The Transportation segment is equally critical, focusing on optimizing return shipping, last-mile delivery of returned goods, and the efficient movement of products back through the supply chain.
Key Drivers by Segment:
- Consumer & Retail: The relentless growth of e-commerce, coupled with increasingly liberal return policies and a heightened consumer demand for hassle-free returns, fuels this segment's dominance.
- Automotive: Driven by rigorous recall management processes, the need for efficient end-of-life vehicle recycling, and the management of returned parts and components.
- Healthcare & Pharmaceuticals: Stringent regulatory compliance, critical product recall management, and the specialized requirements of cold chain logistics are paramount drivers.
- Electronics: The rapid obsolescence of electronic devices and the need for efficient repair, refurbishment, and responsible e-waste disposal contribute significantly.
- Transportation: Optimized route planning for returns, efficient last-mile delivery of returned items, and the integration of return flows into primary logistics networks are key.
- Warehousing: The demand for specialized storage, consolidation, inspection, testing, refurbishment, and secure disposal services is a major factor.
Dominance Analysis: The Consumer and Retail segment's overwhelming dominance is a direct consequence of the sheer volume of returns generated by online shopping and the industry's ongoing efforts to refine and streamline these complex processes to maintain customer loyalty.
Reverse Logistics Industry in USA Product Developments
Recent innovations include AI-powered return portals streamlining the return process, advanced warehouse management systems (WMS) optimizing space and efficiency, and sustainable packaging solutions minimizing environmental impact. These technologies enhance operational efficiency, reduce costs, and improve the overall customer experience. The focus is shifting towards integrated platforms offering end-to-end reverse logistics solutions, catering to the growing demands of various industries and enhancing their competitive edge.
Key Drivers of Reverse Logistics Industry in USA Growth
The accelerated growth of the reverse logistics industry in the USA is propelled by a confluence of powerful forces. The sustained expansion of e-commerce, leading to higher return volumes, is a primary catalyst. Simultaneously, increasing environmental awareness and the imperative for sustainability are driving a shift towards more circular economy principles, encouraging the repair, refurbishment, and recycling of products. Technological advancements are playing a transformative role, with the adoption of AI, machine learning, IoT, and automation enhancing operational efficiency, improving forecasting accuracy, and reducing costs associated with returns management. Furthermore, evolving government policies and regulations that promote sustainable waste management and extended producer responsibility are incentivizing businesses to invest in robust reverse logistics capabilities. The introduction of tax incentives for companies implementing environmentally conscious reverse logistics practices is further accelerating this adoption and innovation.
Challenges in the Reverse Logistics Industry in USA Market
Despite its growth trajectory, the US reverse logistics market faces significant hurdles. The sheer volume and unpredictability of returns, particularly from the e-commerce sector, present considerable logistical and financial challenges. Navigating the intricate and often varied regulatory frameworks surrounding product disposal, environmental compliance, and data privacy requires specialized expertise. Maintaining cost-effectiveness while simultaneously delivering high service levels for customers remains a delicate balancing act. Supply chain disruptions, exacerbated by global events, and the ever-increasing pressure of labor costs and talent shortages in warehousing and transportation also significantly impact profitability and operational efficiency. In 2025, transportation costs are estimated to account for a substantial portion, potentially 30-35%, of overall reverse logistics expenses, a figure amplified by rising fuel prices and a persistent shortage of qualified drivers.
Emerging Opportunities in Reverse Logistics Industry in USA
The landscape of reverse logistics in the USA is ripe with emerging opportunities for innovation and expansion. The strategic implementation of advanced technologies, including AI-powered predictive analytics for return forecasting, machine learning for automated sorting and disposition, and robotics for efficient warehouse operations, holds immense potential to revolutionize efficiency and cost reduction. Deepening strategic partnerships between dedicated reverse logistics providers and retailers can foster greater supply chain integration, leading to enhanced visibility, improved inventory management, and a superior customer return experience. The expansion into specialized and high-growth niche markets, such as healthcare and pharmaceuticals, particularly for the safe and compliant return of medical devices and pharmaceuticals, presents significant untapped potential. Furthermore, market expansion through strategic acquisitions of smaller players and venturing into underserved geographical regions will be crucial for sustained growth and market leadership.
Leading Players in the Reverse Logistics Industry in USA Sector
- DGD Transport
- DHL
- A2B Fulfillment
- FedEx Corporation
- Yusen Logistics
- United Parcel Service (UPS)
- YRC Worldwide Inc
- 7 COMPANY PROFILES
- C H Robinson Worldwide Inc
- XPO Logistics
- Excelsior Integrated LLC
- Happy Returns Inc
- American Distribution Inc
- FW Logistics
- Newgistics Inc
- United States Postal Service (USPS)
- Optoro
Key Milestones in Reverse Logistics Industry in USA Industry
- 2020: Increased adoption of automated return processing systems by major retailers.
- 2021: Implementation of stricter environmental regulations impacting packaging and waste disposal.
- 2022: Significant investments in AI-powered route optimization technologies by logistics providers.
- 2023: Several mergers and acquisitions consolidating market share among key players.
- 2024: Growing adoption of sustainable packaging solutions across various industries.
Strategic Outlook for Reverse Logistics Industry in USA Market
The outlook for the US reverse logistics market is exceptionally promising, underpinned by the continued dominance of e-commerce, the relentless pace of technological innovation, and a pervasive societal and governmental drive towards sustainability. The future will be characterized by increasing integration and collaboration, with strategic partnerships and consolidations shaping the market. Companies that embrace and excel in areas like AI, automation, and data analytics will gain a competitive edge by optimizing operations and providing greater transparency. The focus will shift towards offering comprehensive, end-to-end solutions that address the entire reverse supply chain, from initial return initiation to final product disposition. Adaptability to evolving consumer preferences for convenience and sustainability will be paramount for success. Moreover, the continued expansion of reverse logistics services into nascent sectors and the development of innovative solutions for complex product lifecycles will unlock substantial new revenue streams and drive continued market expansion.
Reverse Logistics Industry in USA Segmentation
-
1. Function
-
1.1. Transportation
- 1.1.1. Road
- 1.1.2. Air
- 1.1.3. Other Modes of Transportation
- 1.2. Warehous
- 1.3. Other Va
-
1.1. Transportation
-
2. End User
- 2.1. Consumer
- 2.2. Automotive
- 2.3. Healthcare and Pharmaceuticals
- 2.4. Other Industrial Activity Sectors
- 2.5. Other End Users
Reverse Logistics Industry in USA Segmentation By Geography
-
1. North America
- 1.1. United States
- 1.2. Canada
- 1.3. Mexico
-
2. South America
- 2.1. Brazil
- 2.2. Argentina
- 2.3. Rest of South America
-
3. Europe
- 3.1. United Kingdom
- 3.2. Germany
- 3.3. France
- 3.4. Italy
- 3.5. Spain
- 3.6. Russia
- 3.7. Benelux
- 3.8. Nordics
- 3.9. Rest of Europe
-
4. Middle East & Africa
- 4.1. Turkey
- 4.2. Israel
- 4.3. GCC
- 4.4. North Africa
- 4.5. South Africa
- 4.6. Rest of Middle East & Africa
-
5. Asia Pacific
- 5.1. China
- 5.2. India
- 5.3. Japan
- 5.4. South Korea
- 5.5. ASEAN
- 5.6. Oceania
- 5.7. Rest of Asia Pacific
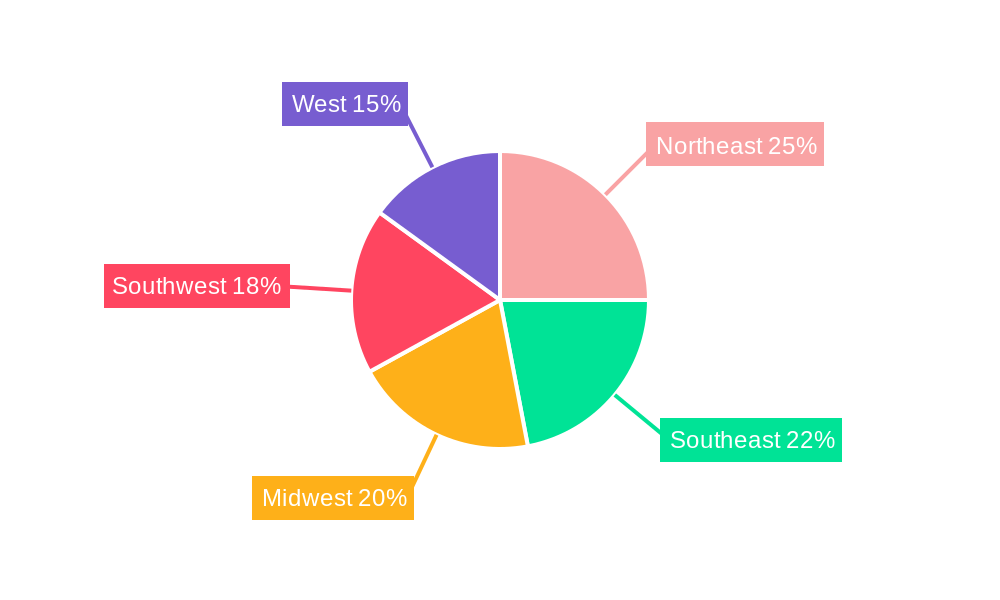
Reverse Logistics Industry in USA Regional Market Share
Geographic Coverage of Reverse Logistics Industry in USA
Reverse Logistics Industry in USA REPORT HIGHLIGHTS
| Aspects | Details |
|---|---|
| Study Period | 2020-2034 |
| Base Year | 2025 |
| Estimated Year | 2026 |
| Forecast Period | 2026-2034 |
| Historical Period | 2020-2025 |
| Growth Rate | CAGR of 6.2% from 2020-2034 |
| Segmentation |
|
Table of Contents
- 1. Introduction
- 1.1. Research Scope
- 1.2. Market Segmentation
- 1.3. Research Objective
- 1.4. Definitions and Assumptions
- 2. Executive Summary
- 2.1. Market Snapshot
- 3. Market Dynamics
- 3.1. Market Drivers
- 3.2. Market Restrains
- 3.3. Market Trends
- 3.4. Market Opportunities
- 4. Market Factor Analysis
- 4.1. Porters Five Forces
- 4.1.1. Bargaining Power of Suppliers
- 4.1.2. Bargaining Power of Buyers
- 4.1.3. Threat of New Entrants
- 4.1.4. Threat of Substitutes
- 4.1.5. Competitive Rivalry
- 4.2. PESTEL analysis
- 4.3. BCG Analysis
- 4.3.1. Stars (High Growth, High Market Share)
- 4.3.2. Cash Cows (Low Growth, High Market Share)
- 4.3.3. Question Mark (High Growth, Low Market Share)
- 4.3.4. Dogs (Low Growth, Low Market Share)
- 4.4. Ansoff Matrix Analysis
- 4.5. Supply Chain Analysis
- 4.6. Regulatory Landscape
- 4.7. Current Market Potential and Opportunity Assessment (TAM–SAM–SOM Framework)
- 4.8. MDP Analyst Note
- 4.1. Porters Five Forces
- 5. Market Analysis, Insights and Forecast 2021-2033
- 5.1. Market Analysis, Insights and Forecast - by Function
- 5.1.1. Transportation
- 5.1.1.1. Road
- 5.1.1.2. Air
- 5.1.1.3. Other Modes of Transportation
- 5.1.2. Warehous
- 5.1.3. Other Va
- 5.1.1. Transportation
- 5.2. Market Analysis, Insights and Forecast - by End User
- 5.2.1. Consumer
- 5.2.2. Automotive
- 5.2.3. Healthcare and Pharmaceuticals
- 5.2.4. Other Industrial Activity Sectors
- 5.2.5. Other End Users
- 5.3. Market Analysis, Insights and Forecast - by Region
- 5.3.1. North America
- 5.3.2. South America
- 5.3.3. Europe
- 5.3.4. Middle East & Africa
- 5.3.5. Asia Pacific
- 5.1. Market Analysis, Insights and Forecast - by Function
- 6. Global Reverse Logistics Industry in USA Analysis, Insights and Forecast, 2021-2033
- 6.1. Market Analysis, Insights and Forecast - by Function
- 6.1.1. Transportation
- 6.1.1.1. Road
- 6.1.1.2. Air
- 6.1.1.3. Other Modes of Transportation
- 6.1.2. Warehous
- 6.1.3. Other Va
- 6.1.1. Transportation
- 6.2. Market Analysis, Insights and Forecast - by End User
- 6.2.1. Consumer
- 6.2.2. Automotive
- 6.2.3. Healthcare and Pharmaceuticals
- 6.2.4. Other Industrial Activity Sectors
- 6.2.5. Other End Users
- 6.1. Market Analysis, Insights and Forecast - by Function
- 7. North America Reverse Logistics Industry in USA Analysis, Insights and Forecast, 2020-2032
- 7.1. Market Analysis, Insights and Forecast - by Function
- 7.1.1. Transportation
- 7.1.1.1. Road
- 7.1.1.2. Air
- 7.1.1.3. Other Modes of Transportation
- 7.1.2. Warehous
- 7.1.3. Other Va
- 7.1.1. Transportation
- 7.2. Market Analysis, Insights and Forecast - by End User
- 7.2.1. Consumer
- 7.2.2. Automotive
- 7.2.3. Healthcare and Pharmaceuticals
- 7.2.4. Other Industrial Activity Sectors
- 7.2.5. Other End Users
- 7.1. Market Analysis, Insights and Forecast - by Function
- 8. South America Reverse Logistics Industry in USA Analysis, Insights and Forecast, 2020-2032
- 8.1. Market Analysis, Insights and Forecast - by Function
- 8.1.1. Transportation
- 8.1.1.1. Road
- 8.1.1.2. Air
- 8.1.1.3. Other Modes of Transportation
- 8.1.2. Warehous
- 8.1.3. Other Va
- 8.1.1. Transportation
- 8.2. Market Analysis, Insights and Forecast - by End User
- 8.2.1. Consumer
- 8.2.2. Automotive
- 8.2.3. Healthcare and Pharmaceuticals
- 8.2.4. Other Industrial Activity Sectors
- 8.2.5. Other End Users
- 8.1. Market Analysis, Insights and Forecast - by Function
- 9. Europe Reverse Logistics Industry in USA Analysis, Insights and Forecast, 2020-2032
- 9.1. Market Analysis, Insights and Forecast - by Function
- 9.1.1. Transportation
- 9.1.1.1. Road
- 9.1.1.2. Air
- 9.1.1.3. Other Modes of Transportation
- 9.1.2. Warehous
- 9.1.3. Other Va
- 9.1.1. Transportation
- 9.2. Market Analysis, Insights and Forecast - by End User
- 9.2.1. Consumer
- 9.2.2. Automotive
- 9.2.3. Healthcare and Pharmaceuticals
- 9.2.4. Other Industrial Activity Sectors
- 9.2.5. Other End Users
- 9.1. Market Analysis, Insights and Forecast - by Function
- 10. Middle East & Africa Reverse Logistics Industry in USA Analysis, Insights and Forecast, 2020-2032
- 10.1. Market Analysis, Insights and Forecast - by Function
- 10.1.1. Transportation
- 10.1.1.1. Road
- 10.1.1.2. Air
- 10.1.1.3. Other Modes of Transportation
- 10.1.2. Warehous
- 10.1.3. Other Va
- 10.1.1. Transportation
- 10.2. Market Analysis, Insights and Forecast - by End User
- 10.2.1. Consumer
- 10.2.2. Automotive
- 10.2.3. Healthcare and Pharmaceuticals
- 10.2.4. Other Industrial Activity Sectors
- 10.2.5. Other End Users
- 10.1. Market Analysis, Insights and Forecast - by Function
- 11. Asia Pacific Reverse Logistics Industry in USA Analysis, Insights and Forecast, 2020-2032
- 11.1. Market Analysis, Insights and Forecast - by Function
- 11.1.1. Transportation
- 11.1.1.1. Road
- 11.1.1.2. Air
- 11.1.1.3. Other Modes of Transportation
- 11.1.2. Warehous
- 11.1.3. Other Va
- 11.1.1. Transportation
- 11.2. Market Analysis, Insights and Forecast - by End User
- 11.2.1. Consumer
- 11.2.2. Automotive
- 11.2.3. Healthcare and Pharmaceuticals
- 11.2.4. Other Industrial Activity Sectors
- 11.2.5. Other End Users
- 11.1. Market Analysis, Insights and Forecast - by Function
- 12. Competitive Analysis
- 12.1. Company Profiles
- 12.1.1 DGD Transport
- 12.1.1.1. Company Overview
- 12.1.1.2. Products
- 12.1.1.3. Company Financials
- 12.1.1.4. SWOT Analysis
- 12.1.2 DHL
- 12.1.2.1. Company Overview
- 12.1.2.2. Products
- 12.1.2.3. Company Financials
- 12.1.2.4. SWOT Analysis
- 12.1.3 A2B Fulfillment
- 12.1.3.1. Company Overview
- 12.1.3.2. Products
- 12.1.3.3. Company Financials
- 12.1.3.4. SWOT Analysis
- 12.1.4 FedEx Corporation
- 12.1.4.1. Company Overview
- 12.1.4.2. Products
- 12.1.4.3. Company Financials
- 12.1.4.4. SWOT Analysis
- 12.1.5 Yusen Logistics
- 12.1.5.1. Company Overview
- 12.1.5.2. Products
- 12.1.5.3. Company Financials
- 12.1.5.4. SWOT Analysis
- 12.1.6 United Parcel Service (UPS)
- 12.1.6.1. Company Overview
- 12.1.6.2. Products
- 12.1.6.3. Company Financials
- 12.1.6.4. SWOT Analysis
- 12.1.7 YRC Worldwide Inc
- 12.1.7.1. Company Overview
- 12.1.7.2. Products
- 12.1.7.3. Company Financials
- 12.1.7.4. SWOT Analysis
- 12.1.8 7 COMPANY PROFILES
- 12.1.8.1. Company Overview
- 12.1.8.2. Products
- 12.1.8.3. Company Financials
- 12.1.8.4. SWOT Analysis
- 12.1.9 C H Robinson Worldwide Inc
- 12.1.9.1. Company Overview
- 12.1.9.2. Products
- 12.1.9.3. Company Financials
- 12.1.9.4. SWOT Analysis
- 12.1.10 XPO Logistics
- 12.1.10.1. Company Overview
- 12.1.10.2. Products
- 12.1.10.3. Company Financials
- 12.1.10.4. SWOT Analysis
- 12.1.11 Excelsior Integrated LLC
- 12.1.11.1. Company Overview
- 12.1.11.2. Products
- 12.1.11.3. Company Financials
- 12.1.11.4. SWOT Analysis
- 12.1.12 Happy Returns Inc
- 12.1.12.1. Company Overview
- 12.1.12.2. Products
- 12.1.12.3. Company Financials
- 12.1.12.4. SWOT Analysis
- 12.1.13 American Distribution Inc
- 12.1.13.1. Company Overview
- 12.1.13.2. Products
- 12.1.13.3. Company Financials
- 12.1.13.4. SWOT Analysis
- 12.1.14 FW Logistics
- 12.1.14.1. Company Overview
- 12.1.14.2. Products
- 12.1.14.3. Company Financials
- 12.1.14.4. SWOT Analysis
- 12.1.15 Newgistics Inc
- 12.1.15.1. Company Overview
- 12.1.15.2. Products
- 12.1.15.3. Company Financials
- 12.1.15.4. SWOT Analysis
- 12.1.16 United States Postal Service (USPS)
- 12.1.16.1. Company Overview
- 12.1.16.2. Products
- 12.1.16.3. Company Financials
- 12.1.16.4. SWOT Analysis
- 12.1.17 Optoro
- 12.1.17.1. Company Overview
- 12.1.17.2. Products
- 12.1.17.3. Company Financials
- 12.1.17.4. SWOT Analysis
- 12.1.1 DGD Transport
- 12.2. Market Entropy
- 12.2.1 Company's Key Areas Served
- 12.2.2 Recent Developments
- 12.3. Company Market Share Analysis 2025
- 12.3.1 Top 5 Companies Market Share Analysis
- 12.3.2 Top 3 Companies Market Share Analysis
- 12.4. List of Potential Customers
- 13. Research Methodology
List of Figures
- Figure 1: Global Reverse Logistics Industry in USA Revenue Breakdown (undefined, %) by Region 2025 & 2033
- Figure 2: North America Reverse Logistics Industry in USA Revenue (undefined), by Function 2025 & 2033
- Figure 3: North America Reverse Logistics Industry in USA Revenue Share (%), by Function 2025 & 2033
- Figure 4: North America Reverse Logistics Industry in USA Revenue (undefined), by End User 2025 & 2033
- Figure 5: North America Reverse Logistics Industry in USA Revenue Share (%), by End User 2025 & 2033
- Figure 6: North America Reverse Logistics Industry in USA Revenue (undefined), by Country 2025 & 2033
- Figure 7: North America Reverse Logistics Industry in USA Revenue Share (%), by Country 2025 & 2033
- Figure 8: South America Reverse Logistics Industry in USA Revenue (undefined), by Function 2025 & 2033
- Figure 9: South America Reverse Logistics Industry in USA Revenue Share (%), by Function 2025 & 2033
- Figure 10: South America Reverse Logistics Industry in USA Revenue (undefined), by End User 2025 & 2033
- Figure 11: South America Reverse Logistics Industry in USA Revenue Share (%), by End User 2025 & 2033
- Figure 12: South America Reverse Logistics Industry in USA Revenue (undefined), by Country 2025 & 2033
- Figure 13: South America Reverse Logistics Industry in USA Revenue Share (%), by Country 2025 & 2033
- Figure 14: Europe Reverse Logistics Industry in USA Revenue (undefined), by Function 2025 & 2033
- Figure 15: Europe Reverse Logistics Industry in USA Revenue Share (%), by Function 2025 & 2033
- Figure 16: Europe Reverse Logistics Industry in USA Revenue (undefined), by End User 2025 & 2033
- Figure 17: Europe Reverse Logistics Industry in USA Revenue Share (%), by End User 2025 & 2033
- Figure 18: Europe Reverse Logistics Industry in USA Revenue (undefined), by Country 2025 & 2033
- Figure 19: Europe Reverse Logistics Industry in USA Revenue Share (%), by Country 2025 & 2033
- Figure 20: Middle East & Africa Reverse Logistics Industry in USA Revenue (undefined), by Function 2025 & 2033
- Figure 21: Middle East & Africa Reverse Logistics Industry in USA Revenue Share (%), by Function 2025 & 2033
- Figure 22: Middle East & Africa Reverse Logistics Industry in USA Revenue (undefined), by End User 2025 & 2033
- Figure 23: Middle East & Africa Reverse Logistics Industry in USA Revenue Share (%), by End User 2025 & 2033
- Figure 24: Middle East & Africa Reverse Logistics Industry in USA Revenue (undefined), by Country 2025 & 2033
- Figure 25: Middle East & Africa Reverse Logistics Industry in USA Revenue Share (%), by Country 2025 & 2033
- Figure 26: Asia Pacific Reverse Logistics Industry in USA Revenue (undefined), by Function 2025 & 2033
- Figure 27: Asia Pacific Reverse Logistics Industry in USA Revenue Share (%), by Function 2025 & 2033
- Figure 28: Asia Pacific Reverse Logistics Industry in USA Revenue (undefined), by End User 2025 & 2033
- Figure 29: Asia Pacific Reverse Logistics Industry in USA Revenue Share (%), by End User 2025 & 2033
- Figure 30: Asia Pacific Reverse Logistics Industry in USA Revenue (undefined), by Country 2025 & 2033
- Figure 31: Asia Pacific Reverse Logistics Industry in USA Revenue Share (%), by Country 2025 & 2033
List of Tables
- Table 1: Global Reverse Logistics Industry in USA Revenue undefined Forecast, by Function 2020 & 2033
- Table 2: Global Reverse Logistics Industry in USA Revenue undefined Forecast, by End User 2020 & 2033
- Table 3: Global Reverse Logistics Industry in USA Revenue undefined Forecast, by Region 2020 & 2033
- Table 4: Global Reverse Logistics Industry in USA Revenue undefined Forecast, by Function 2020 & 2033
- Table 5: Global Reverse Logistics Industry in USA Revenue undefined Forecast, by End User 2020 & 2033
- Table 6: Global Reverse Logistics Industry in USA Revenue undefined Forecast, by Country 2020 & 2033
- Table 7: United States Reverse Logistics Industry in USA Revenue (undefined) Forecast, by Application 2020 & 2033
- Table 8: Canada Reverse Logistics Industry in USA Revenue (undefined) Forecast, by Application 2020 & 2033
- Table 9: Mexico Reverse Logistics Industry in USA Revenue (undefined) Forecast, by Application 2020 & 2033
- Table 10: Global Reverse Logistics Industry in USA Revenue undefined Forecast, by Function 2020 & 2033
- Table 11: Global Reverse Logistics Industry in USA Revenue undefined Forecast, by End User 2020 & 2033
- Table 12: Global Reverse Logistics Industry in USA Revenue undefined Forecast, by Country 2020 & 2033
- Table 13: Brazil Reverse Logistics Industry in USA Revenue (undefined) Forecast, by Application 2020 & 2033
- Table 14: Argentina Reverse Logistics Industry in USA Revenue (undefined) Forecast, by Application 2020 & 2033
- Table 15: Rest of South America Reverse Logistics Industry in USA Revenue (undefined) Forecast, by Application 2020 & 2033
- Table 16: Global Reverse Logistics Industry in USA Revenue undefined Forecast, by Function 2020 & 2033
- Table 17: Global Reverse Logistics Industry in USA Revenue undefined Forecast, by End User 2020 & 2033
- Table 18: Global Reverse Logistics Industry in USA Revenue undefined Forecast, by Country 2020 & 2033
- Table 19: United Kingdom Reverse Logistics Industry in USA Revenue (undefined) Forecast, by Application 2020 & 2033
- Table 20: Germany Reverse Logistics Industry in USA Revenue (undefined) Forecast, by Application 2020 & 2033
- Table 21: France Reverse Logistics Industry in USA Revenue (undefined) Forecast, by Application 2020 & 2033
- Table 22: Italy Reverse Logistics Industry in USA Revenue (undefined) Forecast, by Application 2020 & 2033
- Table 23: Spain Reverse Logistics Industry in USA Revenue (undefined) Forecast, by Application 2020 & 2033
- Table 24: Russia Reverse Logistics Industry in USA Revenue (undefined) Forecast, by Application 2020 & 2033
- Table 25: Benelux Reverse Logistics Industry in USA Revenue (undefined) Forecast, by Application 2020 & 2033
- Table 26: Nordics Reverse Logistics Industry in USA Revenue (undefined) Forecast, by Application 2020 & 2033
- Table 27: Rest of Europe Reverse Logistics Industry in USA Revenue (undefined) Forecast, by Application 2020 & 2033
- Table 28: Global Reverse Logistics Industry in USA Revenue undefined Forecast, by Function 2020 & 2033
- Table 29: Global Reverse Logistics Industry in USA Revenue undefined Forecast, by End User 2020 & 2033
- Table 30: Global Reverse Logistics Industry in USA Revenue undefined Forecast, by Country 2020 & 2033
- Table 31: Turkey Reverse Logistics Industry in USA Revenue (undefined) Forecast, by Application 2020 & 2033
- Table 32: Israel Reverse Logistics Industry in USA Revenue (undefined) Forecast, by Application 2020 & 2033
- Table 33: GCC Reverse Logistics Industry in USA Revenue (undefined) Forecast, by Application 2020 & 2033
- Table 34: North Africa Reverse Logistics Industry in USA Revenue (undefined) Forecast, by Application 2020 & 2033
- Table 35: South Africa Reverse Logistics Industry in USA Revenue (undefined) Forecast, by Application 2020 & 2033
- Table 36: Rest of Middle East & Africa Reverse Logistics Industry in USA Revenue (undefined) Forecast, by Application 2020 & 2033
- Table 37: Global Reverse Logistics Industry in USA Revenue undefined Forecast, by Function 2020 & 2033
- Table 38: Global Reverse Logistics Industry in USA Revenue undefined Forecast, by End User 2020 & 2033
- Table 39: Global Reverse Logistics Industry in USA Revenue undefined Forecast, by Country 2020 & 2033
- Table 40: China Reverse Logistics Industry in USA Revenue (undefined) Forecast, by Application 2020 & 2033
- Table 41: India Reverse Logistics Industry in USA Revenue (undefined) Forecast, by Application 2020 & 2033
- Table 42: Japan Reverse Logistics Industry in USA Revenue (undefined) Forecast, by Application 2020 & 2033
- Table 43: South Korea Reverse Logistics Industry in USA Revenue (undefined) Forecast, by Application 2020 & 2033
- Table 44: ASEAN Reverse Logistics Industry in USA Revenue (undefined) Forecast, by Application 2020 & 2033
- Table 45: Oceania Reverse Logistics Industry in USA Revenue (undefined) Forecast, by Application 2020 & 2033
- Table 46: Rest of Asia Pacific Reverse Logistics Industry in USA Revenue (undefined) Forecast, by Application 2020 & 2033
Frequently Asked Questions
1. What is the projected Compound Annual Growth Rate (CAGR) of the Reverse Logistics Industry in USA?
The projected CAGR is approximately 6.2%.
2. Which companies are prominent players in the Reverse Logistics Industry in USA?
Key companies in the market include DGD Transport, DHL, A2B Fulfillment, FedEx Corporation, Yusen Logistics, United Parcel Service (UPS), YRC Worldwide Inc, 7 COMPANY PROFILES, C H Robinson Worldwide Inc, XPO Logistics, Excelsior Integrated LLC, Happy Returns Inc, American Distribution Inc, FW Logistics, Newgistics Inc, United States Postal Service (USPS), Optoro.
3. What are the main segments of the Reverse Logistics Industry in USA?
The market segments include Function, End User.
4. Can you provide details about the market size?
The market size is estimated to be USD XXX N/A as of 2022.
5. What are some drivers contributing to market growth?
N/A
6. What are the notable trends driving market growth?
Growth in E-commerce and Technology Propels the Demand for Efficient Return Logistics.
7. Are there any restraints impacting market growth?
N/A
8. Can you provide examples of recent developments in the market?
N/A
9. What pricing options are available for accessing the report?
Pricing options include single-user, multi-user, and enterprise licenses priced at USD 3800, USD 4500, and USD 5800 respectively.
10. Is the market size provided in terms of value or volume?
The market size is provided in terms of value, measured in N/A.
11. Are there any specific market keywords associated with the report?
Yes, the market keyword associated with the report is "Reverse Logistics Industry in USA," which aids in identifying and referencing the specific market segment covered.
12. How do I determine which pricing option suits my needs best?
The pricing options vary based on user requirements and access needs. Individual users may opt for single-user licenses, while businesses requiring broader access may choose multi-user or enterprise licenses for cost-effective access to the report.
13. Are there any additional resources or data provided in the Reverse Logistics Industry in USA report?
While the report offers comprehensive insights, it's advisable to review the specific contents or supplementary materials provided to ascertain if additional resources or data are available.
14. How can I stay updated on further developments or reports in the Reverse Logistics Industry in USA?
To stay informed about further developments, trends, and reports in the Reverse Logistics Industry in USA, consider subscribing to industry newsletters, following relevant companies and organizations, or regularly checking reputable industry news sources and publications.
Methodology
Step 1 - Identification of Relevant Samples Size from Population Database


Step 2 - Approaches for Defining Global Market Size (Value, Volume* & Price*)

Note*: In applicable scenarios
Step 3 - Data Sources
Primary Research
- Web Analytics
- Survey Reports
- Research Institute
- Latest Research Reports
- Opinion Leaders
Secondary Research
- Annual Reports
- White Paper
- Latest Press Release
- Industry Association
- Paid Database
- Investor Presentations

Step 4 - Data Triangulation
Involves using different sources of information in order to increase the validity of a study
These sources are likely to be stakeholders in a program - participants, other researchers, program staff, other community members, and so on.
Then we put all data in single framework & apply various statistical tools to find out the dynamic on the market.
During the analysis stage, feedback from the stakeholder groups would be compared to determine areas of agreement as well as areas of divergence