

Key Insights
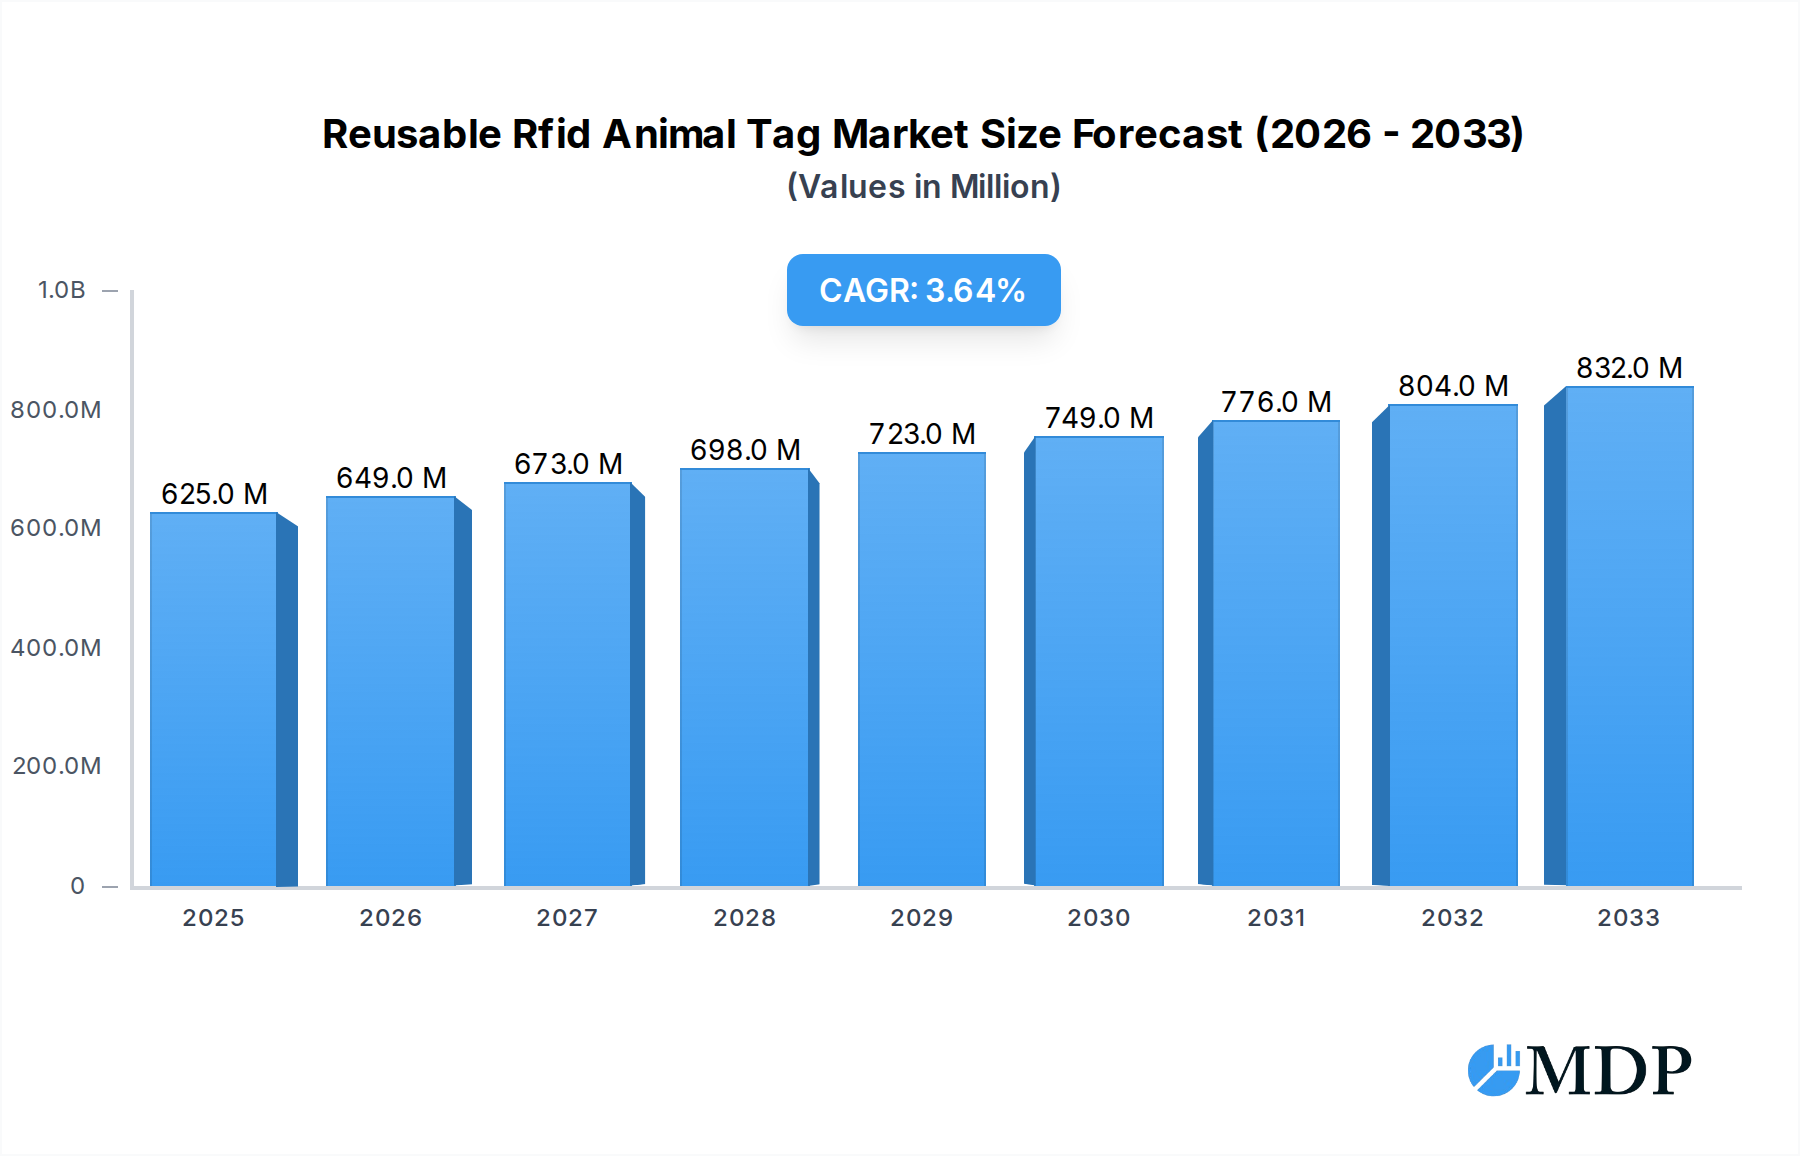
The global market for Reusable RFID Animal Tags is poised for substantial growth, projected to reach a valuation of USD 625 million by 2025. This expansion is driven by an anticipated Compound Annual Growth Rate (CAGR) of 3.8% over the forecast period of 2025-2033. The increasing demand for efficient and accurate animal identification and tracking systems in livestock management, pet microchipping, and wildlife conservation efforts underpins this positive market trajectory. Key drivers include the growing need for enhanced biosecurity measures, improved traceability for food safety, and the rising adoption of smart farming technologies. The market is witnessing a significant shift towards high-frequency electronic ear tags due to their superior data storage capacity and read range, enabling more comprehensive data collection for animal health and performance monitoring.

Reusable Rfid Animal Tag Market Size (In Million)
The Reusable RFID Animal Tag market is characterized by dynamic trends, including the integration of RFID technology with cloud-based platforms for real-time data analytics and remote monitoring. This integration allows for proactive management of animal health, optimized breeding programs, and streamlined farm operations. Furthermore, advancements in tag durability and battery life are enhancing their long-term utility and cost-effectiveness, contributing to their widespread adoption. While the market enjoys strong growth, certain restraints, such as the initial cost of implementation and the need for standardized global protocols for RFID data exchange, may pose challenges. However, the undeniable benefits of improved animal welfare, reduced disease transmission, and greater operational efficiency are expected to propel continued market expansion. Key players are focusing on developing innovative and cost-effective solutions to cater to diverse animal types and application needs.
Reusable Rfid Animal Tag Company Market Share
Reusable Rfid Animal Tag Market Dynamics & Concentration
The global reusable RFID animal tag market is characterized by a moderate to high concentration, with a significant market share held by key players such as Allflex, Datamars, and Avery Dennison. Innovation drivers are pivotal, fueled by advancements in miniaturization, enhanced data storage, and improved read range for RFID tags. Regulatory frameworks, particularly concerning animal identification and traceability for disease management and food safety, are increasingly stringent, pushing for wider adoption of advanced tagging solutions. Product substitutes, while present in traditional identification methods, are gradually losing ground to the superior data capture and management capabilities of RFID. End-user trends indicate a growing demand for integrated livestock management systems that leverage RFID data for improved herd health, breeding programs, and supply chain efficiency. Mergers and acquisitions (M&A) activities, estimated to be in the hundreds of millions of dollars annually, are a key feature, with companies seeking to expand their product portfolios, geographical reach, and technological capabilities. For instance, recent M&A deals have focused on acquiring companies with expertise in sensor technology integrated with RFID for real-time animal monitoring. The market share distribution shows approximately 35% held by the top three players, with the remaining market fragmented among niche providers and emerging innovators. M&A deal counts are projected to remain robust, with an estimated 10-15 significant transactions per year.
Reusable Rfid Animal Tag Industry Trends & Analysis
The reusable RFID animal tag industry is poised for substantial growth, driven by an escalating global demand for efficient and transparent livestock management. The Compound Annual Growth Rate (CAGR) for this market is projected to be a robust 12.5% from 2025 to 2033. This surge is primarily propelled by the increasing need for enhanced animal traceability, crucial for preventing the spread of animal diseases, ensuring food safety, and facilitating international trade of livestock. Technological advancements are at the forefront of this trend, with continuous improvements in the durability, read accuracy, and data capacity of reusable RFID tags. Furthermore, the integration of RFID technology with IoT platforms and artificial intelligence is creating new avenues for real-time data analytics, enabling farmers and veterinarians to monitor animal health, behavior, and environmental conditions with unprecedented precision. Consumer preferences are also shifting towards sustainably and ethically sourced animal products, necessitating robust tracking and traceability systems, which RFID tags provide. The competitive landscape is intensifying, with established players investing heavily in research and development and new entrants focusing on specialized applications and cost-effective solutions. Market penetration is expected to rise significantly, particularly in developed agricultural economies, driven by government initiatives and subsidies promoting the adoption of modern farming technologies. The development of low-cost, highly durable, and long-lasting reusable RFID tags is a key factor in expanding market reach into developing regions. The industry is also witnessing a trend towards the development of RFID tags with embedded sensors for physiological data collection, further enhancing their value proposition. The initial investment in RFID systems, while a consideration, is increasingly offset by the long-term benefits of reduced labor costs, improved animal welfare, and minimized losses due to disease or theft. The projected market size is expected to reach several billion dollars by the end of the forecast period.
Leading Markets & Segments in Reusable Rfid Animal Tag
The global reusable RFID animal tag market is dominated by regions and segments demonstrating strong agricultural economies and proactive regulatory environments supporting animal identification.
Dominant Region: North America, specifically the United States, and Europe, particularly Germany and France, are leading markets. These regions have well-established livestock industries, robust government initiatives for animal health and traceability, and a high adoption rate of advanced agricultural technologies.
- Key Drivers in North America & Europe:
- Strict government regulations for animal identification and movement tracking.
- High per capita income enabling investment in advanced farming technologies.
- Presence of major livestock producers with significant herd sizes.
- Strong emphasis on food safety and quality assurance.
- Well-developed infrastructure for technological adoption and support.
- Key Drivers in North America & Europe:
Dominant Application Segment: Cattle applications represent the largest segment within the reusable RFID animal tag market. This is attributed to the substantial global cattle population, extensive international trade, and the critical need for precise identification and health monitoring of these animals for disease control and production management.
- Detailed Dominance Analysis for Cattle: The extensive global cattle population, estimated in the billions, inherently creates a massive demand for identification solutions. Regulations concerning cattle traceability, particularly in the beef and dairy industries, are often stringent due to concerns about bovine spongiform encephalopathy (BSE) and other animal diseases. Furthermore, advancements in RFID technology have enabled the development of highly durable and reliable ear tags that can withstand the harsh conditions of cattle farming. The economic value of cattle herds also incentivizes farmers to invest in technologies that can optimize breeding, monitor health, and prevent theft.
Dominant Type Segment: Low Frequency (LF) Electronic Ear Tags hold a significant market share. While High Frequency (HF) and Ultra High Frequency (UHF) tags offer faster read speeds and greater data capacity, LF tags are generally more cost-effective, robust, and have a proven track record in challenging agricultural environments, making them the preferred choice for mass animal identification.
- Detailed Dominance Analysis for Low Frequency Electronic Ear Tags: The widespread adoption of LF technology in animal tagging is driven by its inherent advantages of durability and cost-effectiveness. These tags can operate reliably in environments with significant metallic interference and moisture, common in animal husbandry. Their simpler communication protocol also translates to lower manufacturing costs, making them accessible to a broader range of farmers. While advancements in HF and UHF are notable, the sheer volume of animals requiring identification globally, coupled with budget constraints in many agricultural sectors, ensures continued dominance for LF tags. Their ability to withstand physical stress and environmental factors like extreme temperatures and humidity further solidifies their position.
Other Significant Segments: Sheep applications are also a growing segment, driven by the increasing focus on sheep traceability for disease management and premium product branding. Pig applications are seeing steady growth due to specialized herd management needs.
Reusable Rfid Animal Tag Product Developments
Recent product developments in reusable RFID animal tags focus on enhanced durability, extended read range, and integrated functionalities. Innovations include advanced encapsulation materials to withstand harsh environmental conditions and resist tampering. Miniaturization of RFID chips allows for smaller, less intrusive tags with improved comfort for animals. Furthermore, the integration of passive RFID with active components or sensors is enabling real-time monitoring of animal health parameters like temperature and activity levels. Companies are also developing tags with higher data storage capacity for detailed individual animal records, supporting comprehensive herd management and disease outbreak tracing. These advancements aim to provide superior animal welfare, more efficient data collection, and greater return on investment for livestock producers.
Key Drivers of Reusable Rfid Animal Tag Growth
The reusable RFID animal tag market is experiencing significant growth driven by several key factors. Firstly, stringent government regulations mandating animal identification and traceability for disease control and food safety are a primary catalyst. Secondly, technological advancements in RFID, including increased durability, longer read ranges, and miniaturization, are making these tags more practical and cost-effective. Thirdly, the growing global demand for efficient livestock management solutions to improve productivity, animal welfare, and reduce losses from theft or disease is pushing adoption. The increasing focus on precision agriculture and the desire for detailed herd data for breeding and health monitoring further fuel this growth.
Challenges in the Reusable Rfid Animal Tag Market
Despite the positive growth trajectory, the reusable RFID animal tag market faces several challenges. High initial investment costs for RFID systems can be a barrier for smallholder farmers, particularly in developing economies. The need for specialized readers and software infrastructure can also be a deterrent. Furthermore, interoperability issues between different RFID systems and tags from various manufacturers can create complications for data integration and management. Environmental factors, such as extreme temperatures, moisture, and potential damage from animal behavior, can impact tag longevity and read accuracy, requiring robust tag design. Regulatory inconsistencies across different regions can also hinder global market expansion and standardization.
Emerging Opportunities in Reusable Rfid Animal Tag
Emerging opportunities in the reusable RFID animal tag market are largely driven by technological innovation and the increasing integration of RFID with other advanced systems. The development of RFID tags with embedded sensors for real-time health and behavioral monitoring of animals presents a significant opportunity, creating a more comprehensive data stream for precision livestock farming. Strategic partnerships between RFID tag manufacturers, software developers, and agricultural technology providers are creating integrated solutions that offer greater value to end-users. Market expansion into developing regions with growing agricultural sectors also offers substantial potential, particularly with the development of more affordable and ruggedized RFID solutions. The growing demand for authenticated and traceable animal products in niche markets further supports the expansion of RFID adoption.
Leading Players in the Reusable Rfid Animal Tag Sector
- Allflex
- Quantified
- Ceres Tag
- Ardes
- Luoyang Laipson Information
- Kupsan
- Stockbrands
- CowManager
- HerdDogg
- MOOvement
- Moocall
- Drovers
- Caisley International
- Datamars
- Fofia
- Avery Dennison
- Pelgor
Key Milestones in Reusable Rfid Animal Tag Industry
- 2019: Introduction of advanced tamper-evident reusable RFID ear tags with enhanced durability.
- 2020: Increased adoption of RFID for tracking livestock during disease outbreaks, highlighting its traceability benefits.
- 2021: Development of integrated RFID and sensor tags for basic animal health monitoring.
- 2022: Significant increase in M&A activity as larger players acquire innovative startups.
- 2023: Rollout of cloud-based RFID data management platforms for livestock.
- 2024: Enhanced global regulatory focus on animal identification standards.
- 2025: Projected widespread adoption of LF and HF RFID tags across major livestock sectors.
- 2026-2033: Continued innovation in sensor integration, AI-driven analytics, and expansion into new geographical markets.
Strategic Outlook for Reusable Rfid Animal Tag Market
The strategic outlook for the reusable RFID animal tag market is exceptionally positive, characterized by sustained growth and innovation. Future market expansion will be driven by the increasing integration of RFID with IoT devices and artificial intelligence for predictive analytics in animal health and farm management. Companies are expected to focus on developing more robust, cost-effective, and feature-rich tags, including those with advanced sensor capabilities. Strategic partnerships and potential acquisitions will continue to shape the competitive landscape, fostering the development of comprehensive solutions. Emphasis on data security and interoperability will be crucial for widespread adoption. Furthermore, expanding into emerging markets with growing agricultural sectors presents a significant long-term opportunity for market leaders and new entrants alike.
Reusable Rfid Animal Tag Segmentation
-
1. Application
- 1.1. Pig
- 1.2. Cattle
- 1.3. Sheep
- 1.4. Others
-
2. Type
- 2.1. Low Frequency Electronic Ear Tags
- 2.2. High Frequency Electronic Ear Tags
Reusable Rfid Animal Tag Segmentation By Geography
-
1. North America
- 1.1. United States
- 1.2. Canada
- 1.3. Mexico
-
2. South America
- 2.1. Brazil
- 2.2. Argentina
- 2.3. Rest of South America
-
3. Europe
- 3.1. United Kingdom
- 3.2. Germany
- 3.3. France
- 3.4. Italy
- 3.5. Spain
- 3.6. Russia
- 3.7. Benelux
- 3.8. Nordics
- 3.9. Rest of Europe
-
4. Middle East & Africa
- 4.1. Turkey
- 4.2. Israel
- 4.3. GCC
- 4.4. North Africa
- 4.5. South Africa
- 4.6. Rest of Middle East & Africa
-
5. Asia Pacific
- 5.1. China
- 5.2. India
- 5.3. Japan
- 5.4. South Korea
- 5.5. ASEAN
- 5.6. Oceania
- 5.7. Rest of Asia Pacific
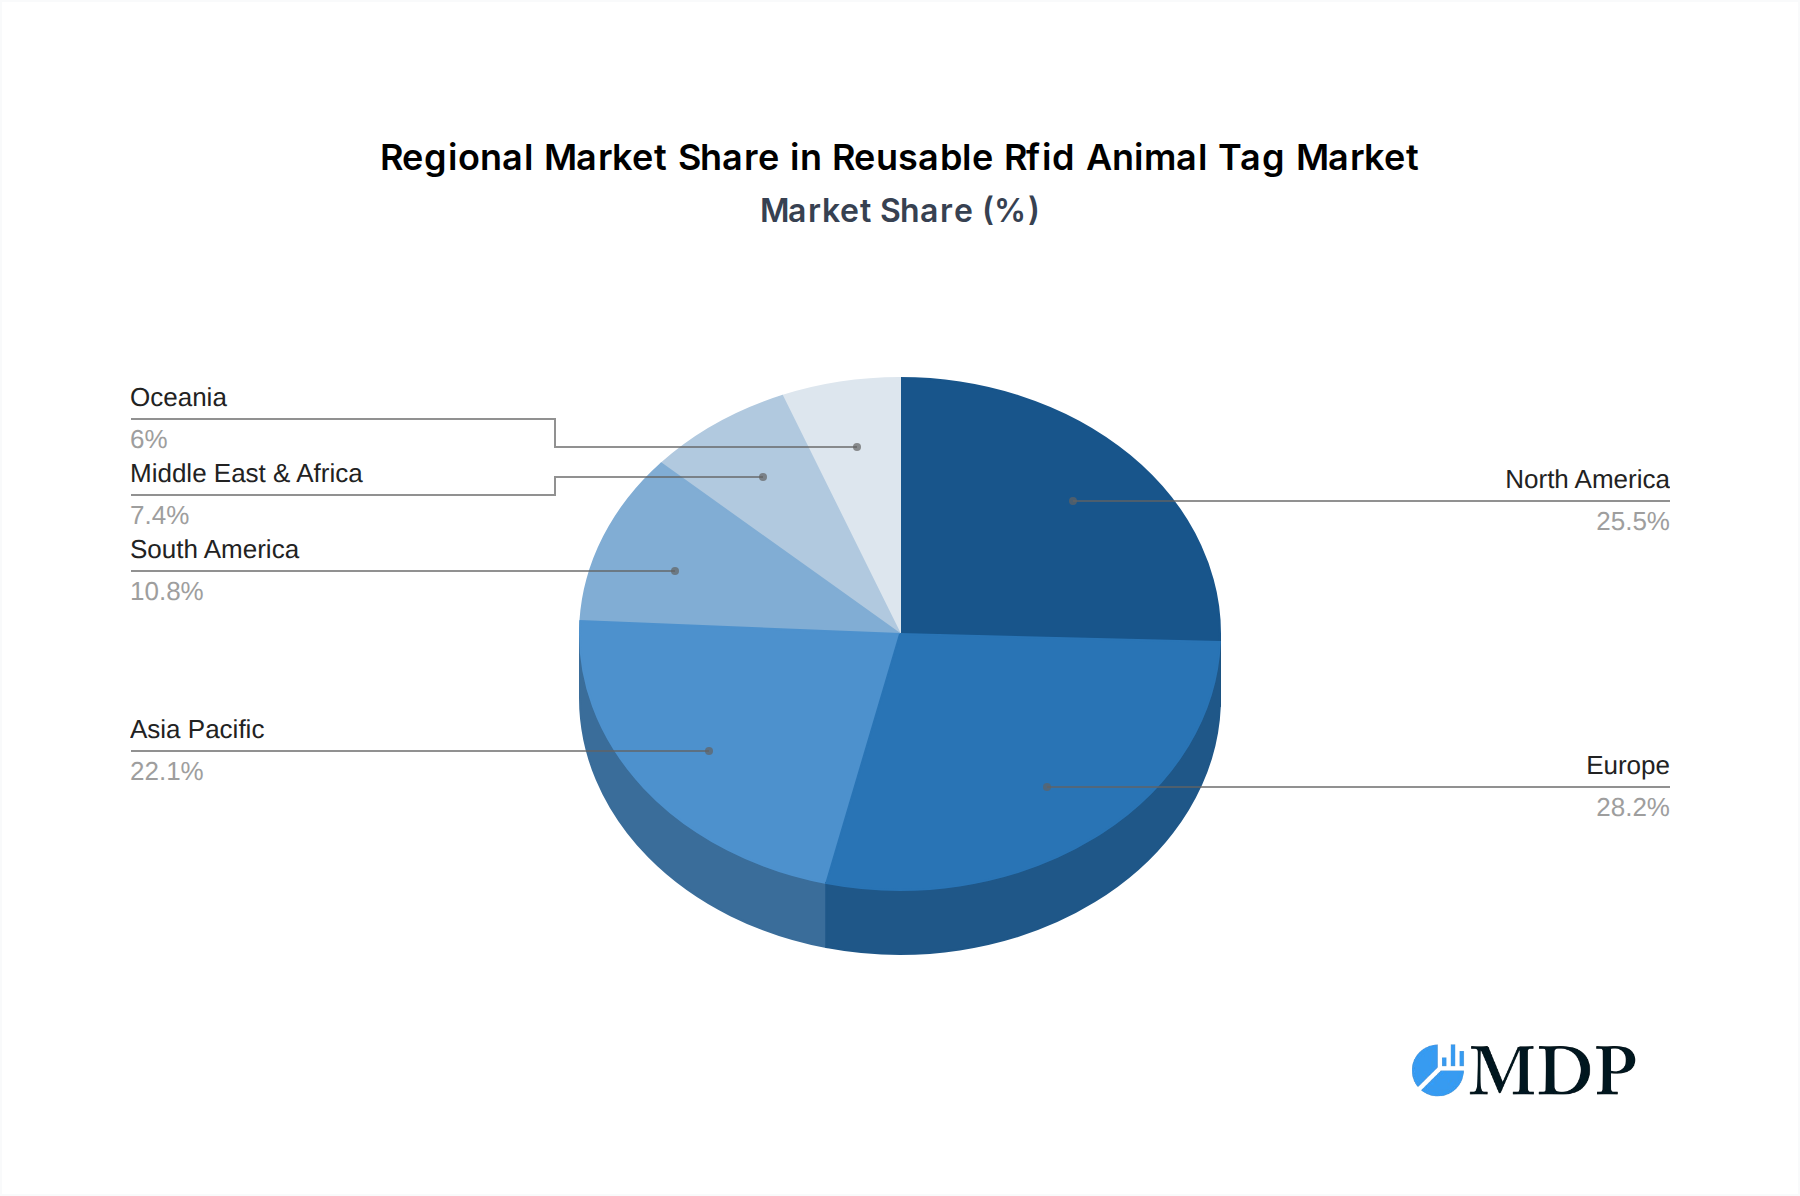
Reusable Rfid Animal Tag Regional Market Share
Geographic Coverage of Reusable Rfid Animal Tag
Reusable Rfid Animal Tag REPORT HIGHLIGHTS
| Aspects | Details |
|---|---|
| Study Period | 2020-2034 |
| Base Year | 2025 |
| Estimated Year | 2026 |
| Forecast Period | 2026-2034 |
| Historical Period | 2020-2025 |
| Growth Rate | CAGR of 3.8% from 2020-2034 |
| Segmentation |
|
Table of Contents
- 1. Introduction
- 1.1. Research Scope
- 1.2. Market Segmentation
- 1.3. Research Methodology
- 1.4. Definitions and Assumptions
- 2. Executive Summary
- 2.1. Introduction
- 3. Market Dynamics
- 3.1. Introduction
- 3.2. Market Drivers
- 3.3. Market Restrains
- 3.4. Market Trends
- 4. Market Factor Analysis
- 4.1. Porters Five Forces
- 4.2. Supply/Value Chain
- 4.3. PESTEL analysis
- 4.4. Market Entropy
- 4.5. Patent/Trademark Analysis
- 5. Global Reusable Rfid Animal Tag Analysis, Insights and Forecast, 2020-2032
- 5.1. Market Analysis, Insights and Forecast - by Application
- 5.1.1. Pig
- 5.1.2. Cattle
- 5.1.3. Sheep
- 5.1.4. Others
- 5.2. Market Analysis, Insights and Forecast - by Type
- 5.2.1. Low Frequency Electronic Ear Tags
- 5.2.2. High Frequency Electronic Ear Tags
- 5.3. Market Analysis, Insights and Forecast - by Region
- 5.3.1. North America
- 5.3.2. South America
- 5.3.3. Europe
- 5.3.4. Middle East & Africa
- 5.3.5. Asia Pacific
- 5.1. Market Analysis, Insights and Forecast - by Application
- 6. North America Reusable Rfid Animal Tag Analysis, Insights and Forecast, 2020-2032
- 6.1. Market Analysis, Insights and Forecast - by Application
- 6.1.1. Pig
- 6.1.2. Cattle
- 6.1.3. Sheep
- 6.1.4. Others
- 6.2. Market Analysis, Insights and Forecast - by Type
- 6.2.1. Low Frequency Electronic Ear Tags
- 6.2.2. High Frequency Electronic Ear Tags
- 6.1. Market Analysis, Insights and Forecast - by Application
- 7. South America Reusable Rfid Animal Tag Analysis, Insights and Forecast, 2020-2032
- 7.1. Market Analysis, Insights and Forecast - by Application
- 7.1.1. Pig
- 7.1.2. Cattle
- 7.1.3. Sheep
- 7.1.4. Others
- 7.2. Market Analysis, Insights and Forecast - by Type
- 7.2.1. Low Frequency Electronic Ear Tags
- 7.2.2. High Frequency Electronic Ear Tags
- 7.1. Market Analysis, Insights and Forecast - by Application
- 8. Europe Reusable Rfid Animal Tag Analysis, Insights and Forecast, 2020-2032
- 8.1. Market Analysis, Insights and Forecast - by Application
- 8.1.1. Pig
- 8.1.2. Cattle
- 8.1.3. Sheep
- 8.1.4. Others
- 8.2. Market Analysis, Insights and Forecast - by Type
- 8.2.1. Low Frequency Electronic Ear Tags
- 8.2.2. High Frequency Electronic Ear Tags
- 8.1. Market Analysis, Insights and Forecast - by Application
- 9. Middle East & Africa Reusable Rfid Animal Tag Analysis, Insights and Forecast, 2020-2032
- 9.1. Market Analysis, Insights and Forecast - by Application
- 9.1.1. Pig
- 9.1.2. Cattle
- 9.1.3. Sheep
- 9.1.4. Others
- 9.2. Market Analysis, Insights and Forecast - by Type
- 9.2.1. Low Frequency Electronic Ear Tags
- 9.2.2. High Frequency Electronic Ear Tags
- 9.1. Market Analysis, Insights and Forecast - by Application
- 10. Asia Pacific Reusable Rfid Animal Tag Analysis, Insights and Forecast, 2020-2032
- 10.1. Market Analysis, Insights and Forecast - by Application
- 10.1.1. Pig
- 10.1.2. Cattle
- 10.1.3. Sheep
- 10.1.4. Others
- 10.2. Market Analysis, Insights and Forecast - by Type
- 10.2.1. Low Frequency Electronic Ear Tags
- 10.2.2. High Frequency Electronic Ear Tags
- 10.1. Market Analysis, Insights and Forecast - by Application
- 11. Competitive Analysis
- 11.1. Global Market Share Analysis 2025
- 11.2. Company Profiles
- 11.2.1 Allflex
- 11.2.1.1. Overview
- 11.2.1.2. Products
- 11.2.1.3. SWOT Analysis
- 11.2.1.4. Recent Developments
- 11.2.1.5. Financials (Based on Availability)
- 11.2.2 Quantified
- 11.2.2.1. Overview
- 11.2.2.2. Products
- 11.2.2.3. SWOT Analysis
- 11.2.2.4. Recent Developments
- 11.2.2.5. Financials (Based on Availability)
- 11.2.3 Ceres Tag
- 11.2.3.1. Overview
- 11.2.3.2. Products
- 11.2.3.3. SWOT Analysis
- 11.2.3.4. Recent Developments
- 11.2.3.5. Financials (Based on Availability)
- 11.2.4 Ardes
- 11.2.4.1. Overview
- 11.2.4.2. Products
- 11.2.4.3. SWOT Analysis
- 11.2.4.4. Recent Developments
- 11.2.4.5. Financials (Based on Availability)
- 11.2.5 Luoyang Laipson Information
- 11.2.5.1. Overview
- 11.2.5.2. Products
- 11.2.5.3. SWOT Analysis
- 11.2.5.4. Recent Developments
- 11.2.5.5. Financials (Based on Availability)
- 11.2.6 Kupsan
- 11.2.6.1. Overview
- 11.2.6.2. Products
- 11.2.6.3. SWOT Analysis
- 11.2.6.4. Recent Developments
- 11.2.6.5. Financials (Based on Availability)
- 11.2.7 Stockbrands
- 11.2.7.1. Overview
- 11.2.7.2. Products
- 11.2.7.3. SWOT Analysis
- 11.2.7.4. Recent Developments
- 11.2.7.5. Financials (Based on Availability)
- 11.2.8 CowManager
- 11.2.8.1. Overview
- 11.2.8.2. Products
- 11.2.8.3. SWOT Analysis
- 11.2.8.4. Recent Developments
- 11.2.8.5. Financials (Based on Availability)
- 11.2.9 HerdDogg
- 11.2.9.1. Overview
- 11.2.9.2. Products
- 11.2.9.3. SWOT Analysis
- 11.2.9.4. Recent Developments
- 11.2.9.5. Financials (Based on Availability)
- 11.2.10 MOOvement
- 11.2.10.1. Overview
- 11.2.10.2. Products
- 11.2.10.3. SWOT Analysis
- 11.2.10.4. Recent Developments
- 11.2.10.5. Financials (Based on Availability)
- 11.2.11 Moocall
- 11.2.11.1. Overview
- 11.2.11.2. Products
- 11.2.11.3. SWOT Analysis
- 11.2.11.4. Recent Developments
- 11.2.11.5. Financials (Based on Availability)
- 11.2.12 Drovers
- 11.2.12.1. Overview
- 11.2.12.2. Products
- 11.2.12.3. SWOT Analysis
- 11.2.12.4. Recent Developments
- 11.2.12.5. Financials (Based on Availability)
- 11.2.13 Caisley International
- 11.2.13.1. Overview
- 11.2.13.2. Products
- 11.2.13.3. SWOT Analysis
- 11.2.13.4. Recent Developments
- 11.2.13.5. Financials (Based on Availability)
- 11.2.14 Datamars
- 11.2.14.1. Overview
- 11.2.14.2. Products
- 11.2.14.3. SWOT Analysis
- 11.2.14.4. Recent Developments
- 11.2.14.5. Financials (Based on Availability)
- 11.2.15 Fofia
- 11.2.15.1. Overview
- 11.2.15.2. Products
- 11.2.15.3. SWOT Analysis
- 11.2.15.4. Recent Developments
- 11.2.15.5. Financials (Based on Availability)
- 11.2.16 Avery Dennison
- 11.2.16.1. Overview
- 11.2.16.2. Products
- 11.2.16.3. SWOT Analysis
- 11.2.16.4. Recent Developments
- 11.2.16.5. Financials (Based on Availability)
- 11.2.1 Allflex
List of Figures
- Figure 1: Global Reusable Rfid Animal Tag Revenue Breakdown (million, %) by Region 2025 & 2033
- Figure 2: North America Reusable Rfid Animal Tag Revenue (million), by Application 2025 & 2033
- Figure 3: North America Reusable Rfid Animal Tag Revenue Share (%), by Application 2025 & 2033
- Figure 4: North America Reusable Rfid Animal Tag Revenue (million), by Type 2025 & 2033
- Figure 5: North America Reusable Rfid Animal Tag Revenue Share (%), by Type 2025 & 2033
- Figure 6: North America Reusable Rfid Animal Tag Revenue (million), by Country 2025 & 2033
- Figure 7: North America Reusable Rfid Animal Tag Revenue Share (%), by Country 2025 & 2033
- Figure 8: South America Reusable Rfid Animal Tag Revenue (million), by Application 2025 & 2033
- Figure 9: South America Reusable Rfid Animal Tag Revenue Share (%), by Application 2025 & 2033
- Figure 10: South America Reusable Rfid Animal Tag Revenue (million), by Type 2025 & 2033
- Figure 11: South America Reusable Rfid Animal Tag Revenue Share (%), by Type 2025 & 2033
- Figure 12: South America Reusable Rfid Animal Tag Revenue (million), by Country 2025 & 2033
- Figure 13: South America Reusable Rfid Animal Tag Revenue Share (%), by Country 2025 & 2033
- Figure 14: Europe Reusable Rfid Animal Tag Revenue (million), by Application 2025 & 2033
- Figure 15: Europe Reusable Rfid Animal Tag Revenue Share (%), by Application 2025 & 2033
- Figure 16: Europe Reusable Rfid Animal Tag Revenue (million), by Type 2025 & 2033
- Figure 17: Europe Reusable Rfid Animal Tag Revenue Share (%), by Type 2025 & 2033
- Figure 18: Europe Reusable Rfid Animal Tag Revenue (million), by Country 2025 & 2033
- Figure 19: Europe Reusable Rfid Animal Tag Revenue Share (%), by Country 2025 & 2033
- Figure 20: Middle East & Africa Reusable Rfid Animal Tag Revenue (million), by Application 2025 & 2033
- Figure 21: Middle East & Africa Reusable Rfid Animal Tag Revenue Share (%), by Application 2025 & 2033
- Figure 22: Middle East & Africa Reusable Rfid Animal Tag Revenue (million), by Type 2025 & 2033
- Figure 23: Middle East & Africa Reusable Rfid Animal Tag Revenue Share (%), by Type 2025 & 2033
- Figure 24: Middle East & Africa Reusable Rfid Animal Tag Revenue (million), by Country 2025 & 2033
- Figure 25: Middle East & Africa Reusable Rfid Animal Tag Revenue Share (%), by Country 2025 & 2033
- Figure 26: Asia Pacific Reusable Rfid Animal Tag Revenue (million), by Application 2025 & 2033
- Figure 27: Asia Pacific Reusable Rfid Animal Tag Revenue Share (%), by Application 2025 & 2033
- Figure 28: Asia Pacific Reusable Rfid Animal Tag Revenue (million), by Type 2025 & 2033
- Figure 29: Asia Pacific Reusable Rfid Animal Tag Revenue Share (%), by Type 2025 & 2033
- Figure 30: Asia Pacific Reusable Rfid Animal Tag Revenue (million), by Country 2025 & 2033
- Figure 31: Asia Pacific Reusable Rfid Animal Tag Revenue Share (%), by Country 2025 & 2033
List of Tables
- Table 1: Global Reusable Rfid Animal Tag Revenue million Forecast, by Application 2020 & 2033
- Table 2: Global Reusable Rfid Animal Tag Revenue million Forecast, by Type 2020 & 2033
- Table 3: Global Reusable Rfid Animal Tag Revenue million Forecast, by Region 2020 & 2033
- Table 4: Global Reusable Rfid Animal Tag Revenue million Forecast, by Application 2020 & 2033
- Table 5: Global Reusable Rfid Animal Tag Revenue million Forecast, by Type 2020 & 2033
- Table 6: Global Reusable Rfid Animal Tag Revenue million Forecast, by Country 2020 & 2033
- Table 7: United States Reusable Rfid Animal Tag Revenue (million) Forecast, by Application 2020 & 2033
- Table 8: Canada Reusable Rfid Animal Tag Revenue (million) Forecast, by Application 2020 & 2033
- Table 9: Mexico Reusable Rfid Animal Tag Revenue (million) Forecast, by Application 2020 & 2033
- Table 10: Global Reusable Rfid Animal Tag Revenue million Forecast, by Application 2020 & 2033
- Table 11: Global Reusable Rfid Animal Tag Revenue million Forecast, by Type 2020 & 2033
- Table 12: Global Reusable Rfid Animal Tag Revenue million Forecast, by Country 2020 & 2033
- Table 13: Brazil Reusable Rfid Animal Tag Revenue (million) Forecast, by Application 2020 & 2033
- Table 14: Argentina Reusable Rfid Animal Tag Revenue (million) Forecast, by Application 2020 & 2033
- Table 15: Rest of South America Reusable Rfid Animal Tag Revenue (million) Forecast, by Application 2020 & 2033
- Table 16: Global Reusable Rfid Animal Tag Revenue million Forecast, by Application 2020 & 2033
- Table 17: Global Reusable Rfid Animal Tag Revenue million Forecast, by Type 2020 & 2033
- Table 18: Global Reusable Rfid Animal Tag Revenue million Forecast, by Country 2020 & 2033
- Table 19: United Kingdom Reusable Rfid Animal Tag Revenue (million) Forecast, by Application 2020 & 2033
- Table 20: Germany Reusable Rfid Animal Tag Revenue (million) Forecast, by Application 2020 & 2033
- Table 21: France Reusable Rfid Animal Tag Revenue (million) Forecast, by Application 2020 & 2033
- Table 22: Italy Reusable Rfid Animal Tag Revenue (million) Forecast, by Application 2020 & 2033
- Table 23: Spain Reusable Rfid Animal Tag Revenue (million) Forecast, by Application 2020 & 2033
- Table 24: Russia Reusable Rfid Animal Tag Revenue (million) Forecast, by Application 2020 & 2033
- Table 25: Benelux Reusable Rfid Animal Tag Revenue (million) Forecast, by Application 2020 & 2033
- Table 26: Nordics Reusable Rfid Animal Tag Revenue (million) Forecast, by Application 2020 & 2033
- Table 27: Rest of Europe Reusable Rfid Animal Tag Revenue (million) Forecast, by Application 2020 & 2033
- Table 28: Global Reusable Rfid Animal Tag Revenue million Forecast, by Application 2020 & 2033
- Table 29: Global Reusable Rfid Animal Tag Revenue million Forecast, by Type 2020 & 2033
- Table 30: Global Reusable Rfid Animal Tag Revenue million Forecast, by Country 2020 & 2033
- Table 31: Turkey Reusable Rfid Animal Tag Revenue (million) Forecast, by Application 2020 & 2033
- Table 32: Israel Reusable Rfid Animal Tag Revenue (million) Forecast, by Application 2020 & 2033
- Table 33: GCC Reusable Rfid Animal Tag Revenue (million) Forecast, by Application 2020 & 2033
- Table 34: North Africa Reusable Rfid Animal Tag Revenue (million) Forecast, by Application 2020 & 2033
- Table 35: South Africa Reusable Rfid Animal Tag Revenue (million) Forecast, by Application 2020 & 2033
- Table 36: Rest of Middle East & Africa Reusable Rfid Animal Tag Revenue (million) Forecast, by Application 2020 & 2033
- Table 37: Global Reusable Rfid Animal Tag Revenue million Forecast, by Application 2020 & 2033
- Table 38: Global Reusable Rfid Animal Tag Revenue million Forecast, by Type 2020 & 2033
- Table 39: Global Reusable Rfid Animal Tag Revenue million Forecast, by Country 2020 & 2033
- Table 40: China Reusable Rfid Animal Tag Revenue (million) Forecast, by Application 2020 & 2033
- Table 41: India Reusable Rfid Animal Tag Revenue (million) Forecast, by Application 2020 & 2033
- Table 42: Japan Reusable Rfid Animal Tag Revenue (million) Forecast, by Application 2020 & 2033
- Table 43: South Korea Reusable Rfid Animal Tag Revenue (million) Forecast, by Application 2020 & 2033
- Table 44: ASEAN Reusable Rfid Animal Tag Revenue (million) Forecast, by Application 2020 & 2033
- Table 45: Oceania Reusable Rfid Animal Tag Revenue (million) Forecast, by Application 2020 & 2033
- Table 46: Rest of Asia Pacific Reusable Rfid Animal Tag Revenue (million) Forecast, by Application 2020 & 2033
Frequently Asked Questions
1. What is the projected Compound Annual Growth Rate (CAGR) of the Reusable Rfid Animal Tag?
The projected CAGR is approximately 3.8%.
2. Which companies are prominent players in the Reusable Rfid Animal Tag?
Key companies in the market include Allflex, Quantified, Ceres Tag, Ardes, Luoyang Laipson Information, Kupsan, Stockbrands, CowManager, HerdDogg, MOOvement, Moocall, Drovers, Caisley International, Datamars, Fofia, Avery Dennison.
3. What are the main segments of the Reusable Rfid Animal Tag?
The market segments include Application, Type.
4. Can you provide details about the market size?
The market size is estimated to be USD 625 million as of 2022.
5. What are some drivers contributing to market growth?
N/A
6. What are the notable trends driving market growth?
N/A
7. Are there any restraints impacting market growth?
N/A
8. Can you provide examples of recent developments in the market?
N/A
9. What pricing options are available for accessing the report?
Pricing options include single-user, multi-user, and enterprise licenses priced at USD 2900.00, USD 4350.00, and USD 5800.00 respectively.
10. Is the market size provided in terms of value or volume?
The market size is provided in terms of value, measured in million.
11. Are there any specific market keywords associated with the report?
Yes, the market keyword associated with the report is "Reusable Rfid Animal Tag," which aids in identifying and referencing the specific market segment covered.
12. How do I determine which pricing option suits my needs best?
The pricing options vary based on user requirements and access needs. Individual users may opt for single-user licenses, while businesses requiring broader access may choose multi-user or enterprise licenses for cost-effective access to the report.
13. Are there any additional resources or data provided in the Reusable Rfid Animal Tag report?
While the report offers comprehensive insights, it's advisable to review the specific contents or supplementary materials provided to ascertain if additional resources or data are available.
14. How can I stay updated on further developments or reports in the Reusable Rfid Animal Tag?
To stay informed about further developments, trends, and reports in the Reusable Rfid Animal Tag, consider subscribing to industry newsletters, following relevant companies and organizations, or regularly checking reputable industry news sources and publications.
Methodology
Step 1 - Identification of Relevant Samples Size from Population Database


Step 2 - Approaches for Defining Global Market Size (Value, Volume* & Price*)

Note*: In applicable scenarios
Step 3 - Data Sources
Primary Research
- Web Analytics
- Survey Reports
- Research Institute
- Latest Research Reports
- Opinion Leaders
Secondary Research
- Annual Reports
- White Paper
- Latest Press Release
- Industry Association
- Paid Database
- Investor Presentations

Step 4 - Data Triangulation
Involves using different sources of information in order to increase the validity of a study
These sources are likely to be stakeholders in a program - participants, other researchers, program staff, other community members, and so on.
Then we put all data in single framework & apply various statistical tools to find out the dynamic on the market.
During the analysis stage, feedback from the stakeholder groups would be compared to determine areas of agreement as well as areas of divergence