

Key Insights
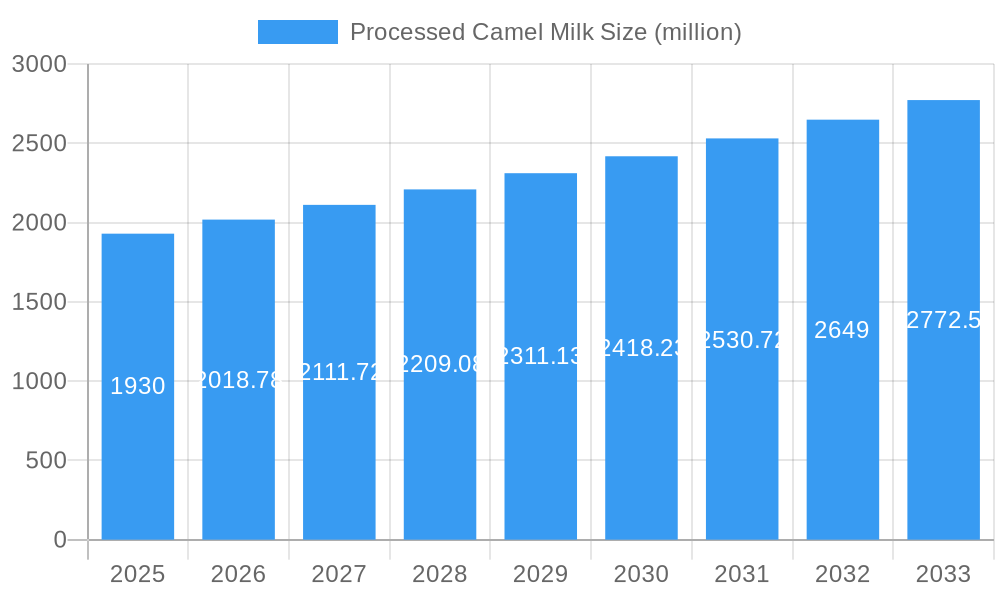
The processed camel milk market, valued at approximately $1930 million in 2025, is projected to experience robust growth, exhibiting a Compound Annual Growth Rate (CAGR) of 4.6% from 2025 to 2033. This expansion is driven by several key factors. Increasing consumer awareness of camel milk's unique nutritional benefits, including its high protein content, lower lactose levels compared to cow's milk, and potential health advantages for individuals with lactose intolerance or certain allergies, fuels significant demand. The rising prevalence of health-conscious consumers actively seeking alternative dairy options further contributes to market growth. Moreover, growing investments in research and development are leading to innovative product formulations, such as camel milk-based yogurts, cheeses, and powders, expanding the product portfolio and attracting a broader consumer base. Key players like Desert Farms, Al Nassma, and Camelicious are instrumental in driving this growth through product diversification and strategic expansion into new markets.
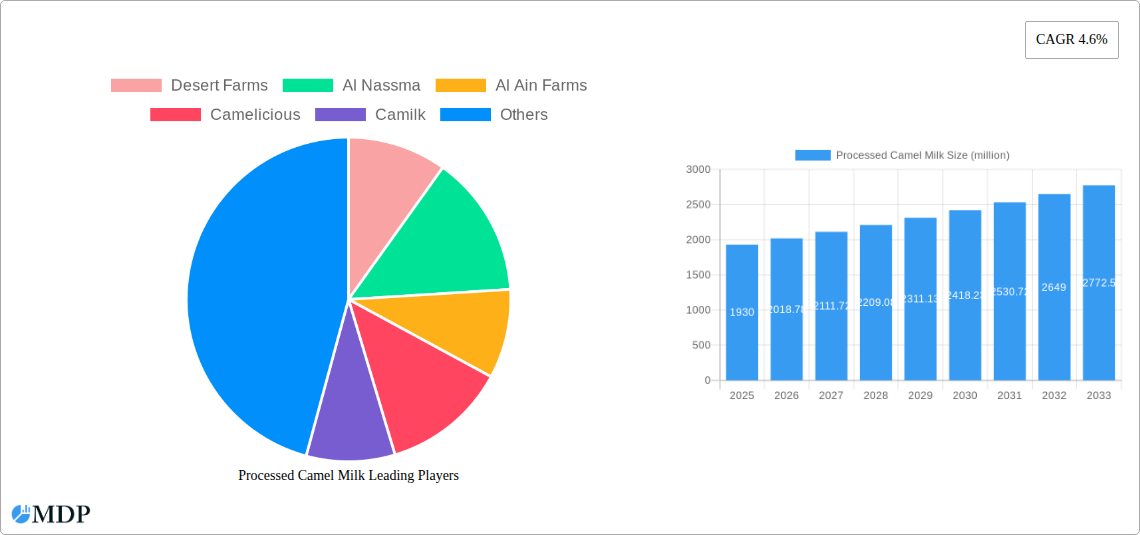
Processed Camel Milk Market Size (In Billion)
However, challenges exist. The relatively high cost of production compared to cow's milk remains a significant restraint, potentially limiting market penetration, particularly in price-sensitive regions. Furthermore, limited consumer awareness in certain regions and a lack of established distribution channels in some emerging markets present obstacles to market expansion. Despite these challenges, the inherent health benefits, growing consumer preference for healthier alternatives, and innovative product development initiatives strongly position the processed camel milk market for sustained growth in the forecast period. The market is expected to see increased competition as smaller players continue to enter the market and existing players expand their product offerings. Geographic expansion, particularly in regions with a strong focus on health and wellness, will play a vital role in shaping the future landscape of this market.
Processed Camel Milk Company Market Share
Unlock the Untapped Potential: A Comprehensive Report on the Processed Camel Milk Market (2019-2033)
This in-depth report provides a comprehensive analysis of the global processed camel milk market, projecting a market value exceeding $XX million by 2033. It offers invaluable insights for industry stakeholders, investors, and entrepreneurs seeking to capitalize on the burgeoning demand for this unique and nutritious product. The study covers the period 2019-2033, with 2025 as the base and estimated year. Key players such as Desert Farms, Al Nassma, Al Ain Farms, Camelicious, Camilk, Amul, Nuug Camel, VITAL Camel Milk, and Tiviski Dairy are analyzed in detail.
Processed Camel Milk Market Dynamics & Concentration
The processed camel milk market is experiencing significant growth, driven by increasing consumer awareness of its health benefits and unique nutritional profile. Market concentration is currently moderate, with a few key players holding a significant share. However, the market is expected to become more competitive as new entrants emerge. Innovation is a key driver, with companies focusing on developing new products and expanding into new markets. Regulatory frameworks vary across regions, impacting market access and growth potential. Product substitutes, such as cow's milk and other dairy alternatives, pose a competitive challenge, although the unique properties of camel milk are proving a significant differentiator.
- Market Share (2025 Estimate): Desert Farms: 15%; Al Nassma: 12%; Al Ain Farms: 10%; Others: 63%. (Note: These figures are estimates.)
- M&A Activity (2019-2024): xx deals, indicating increasing consolidation within the sector.
- Innovation Drivers: Product diversification (e.g., flavored milk, yogurt, cheese), improved processing techniques, sustainable sourcing.
- Regulatory Landscape: Varying regulations across different countries impact production, labeling, and distribution.
Processed Camel Milk Industry Trends & Analysis
The global processed camel milk market is poised for significant expansion, with a projected Compound Annual Growth Rate (CAGR) of xx% during the forecast period (2025-2033). This growth is primarily fueled by rising consumer demand driven by increasing awareness of camel milk's health benefits, including its hypoallergenic nature and high nutritional value. Technological advancements in processing and preservation are improving product quality and extending shelf life. Consumer preferences are shifting towards healthier and more natural food choices, creating a favorable environment for camel milk products. Intense competition among existing players and the entry of new players are further shaping market dynamics. Market penetration remains relatively low, indicating substantial untapped potential for growth.
Leading Markets & Segments in Processed Camel Milk
The Middle East and North Africa (MENA) region currently dominates the processed camel milk market, owing to the high availability of camels and strong cultural acceptance of camel milk. However, growing consumer interest in other regions, particularly in Asia and parts of Europe, is creating new market opportunities. Specific country-level analyses show significant potential in countries with established dairy consumption patterns and growing awareness of alternative dairy options.
- Key Drivers in MENA:
- Established camel farming industry
- Strong cultural acceptance of camel milk
- Government support for camel milk production
- Key Drivers in Emerging Markets:
- Rising health consciousness
- Growing demand for hypoallergenic dairy alternatives
- Increased availability through e-commerce and specialized retailers.
Processed Camel Milk Product Developments
Recent product innovations include the development of long-shelf-life UHT camel milk, flavored camel milk drinks targeting diverse consumer preferences, and the introduction of camel milk-based yogurt and cheese. These developments cater to growing consumer demand and broaden the market appeal of camel milk beyond its traditional form. Technological advancements in processing techniques enhance both product quality and shelf life, improving product marketability.
Key Drivers of Processed Camel Milk Growth
Several factors are contributing to the growth of the processed camel milk market. Technological advancements in processing and packaging are improving product quality and shelf life. Increasing consumer awareness of the health benefits of camel milk is driving demand. Supportive government policies in some regions are encouraging camel milk production. Furthermore, growing investment in research and development is leading to product innovation and market expansion.
Challenges in the Processed Camel Milk Market
The processed camel milk market faces several challenges. Supply chain limitations and inconsistent supply of raw camel milk hinder expansion. The high production costs of camel milk, compared to cow's milk, may limit affordability for some consumers. Regulatory hurdles and varied standards across different countries create difficulties for market entry and expansion. Intense competition from established dairy players and alternative dairy products creates a challenging market environment. These challenges can lead to reduced market growth and profitability for some players.
Emerging Opportunities in Processed Camel Milk
The processed camel milk market offers significant long-term growth potential. Technological innovations in processing and preservation are expected to further improve product quality and shelf life. Strategic partnerships and collaborations between camel milk producers and food and beverage companies are creating new market access channels. Expanding into new geographical markets with strong consumer interest and growing health consciousness offers a significant opportunity for expansion.
Leading Players in the Processed Camel Milk Sector
- Desert Farms
- Al Nassma
- Al Ain Farms
- Camelicious
- Camilk
- Amul
- Nuug Camel
- VITAL Camel Milk
- Tiviski Dairy
Key Milestones in Processed Camel Milk Industry
- 2020: Several companies launched new product lines, including flavored camel milk and camel milk yogurt.
- 2022: Increased investment in camel milk processing technologies.
- 2023: Several significant partnerships forged between camel milk producers and international distributors.
- 2024: Regulatory changes in several key markets facilitated easier market access for camel milk products.
Strategic Outlook for Processed Camel Milk Market
The processed camel milk market is expected to witness substantial growth over the forecast period. Continued innovation, strategic partnerships, expansion into new markets, and effective regulatory frameworks will be key growth accelerators. Companies focusing on product diversification, sustainable sourcing, and superior quality will be well-positioned to capture a larger share of the growing market. The unique health benefits and nutritional profile of camel milk will continue to drive consumer demand and market expansion in the coming years.
Processed Camel Milk Segmentation
-
1. Application
- 1.1. Online Sales
- 1.2. Offline Sales
-
2. Type
- 2.1. Bottled
- 2.2. Canned
Processed Camel Milk Segmentation By Geography
-
1. North America
- 1.1. United States
- 1.2. Canada
- 1.3. Mexico
-
2. South America
- 2.1. Brazil
- 2.2. Argentina
- 2.3. Rest of South America
-
3. Europe
- 3.1. United Kingdom
- 3.2. Germany
- 3.3. France
- 3.4. Italy
- 3.5. Spain
- 3.6. Russia
- 3.7. Benelux
- 3.8. Nordics
- 3.9. Rest of Europe
-
4. Middle East & Africa
- 4.1. Turkey
- 4.2. Israel
- 4.3. GCC
- 4.4. North Africa
- 4.5. South Africa
- 4.6. Rest of Middle East & Africa
-
5. Asia Pacific
- 5.1. China
- 5.2. India
- 5.3. Japan
- 5.4. South Korea
- 5.5. ASEAN
- 5.6. Oceania
- 5.7. Rest of Asia Pacific
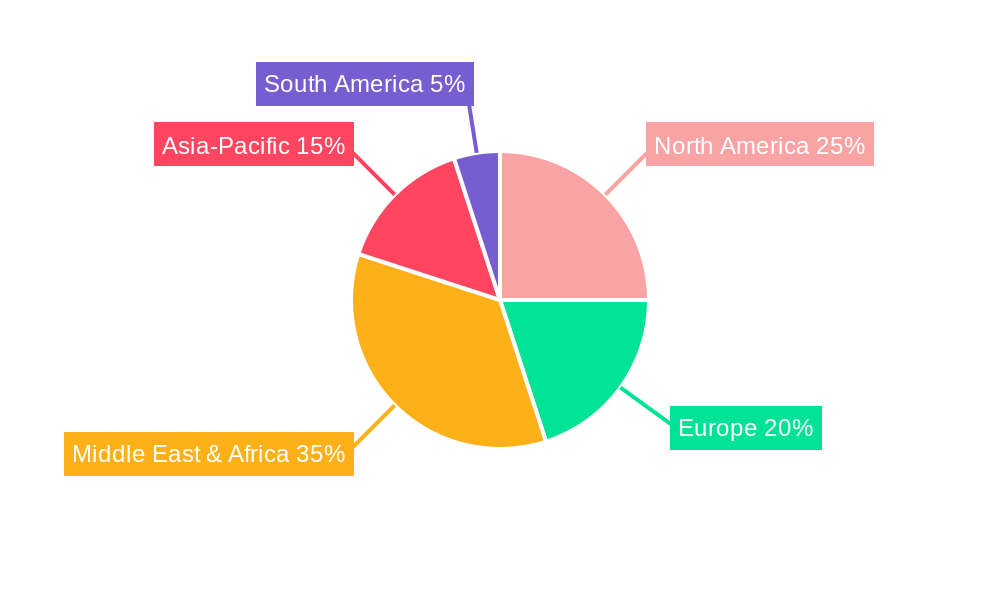
Processed Camel Milk Regional Market Share
Geographic Coverage of Processed Camel Milk
Processed Camel Milk REPORT HIGHLIGHTS
| Aspects | Details |
|---|---|
| Study Period | 2020-2034 |
| Base Year | 2025 |
| Estimated Year | 2026 |
| Forecast Period | 2026-2034 |
| Historical Period | 2020-2025 |
| Growth Rate | CAGR of 4.6% from 2020-2034 |
| Segmentation |
|
Table of Contents
- 1. Introduction
- 1.1. Research Scope
- 1.2. Market Segmentation
- 1.3. Research Methodology
- 1.4. Definitions and Assumptions
- 2. Executive Summary
- 2.1. Introduction
- 3. Market Dynamics
- 3.1. Introduction
- 3.2. Market Drivers
- 3.3. Market Restrains
- 3.4. Market Trends
- 4. Market Factor Analysis
- 4.1. Porters Five Forces
- 4.2. Supply/Value Chain
- 4.3. PESTEL analysis
- 4.4. Market Entropy
- 4.5. Patent/Trademark Analysis
- 5. Global Processed Camel Milk Analysis, Insights and Forecast, 2020-2032
- 5.1. Market Analysis, Insights and Forecast - by Application
- 5.1.1. Online Sales
- 5.1.2. Offline Sales
- 5.2. Market Analysis, Insights and Forecast - by Type
- 5.2.1. Bottled
- 5.2.2. Canned
- 5.3. Market Analysis, Insights and Forecast - by Region
- 5.3.1. North America
- 5.3.2. South America
- 5.3.3. Europe
- 5.3.4. Middle East & Africa
- 5.3.5. Asia Pacific
- 5.1. Market Analysis, Insights and Forecast - by Application
- 6. North America Processed Camel Milk Analysis, Insights and Forecast, 2020-2032
- 6.1. Market Analysis, Insights and Forecast - by Application
- 6.1.1. Online Sales
- 6.1.2. Offline Sales
- 6.2. Market Analysis, Insights and Forecast - by Type
- 6.2.1. Bottled
- 6.2.2. Canned
- 6.1. Market Analysis, Insights and Forecast - by Application
- 7. South America Processed Camel Milk Analysis, Insights and Forecast, 2020-2032
- 7.1. Market Analysis, Insights and Forecast - by Application
- 7.1.1. Online Sales
- 7.1.2. Offline Sales
- 7.2. Market Analysis, Insights and Forecast - by Type
- 7.2.1. Bottled
- 7.2.2. Canned
- 7.1. Market Analysis, Insights and Forecast - by Application
- 8. Europe Processed Camel Milk Analysis, Insights and Forecast, 2020-2032
- 8.1. Market Analysis, Insights and Forecast - by Application
- 8.1.1. Online Sales
- 8.1.2. Offline Sales
- 8.2. Market Analysis, Insights and Forecast - by Type
- 8.2.1. Bottled
- 8.2.2. Canned
- 8.1. Market Analysis, Insights and Forecast - by Application
- 9. Middle East & Africa Processed Camel Milk Analysis, Insights and Forecast, 2020-2032
- 9.1. Market Analysis, Insights and Forecast - by Application
- 9.1.1. Online Sales
- 9.1.2. Offline Sales
- 9.2. Market Analysis, Insights and Forecast - by Type
- 9.2.1. Bottled
- 9.2.2. Canned
- 9.1. Market Analysis, Insights and Forecast - by Application
- 10. Asia Pacific Processed Camel Milk Analysis, Insights and Forecast, 2020-2032
- 10.1. Market Analysis, Insights and Forecast - by Application
- 10.1.1. Online Sales
- 10.1.2. Offline Sales
- 10.2. Market Analysis, Insights and Forecast - by Type
- 10.2.1. Bottled
- 10.2.2. Canned
- 10.1. Market Analysis, Insights and Forecast - by Application
- 11. Competitive Analysis
- 11.1. Global Market Share Analysis 2025
- 11.2. Company Profiles
- 11.2.1 Desert Farms
- 11.2.1.1. Overview
- 11.2.1.2. Products
- 11.2.1.3. SWOT Analysis
- 11.2.1.4. Recent Developments
- 11.2.1.5. Financials (Based on Availability)
- 11.2.2 Al Nassma
- 11.2.2.1. Overview
- 11.2.2.2. Products
- 11.2.2.3. SWOT Analysis
- 11.2.2.4. Recent Developments
- 11.2.2.5. Financials (Based on Availability)
- 11.2.3 Al Ain Farms
- 11.2.3.1. Overview
- 11.2.3.2. Products
- 11.2.3.3. SWOT Analysis
- 11.2.3.4. Recent Developments
- 11.2.3.5. Financials (Based on Availability)
- 11.2.4 Camelicious
- 11.2.4.1. Overview
- 11.2.4.2. Products
- 11.2.4.3. SWOT Analysis
- 11.2.4.4. Recent Developments
- 11.2.4.5. Financials (Based on Availability)
- 11.2.5 Camilk
- 11.2.5.1. Overview
- 11.2.5.2. Products
- 11.2.5.3. SWOT Analysis
- 11.2.5.4. Recent Developments
- 11.2.5.5. Financials (Based on Availability)
- 11.2.6 Amul
- 11.2.6.1. Overview
- 11.2.6.2. Products
- 11.2.6.3. SWOT Analysis
- 11.2.6.4. Recent Developments
- 11.2.6.5. Financials (Based on Availability)
- 11.2.7 Nuug Camel
- 11.2.7.1. Overview
- 11.2.7.2. Products
- 11.2.7.3. SWOT Analysis
- 11.2.7.4. Recent Developments
- 11.2.7.5. Financials (Based on Availability)
- 11.2.8 VITAL Camel Milk
- 11.2.8.1. Overview
- 11.2.8.2. Products
- 11.2.8.3. SWOT Analysis
- 11.2.8.4. Recent Developments
- 11.2.8.5. Financials (Based on Availability)
- 11.2.9 Tiviski Dairy
- 11.2.9.1. Overview
- 11.2.9.2. Products
- 11.2.9.3. SWOT Analysis
- 11.2.9.4. Recent Developments
- 11.2.9.5. Financials (Based on Availability)
- 11.2.1 Desert Farms
List of Figures
- Figure 1: Global Processed Camel Milk Revenue Breakdown (million, %) by Region 2025 & 2033
- Figure 2: Global Processed Camel Milk Volume Breakdown (K, %) by Region 2025 & 2033
- Figure 3: North America Processed Camel Milk Revenue (million), by Application 2025 & 2033
- Figure 4: North America Processed Camel Milk Volume (K), by Application 2025 & 2033
- Figure 5: North America Processed Camel Milk Revenue Share (%), by Application 2025 & 2033
- Figure 6: North America Processed Camel Milk Volume Share (%), by Application 2025 & 2033
- Figure 7: North America Processed Camel Milk Revenue (million), by Type 2025 & 2033
- Figure 8: North America Processed Camel Milk Volume (K), by Type 2025 & 2033
- Figure 9: North America Processed Camel Milk Revenue Share (%), by Type 2025 & 2033
- Figure 10: North America Processed Camel Milk Volume Share (%), by Type 2025 & 2033
- Figure 11: North America Processed Camel Milk Revenue (million), by Country 2025 & 2033
- Figure 12: North America Processed Camel Milk Volume (K), by Country 2025 & 2033
- Figure 13: North America Processed Camel Milk Revenue Share (%), by Country 2025 & 2033
- Figure 14: North America Processed Camel Milk Volume Share (%), by Country 2025 & 2033
- Figure 15: South America Processed Camel Milk Revenue (million), by Application 2025 & 2033
- Figure 16: South America Processed Camel Milk Volume (K), by Application 2025 & 2033
- Figure 17: South America Processed Camel Milk Revenue Share (%), by Application 2025 & 2033
- Figure 18: South America Processed Camel Milk Volume Share (%), by Application 2025 & 2033
- Figure 19: South America Processed Camel Milk Revenue (million), by Type 2025 & 2033
- Figure 20: South America Processed Camel Milk Volume (K), by Type 2025 & 2033
- Figure 21: South America Processed Camel Milk Revenue Share (%), by Type 2025 & 2033
- Figure 22: South America Processed Camel Milk Volume Share (%), by Type 2025 & 2033
- Figure 23: South America Processed Camel Milk Revenue (million), by Country 2025 & 2033
- Figure 24: South America Processed Camel Milk Volume (K), by Country 2025 & 2033
- Figure 25: South America Processed Camel Milk Revenue Share (%), by Country 2025 & 2033
- Figure 26: South America Processed Camel Milk Volume Share (%), by Country 2025 & 2033
- Figure 27: Europe Processed Camel Milk Revenue (million), by Application 2025 & 2033
- Figure 28: Europe Processed Camel Milk Volume (K), by Application 2025 & 2033
- Figure 29: Europe Processed Camel Milk Revenue Share (%), by Application 2025 & 2033
- Figure 30: Europe Processed Camel Milk Volume Share (%), by Application 2025 & 2033
- Figure 31: Europe Processed Camel Milk Revenue (million), by Type 2025 & 2033
- Figure 32: Europe Processed Camel Milk Volume (K), by Type 2025 & 2033
- Figure 33: Europe Processed Camel Milk Revenue Share (%), by Type 2025 & 2033
- Figure 34: Europe Processed Camel Milk Volume Share (%), by Type 2025 & 2033
- Figure 35: Europe Processed Camel Milk Revenue (million), by Country 2025 & 2033
- Figure 36: Europe Processed Camel Milk Volume (K), by Country 2025 & 2033
- Figure 37: Europe Processed Camel Milk Revenue Share (%), by Country 2025 & 2033
- Figure 38: Europe Processed Camel Milk Volume Share (%), by Country 2025 & 2033
- Figure 39: Middle East & Africa Processed Camel Milk Revenue (million), by Application 2025 & 2033
- Figure 40: Middle East & Africa Processed Camel Milk Volume (K), by Application 2025 & 2033
- Figure 41: Middle East & Africa Processed Camel Milk Revenue Share (%), by Application 2025 & 2033
- Figure 42: Middle East & Africa Processed Camel Milk Volume Share (%), by Application 2025 & 2033
- Figure 43: Middle East & Africa Processed Camel Milk Revenue (million), by Type 2025 & 2033
- Figure 44: Middle East & Africa Processed Camel Milk Volume (K), by Type 2025 & 2033
- Figure 45: Middle East & Africa Processed Camel Milk Revenue Share (%), by Type 2025 & 2033
- Figure 46: Middle East & Africa Processed Camel Milk Volume Share (%), by Type 2025 & 2033
- Figure 47: Middle East & Africa Processed Camel Milk Revenue (million), by Country 2025 & 2033
- Figure 48: Middle East & Africa Processed Camel Milk Volume (K), by Country 2025 & 2033
- Figure 49: Middle East & Africa Processed Camel Milk Revenue Share (%), by Country 2025 & 2033
- Figure 50: Middle East & Africa Processed Camel Milk Volume Share (%), by Country 2025 & 2033
- Figure 51: Asia Pacific Processed Camel Milk Revenue (million), by Application 2025 & 2033
- Figure 52: Asia Pacific Processed Camel Milk Volume (K), by Application 2025 & 2033
- Figure 53: Asia Pacific Processed Camel Milk Revenue Share (%), by Application 2025 & 2033
- Figure 54: Asia Pacific Processed Camel Milk Volume Share (%), by Application 2025 & 2033
- Figure 55: Asia Pacific Processed Camel Milk Revenue (million), by Type 2025 & 2033
- Figure 56: Asia Pacific Processed Camel Milk Volume (K), by Type 2025 & 2033
- Figure 57: Asia Pacific Processed Camel Milk Revenue Share (%), by Type 2025 & 2033
- Figure 58: Asia Pacific Processed Camel Milk Volume Share (%), by Type 2025 & 2033
- Figure 59: Asia Pacific Processed Camel Milk Revenue (million), by Country 2025 & 2033
- Figure 60: Asia Pacific Processed Camel Milk Volume (K), by Country 2025 & 2033
- Figure 61: Asia Pacific Processed Camel Milk Revenue Share (%), by Country 2025 & 2033
- Figure 62: Asia Pacific Processed Camel Milk Volume Share (%), by Country 2025 & 2033
List of Tables
- Table 1: Global Processed Camel Milk Revenue million Forecast, by Application 2020 & 2033
- Table 2: Global Processed Camel Milk Volume K Forecast, by Application 2020 & 2033
- Table 3: Global Processed Camel Milk Revenue million Forecast, by Type 2020 & 2033
- Table 4: Global Processed Camel Milk Volume K Forecast, by Type 2020 & 2033
- Table 5: Global Processed Camel Milk Revenue million Forecast, by Region 2020 & 2033
- Table 6: Global Processed Camel Milk Volume K Forecast, by Region 2020 & 2033
- Table 7: Global Processed Camel Milk Revenue million Forecast, by Application 2020 & 2033
- Table 8: Global Processed Camel Milk Volume K Forecast, by Application 2020 & 2033
- Table 9: Global Processed Camel Milk Revenue million Forecast, by Type 2020 & 2033
- Table 10: Global Processed Camel Milk Volume K Forecast, by Type 2020 & 2033
- Table 11: Global Processed Camel Milk Revenue million Forecast, by Country 2020 & 2033
- Table 12: Global Processed Camel Milk Volume K Forecast, by Country 2020 & 2033
- Table 13: United States Processed Camel Milk Revenue (million) Forecast, by Application 2020 & 2033
- Table 14: United States Processed Camel Milk Volume (K) Forecast, by Application 2020 & 2033
- Table 15: Canada Processed Camel Milk Revenue (million) Forecast, by Application 2020 & 2033
- Table 16: Canada Processed Camel Milk Volume (K) Forecast, by Application 2020 & 2033
- Table 17: Mexico Processed Camel Milk Revenue (million) Forecast, by Application 2020 & 2033
- Table 18: Mexico Processed Camel Milk Volume (K) Forecast, by Application 2020 & 2033
- Table 19: Global Processed Camel Milk Revenue million Forecast, by Application 2020 & 2033
- Table 20: Global Processed Camel Milk Volume K Forecast, by Application 2020 & 2033
- Table 21: Global Processed Camel Milk Revenue million Forecast, by Type 2020 & 2033
- Table 22: Global Processed Camel Milk Volume K Forecast, by Type 2020 & 2033
- Table 23: Global Processed Camel Milk Revenue million Forecast, by Country 2020 & 2033
- Table 24: Global Processed Camel Milk Volume K Forecast, by Country 2020 & 2033
- Table 25: Brazil Processed Camel Milk Revenue (million) Forecast, by Application 2020 & 2033
- Table 26: Brazil Processed Camel Milk Volume (K) Forecast, by Application 2020 & 2033
- Table 27: Argentina Processed Camel Milk Revenue (million) Forecast, by Application 2020 & 2033
- Table 28: Argentina Processed Camel Milk Volume (K) Forecast, by Application 2020 & 2033
- Table 29: Rest of South America Processed Camel Milk Revenue (million) Forecast, by Application 2020 & 2033
- Table 30: Rest of South America Processed Camel Milk Volume (K) Forecast, by Application 2020 & 2033
- Table 31: Global Processed Camel Milk Revenue million Forecast, by Application 2020 & 2033
- Table 32: Global Processed Camel Milk Volume K Forecast, by Application 2020 & 2033
- Table 33: Global Processed Camel Milk Revenue million Forecast, by Type 2020 & 2033
- Table 34: Global Processed Camel Milk Volume K Forecast, by Type 2020 & 2033
- Table 35: Global Processed Camel Milk Revenue million Forecast, by Country 2020 & 2033
- Table 36: Global Processed Camel Milk Volume K Forecast, by Country 2020 & 2033
- Table 37: United Kingdom Processed Camel Milk Revenue (million) Forecast, by Application 2020 & 2033
- Table 38: United Kingdom Processed Camel Milk Volume (K) Forecast, by Application 2020 & 2033
- Table 39: Germany Processed Camel Milk Revenue (million) Forecast, by Application 2020 & 2033
- Table 40: Germany Processed Camel Milk Volume (K) Forecast, by Application 2020 & 2033
- Table 41: France Processed Camel Milk Revenue (million) Forecast, by Application 2020 & 2033
- Table 42: France Processed Camel Milk Volume (K) Forecast, by Application 2020 & 2033
- Table 43: Italy Processed Camel Milk Revenue (million) Forecast, by Application 2020 & 2033
- Table 44: Italy Processed Camel Milk Volume (K) Forecast, by Application 2020 & 2033
- Table 45: Spain Processed Camel Milk Revenue (million) Forecast, by Application 2020 & 2033
- Table 46: Spain Processed Camel Milk Volume (K) Forecast, by Application 2020 & 2033
- Table 47: Russia Processed Camel Milk Revenue (million) Forecast, by Application 2020 & 2033
- Table 48: Russia Processed Camel Milk Volume (K) Forecast, by Application 2020 & 2033
- Table 49: Benelux Processed Camel Milk Revenue (million) Forecast, by Application 2020 & 2033
- Table 50: Benelux Processed Camel Milk Volume (K) Forecast, by Application 2020 & 2033
- Table 51: Nordics Processed Camel Milk Revenue (million) Forecast, by Application 2020 & 2033
- Table 52: Nordics Processed Camel Milk Volume (K) Forecast, by Application 2020 & 2033
- Table 53: Rest of Europe Processed Camel Milk Revenue (million) Forecast, by Application 2020 & 2033
- Table 54: Rest of Europe Processed Camel Milk Volume (K) Forecast, by Application 2020 & 2033
- Table 55: Global Processed Camel Milk Revenue million Forecast, by Application 2020 & 2033
- Table 56: Global Processed Camel Milk Volume K Forecast, by Application 2020 & 2033
- Table 57: Global Processed Camel Milk Revenue million Forecast, by Type 2020 & 2033
- Table 58: Global Processed Camel Milk Volume K Forecast, by Type 2020 & 2033
- Table 59: Global Processed Camel Milk Revenue million Forecast, by Country 2020 & 2033
- Table 60: Global Processed Camel Milk Volume K Forecast, by Country 2020 & 2033
- Table 61: Turkey Processed Camel Milk Revenue (million) Forecast, by Application 2020 & 2033
- Table 62: Turkey Processed Camel Milk Volume (K) Forecast, by Application 2020 & 2033
- Table 63: Israel Processed Camel Milk Revenue (million) Forecast, by Application 2020 & 2033
- Table 64: Israel Processed Camel Milk Volume (K) Forecast, by Application 2020 & 2033
- Table 65: GCC Processed Camel Milk Revenue (million) Forecast, by Application 2020 & 2033
- Table 66: GCC Processed Camel Milk Volume (K) Forecast, by Application 2020 & 2033
- Table 67: North Africa Processed Camel Milk Revenue (million) Forecast, by Application 2020 & 2033
- Table 68: North Africa Processed Camel Milk Volume (K) Forecast, by Application 2020 & 2033
- Table 69: South Africa Processed Camel Milk Revenue (million) Forecast, by Application 2020 & 2033
- Table 70: South Africa Processed Camel Milk Volume (K) Forecast, by Application 2020 & 2033
- Table 71: Rest of Middle East & Africa Processed Camel Milk Revenue (million) Forecast, by Application 2020 & 2033
- Table 72: Rest of Middle East & Africa Processed Camel Milk Volume (K) Forecast, by Application 2020 & 2033
- Table 73: Global Processed Camel Milk Revenue million Forecast, by Application 2020 & 2033
- Table 74: Global Processed Camel Milk Volume K Forecast, by Application 2020 & 2033
- Table 75: Global Processed Camel Milk Revenue million Forecast, by Type 2020 & 2033
- Table 76: Global Processed Camel Milk Volume K Forecast, by Type 2020 & 2033
- Table 77: Global Processed Camel Milk Revenue million Forecast, by Country 2020 & 2033
- Table 78: Global Processed Camel Milk Volume K Forecast, by Country 2020 & 2033
- Table 79: China Processed Camel Milk Revenue (million) Forecast, by Application 2020 & 2033
- Table 80: China Processed Camel Milk Volume (K) Forecast, by Application 2020 & 2033
- Table 81: India Processed Camel Milk Revenue (million) Forecast, by Application 2020 & 2033
- Table 82: India Processed Camel Milk Volume (K) Forecast, by Application 2020 & 2033
- Table 83: Japan Processed Camel Milk Revenue (million) Forecast, by Application 2020 & 2033
- Table 84: Japan Processed Camel Milk Volume (K) Forecast, by Application 2020 & 2033
- Table 85: South Korea Processed Camel Milk Revenue (million) Forecast, by Application 2020 & 2033
- Table 86: South Korea Processed Camel Milk Volume (K) Forecast, by Application 2020 & 2033
- Table 87: ASEAN Processed Camel Milk Revenue (million) Forecast, by Application 2020 & 2033
- Table 88: ASEAN Processed Camel Milk Volume (K) Forecast, by Application 2020 & 2033
- Table 89: Oceania Processed Camel Milk Revenue (million) Forecast, by Application 2020 & 2033
- Table 90: Oceania Processed Camel Milk Volume (K) Forecast, by Application 2020 & 2033
- Table 91: Rest of Asia Pacific Processed Camel Milk Revenue (million) Forecast, by Application 2020 & 2033
- Table 92: Rest of Asia Pacific Processed Camel Milk Volume (K) Forecast, by Application 2020 & 2033
Frequently Asked Questions
1. What is the projected Compound Annual Growth Rate (CAGR) of the Processed Camel Milk?
The projected CAGR is approximately 4.6%.
2. Which companies are prominent players in the Processed Camel Milk?
Key companies in the market include Desert Farms, Al Nassma, Al Ain Farms, Camelicious, Camilk, Amul, Nuug Camel, VITAL Camel Milk, Tiviski Dairy.
3. What are the main segments of the Processed Camel Milk?
The market segments include Application, Type.
4. Can you provide details about the market size?
The market size is estimated to be USD 1930 million as of 2022.
5. What are some drivers contributing to market growth?
N/A
6. What are the notable trends driving market growth?
N/A
7. Are there any restraints impacting market growth?
N/A
8. Can you provide examples of recent developments in the market?
N/A
9. What pricing options are available for accessing the report?
Pricing options include single-user, multi-user, and enterprise licenses priced at USD 3950.00, USD 5925.00, and USD 7900.00 respectively.
10. Is the market size provided in terms of value or volume?
The market size is provided in terms of value, measured in million and volume, measured in K.
11. Are there any specific market keywords associated with the report?
Yes, the market keyword associated with the report is "Processed Camel Milk," which aids in identifying and referencing the specific market segment covered.
12. How do I determine which pricing option suits my needs best?
The pricing options vary based on user requirements and access needs. Individual users may opt for single-user licenses, while businesses requiring broader access may choose multi-user or enterprise licenses for cost-effective access to the report.
13. Are there any additional resources or data provided in the Processed Camel Milk report?
While the report offers comprehensive insights, it's advisable to review the specific contents or supplementary materials provided to ascertain if additional resources or data are available.
14. How can I stay updated on further developments or reports in the Processed Camel Milk?
To stay informed about further developments, trends, and reports in the Processed Camel Milk, consider subscribing to industry newsletters, following relevant companies and organizations, or regularly checking reputable industry news sources and publications.
Methodology
Step 1 - Identification of Relevant Samples Size from Population Database


Step 2 - Approaches for Defining Global Market Size (Value, Volume* & Price*)

Note*: In applicable scenarios
Step 3 - Data Sources
Primary Research
- Web Analytics
- Survey Reports
- Research Institute
- Latest Research Reports
- Opinion Leaders
Secondary Research
- Annual Reports
- White Paper
- Latest Press Release
- Industry Association
- Paid Database
- Investor Presentations

Step 4 - Data Triangulation
Involves using different sources of information in order to increase the validity of a study
These sources are likely to be stakeholders in a program - participants, other researchers, program staff, other community members, and so on.
Then we put all data in single framework & apply various statistical tools to find out the dynamic on the market.
During the analysis stage, feedback from the stakeholder groups would be compared to determine areas of agreement as well as areas of divergence