

Key Insights
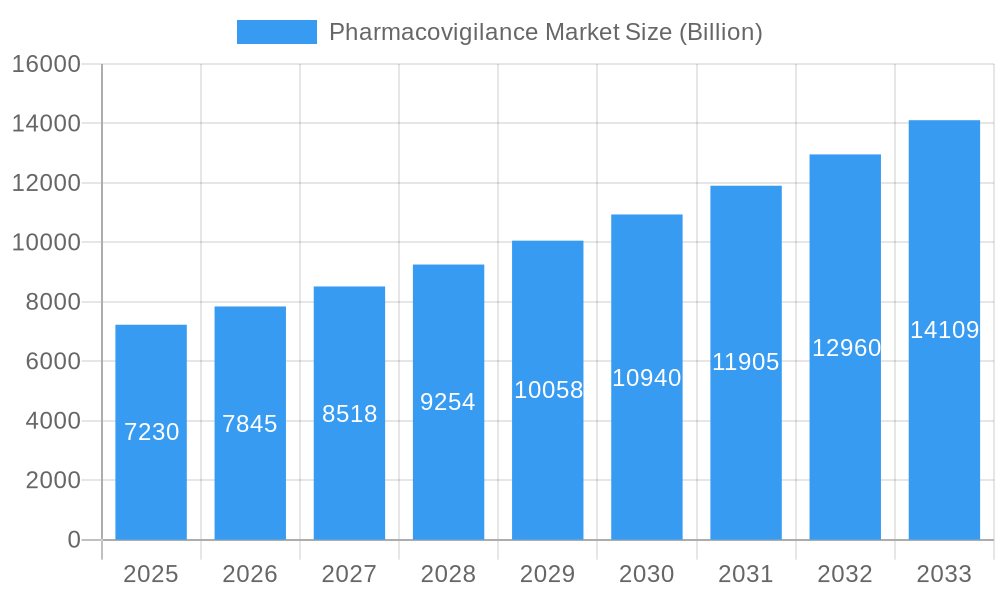
The global pharmacovigilance market, valued at $7.23 billion in 2025, is projected to experience robust growth, driven by a confluence of factors. The increasing prevalence of adverse drug reactions (ADRs), stringent regulatory requirements mandating comprehensive drug safety monitoring, and the rising adoption of advanced technologies like artificial intelligence (AI) and machine learning (ML) for data analysis are key catalysts. The market's segmentation reflects its complexity, with hospitals and pharmaceutical companies representing major end-users. Contract outsourcing services are gaining traction due to their cost-effectiveness and expertise in handling complex data analysis and reporting requirements. Furthermore, the growing emphasis on proactive pharmacovigilance strategies, such as cohort event monitoring and EHR mining, is fueling market expansion. Different phases of clinical trials also present distinct market opportunities, with later-stage trials often requiring more extensive pharmacovigilance activities. Geographically, North America holds a significant market share, owing to robust regulatory frameworks and higher healthcare expenditure. However, the Asia-Pacific region is anticipated to exhibit significant growth potential in the coming years, driven by expanding healthcare infrastructure and increasing drug consumption.
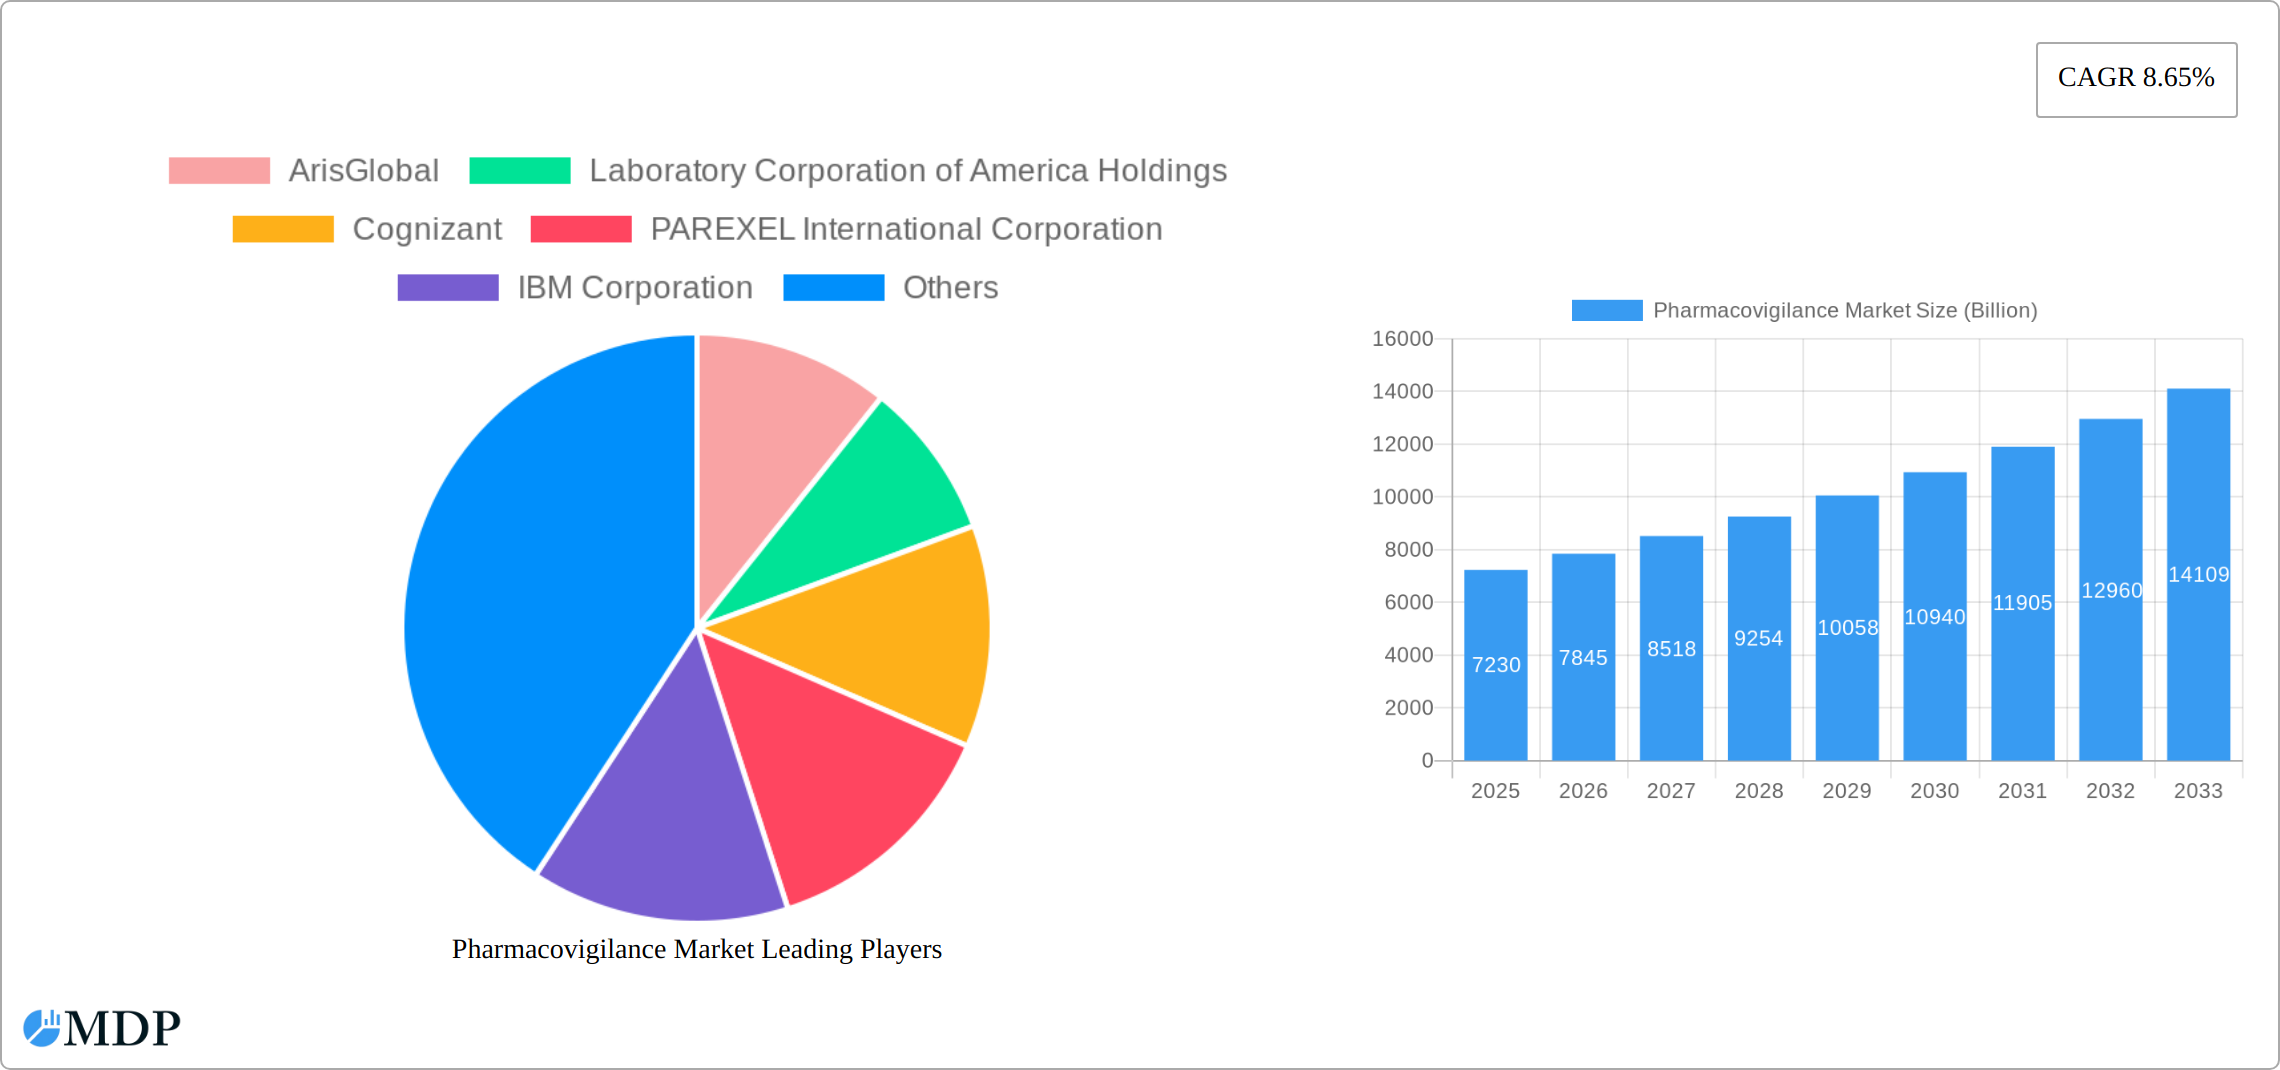
Pharmacovigilance Market Market Size (In Billion)
This market growth is further fueled by the rising adoption of cloud-based solutions, improving data management capabilities and facilitating collaboration among stakeholders. The increasing awareness regarding patient safety and the consequent demand for robust pharmacovigilance systems are additional factors contributing to market expansion. However, challenges remain, including the high cost of implementing sophisticated pharmacovigilance systems, data privacy concerns, and the complexities associated with integrating data from various sources. Despite these challenges, the market is expected to maintain a healthy compound annual growth rate (CAGR) of 8.65% throughout the forecast period (2025-2033), making it an attractive sector for investment and innovation.
Pharmacovigilance Market Company Market Share
Pharmacovigilance Market: A Comprehensive Report (2019-2033)
This comprehensive report provides an in-depth analysis of the global Pharmacovigilance market, projecting a market value exceeding XX Billion by 2033. The study covers the period from 2019 to 2033, with a focus on the forecast period of 2025-2033, and utilizes 2025 as the base year and estimated year. This report is essential for pharmaceutical companies, hospitals, service providers, investors, and other industry stakeholders seeking actionable insights into this dynamic market. It leverages high-impact keywords such as "Pharmacovigilance," "Clinical Trials," "Spontaneous Reporting," "ADR Reporting," "EHR Mining," and "Contract Outsourcing" to maximize online visibility.
Pharmacovigilance Market Market Dynamics & Concentration
The Pharmacovigilance market is characterized by a moderately concentrated landscape with several key players vying for market share. While precise market share data for each individual company is proprietary, the market exhibits a competitive dynamic shaped by factors such as innovation, regulatory changes, and strategic mergers and acquisitions (M&A). The number of M&A deals in the Pharmacovigilance sector between 2019 and 2024 averaged approximately xx per year, indicating significant consolidation and growth through acquisition. This activity is driven by the need for companies to expand their service offerings, enhance technological capabilities, and access new markets. Innovation in areas such as AI-powered signal detection and advanced data analytics plays a crucial role in shaping market dynamics. Stringent regulatory frameworks, like those enforced by the FDA and EMA, heavily influence product development and market entry. The availability of substitute technologies and services also influences the competitive landscape. Finally, end-user trends toward greater adoption of technology and outsourcing create further opportunities for market players.
Pharmacovigilance Market Industry Trends & Analysis
The Pharmacovigilance market is experiencing robust growth, with a projected Compound Annual Growth Rate (CAGR) of xx% during the forecast period (2025-2033). This growth is fueled by several key factors. Technological advancements, such as artificial intelligence (AI) and machine learning (ML), are enhancing the speed and accuracy of adverse drug reaction (ADR) detection. The increasing volume of clinical trial data and the growing adoption of electronic health records (EHRs) are creating substantial opportunities for pharmacovigilance service providers. Changing consumer preferences and heightened awareness of drug safety are driving demand for more comprehensive pharmacovigilance solutions. However, competitive dynamics and pricing pressures remain crucial aspects influencing the market growth. The market penetration of AI-powered pharmacovigilance solutions is expected to reach xx% by 2033, further showcasing the transformative impact of technology on the sector.
Leading Markets & Segments in Pharmacovigilance Market
The Pharmacovigilance market is geographically diverse, with significant contributions from North America and Europe. However, emerging markets in Asia-Pacific are showing rapid growth potential, driven by expanding healthcare infrastructure and increasing pharmaceutical production. Within market segmentation:
- End User: Pharmaceutical companies represent the largest segment, followed by hospitals and other end-users, driven by stringent regulatory compliance demands.
- Clinical Trial Phase: Phase III and Phase IV clinical trials represent the highest demand for pharmacovigilance services, reflecting the critical need for rigorous safety monitoring during these stages.
- Service Provider: The Contract Outsourcing segment dominates the market, fueled by the increasing need for specialized expertise and cost-effectiveness.
- Type of Reporting: Spontaneous reporting continues to be a primary form of reporting, though other methodologies like Cohort Event Monitoring and EHR Mining are gaining traction, reflecting advances in data analytics.
Key drivers in leading markets include robust healthcare spending, stringent regulatory environments, and advanced technological infrastructure.
Pharmacovigilance Market Product Developments
The Pharmacovigilance market is experiencing rapid evolution, driven by significant advancements in technology and a heightened focus on patient safety. Recent innovations include sophisticated AI-powered signal detection systems that leverage machine learning algorithms to identify potential adverse drug reactions (ADRs) with greater speed and accuracy than traditional methods. Advanced data analytics platforms provide comprehensive insights from diverse data sources, including electronic health records (EHRs), clinical trial data, and social media. Cloud-based solutions are streamlining data management and reporting, enhancing collaboration and efficiency across geographically dispersed teams. These innovations are not only improving the efficiency and accuracy of pharmacovigilance processes but also enabling greater scalability to meet the growing demands of the industry. A key trend is the move towards integrated solutions that combine various data sources to provide a holistic, real-time view of drug safety, facilitating more proactive and effective risk management.
Key Drivers of Pharmacovigilance Market Growth
Several key factors are fueling the expansion of the Pharmacovigilance market:
- Technological advancements: The integration of Artificial Intelligence (AI), Machine Learning (ML), and Big Data analytics is revolutionizing ADR detection, reporting efficiency, and risk assessment, enabling faster identification of safety signals and improved decision-making.
- Stringent regulations: Increasingly stringent global regulations, such as those enforced by the FDA and EMA, mandate robust pharmacovigilance systems, driving significant demand for compliant solutions and services.
- Growing clinical trial activity: The rise in the number and complexity of clinical trials necessitates robust and scalable safety monitoring solutions capable of handling large volumes of data and ensuring patient safety throughout the research process.
- Increasing awareness of drug safety: Heightened patient awareness and advocacy are leading to increased reporting of adverse events, putting greater pressure on pharmacovigilance systems to effectively manage and analyze this growing volume of information.
- Rise of Real-World Evidence (RWE): The increasing use of RWE to supplement clinical trial data necessitates advanced pharmacovigilance systems capable of integrating and analyzing data from diverse sources, including electronic health records and patient-reported outcomes.
Challenges in the Pharmacovigilance Market Market
The Pharmacovigilance market faces several challenges, including:
- High costs of implementing advanced technologies: The investment in new technologies can be significant.
- Data privacy and security concerns: Handling sensitive patient data requires robust security measures.
- Integration complexities: Integrating disparate data sources can be technically challenging and time-consuming.
- Regulatory complexities: Navigating varying global regulations adds to the complexity.
Emerging Opportunities in Pharmacovigilance Market
The Pharmacovigilance market presents substantial growth opportunities. The expansion of AI-driven solutions, particularly in predictive modeling and proactive risk assessment, represents a major area of potential. The integration of wearable sensors and other connected health technologies allows for real-time data collection, offering continuous monitoring of patients and enabling faster detection of ADRs. The rise of decentralized clinical trials (DCTs) is creating a need for innovative pharmacovigilance strategies that can adapt to the unique challenges of remote patient monitoring and data management. Strategic partnerships between technology providers, pharmaceutical companies, and contract research organizations (CROs) are fostering innovation and driving market expansion. Furthermore, untapped markets in emerging economies present significant growth potential, particularly as these regions experience increased healthcare investment and adoption of advanced technologies.
Leading Players in the Pharmacovigilance Market Sector
- ArisGlobal
- Laboratory Corporation of America Holdings
- Cognizant
- PAREXEL International Corporation
- IBM Corporation
- Wipro Ltd
- ICON PLC
- Accenture
- BioClinica
- Linical Accelovance
- IQVIA
- TAKE Solutions Ltd
- ITClinical
- Capgemini
- United BioSource Corporation
Key Milestones in Pharmacovigilance Market Industry
- February 2022: Cognizant partnered with Medable Inc. to offer integrated clinical research solutions for decentralized trials, significantly advancing the adoption of technology in pharmacovigilance and demonstrating a commitment to improving efficiency and patient safety in clinical research.
- February 2022: LINK Medical and Viedoc partnered to improve trial efficiency through streamlined data collection and analysis processes, highlighting the increasing industry focus on collaboration and technological integration to optimize pharmacovigilance operations.
- [Add more recent milestones here with dates and brief descriptions. Include companies and relevant details.]
Strategic Outlook for Pharmacovigilance Market Market
The future of the Pharmacovigilance market is bright, with continued growth driven by technological advancements, regulatory changes, and increasing demand for efficient and accurate drug safety monitoring. Strategic partnerships, expansion into new markets, and the development of innovative solutions will be crucial for success in this dynamic market. The market's potential lies in leveraging AI and big data to create predictive models for drug safety and proactively address potential risks.
Pharmacovigilance Market Segmentation
-
1. Clinical Trial Phase
- 1.1. Preclinical
- 1.2. Phase I
- 1.3. Phase II
- 1.4. Phase III
- 1.5. Phase IV
-
2. Service Provider
- 2.1. In-house
- 2.2. Contract Outsourcing
-
3. Type of Reporting
- 3.1. Spontaneous Reporting
- 3.2. Intensified ADR Reporting
- 3.3. Targeted Spontaneous Reporting
- 3.4. Cohort Event Monitoring
- 3.5. EHR Mining
-
4. End User
- 4.1. Hospitals
- 4.2. Pharmaceutical Companies
- 4.3. Other End Users
Pharmacovigilance Market Segmentation By Geography
-
1. North America
- 1.1. United States
- 1.2. Canada
- 1.3. Mexico
-
2. Europe
- 2.1. Germany
- 2.2. United Kingdom
- 2.3. France
- 2.4. Italy
- 2.5. Spain
- 2.6. Rest of Europe
-
3. Asia Pacific
- 3.1. China
- 3.2. Japan
- 3.3. India
- 3.4. Australia
- 3.5. South Korea
- 3.6. Rest of Asia Pacific
-
4. Middle East and Africa
- 4.1. GCC
- 4.2. South Africa
- 4.3. Rest of Middle East and Africa
-
5. South America
- 5.1. Brazil
- 5.2. Argentina
- 5.3. Rest of South America
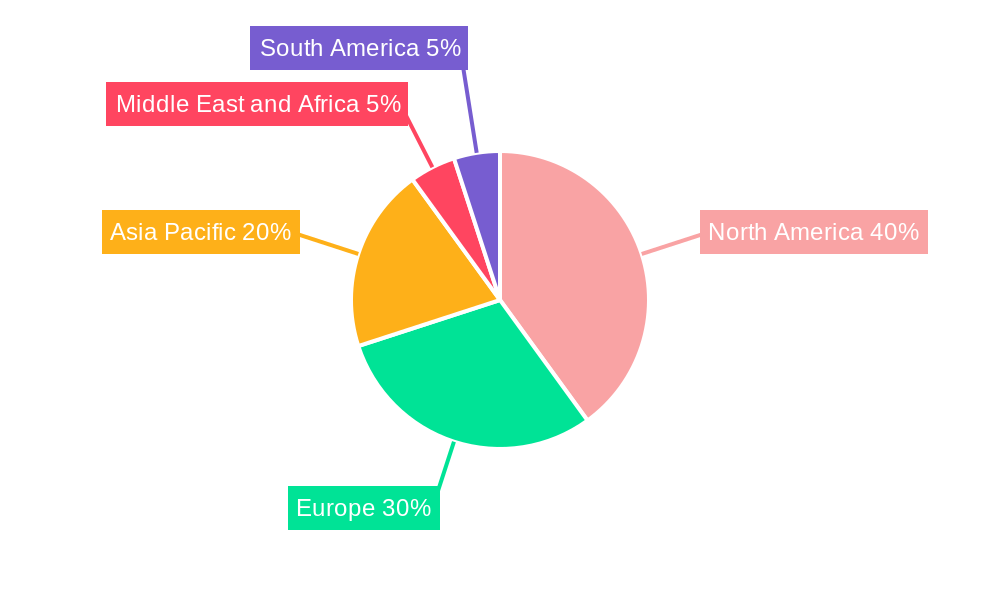
Pharmacovigilance Market Regional Market Share
Geographic Coverage of Pharmacovigilance Market
Pharmacovigilance Market REPORT HIGHLIGHTS
| Aspects | Details |
|---|---|
| Study Period | 2020-2034 |
| Base Year | 2025 |
| Estimated Year | 2026 |
| Forecast Period | 2026-2034 |
| Historical Period | 2020-2025 |
| Growth Rate | CAGR of 8.65% from 2020-2034 |
| Segmentation |
|
Table of Contents
- 1. Introduction
- 1.1. Research Scope
- 1.2. Market Segmentation
- 1.3. Research Objective
- 1.4. Definitions and Assumptions
- 2. Executive Summary
- 2.1. Market Snapshot
- 3. Market Dynamics
- 3.1. Market Drivers
- 3.2. Market Restrains
- 3.3. Market Trends
- 3.4. Market Opportunities
- 4. Market Factor Analysis
- 4.1. Porters Five Forces
- 4.1.1. Bargaining Power of Suppliers
- 4.1.2. Bargaining Power of Buyers
- 4.1.3. Threat of New Entrants
- 4.1.4. Threat of Substitutes
- 4.1.5. Competitive Rivalry
- 4.2. PESTEL analysis
- 4.3. BCG Analysis
- 4.3.1. Stars (High Growth, High Market Share)
- 4.3.2. Cash Cows (Low Growth, High Market Share)
- 4.3.3. Question Mark (High Growth, Low Market Share)
- 4.3.4. Dogs (Low Growth, Low Market Share)
- 4.4. Ansoff Matrix Analysis
- 4.5. Supply Chain Analysis
- 4.6. Regulatory Landscape
- 4.7. Current Market Potential and Opportunity Assessment (TAM–SAM–SOM Framework)
- 4.8. MDP Analyst Note
- 4.1. Porters Five Forces
- 5. Market Analysis, Insights and Forecast 2021-2033
- 5.1. Market Analysis, Insights and Forecast - by Clinical Trial Phase
- 5.1.1. Preclinical
- 5.1.2. Phase I
- 5.1.3. Phase II
- 5.1.4. Phase III
- 5.1.5. Phase IV
- 5.2. Market Analysis, Insights and Forecast - by Service Provider
- 5.2.1. In-house
- 5.2.2. Contract Outsourcing
- 5.3. Market Analysis, Insights and Forecast - by Type of Reporting
- 5.3.1. Spontaneous Reporting
- 5.3.2. Intensified ADR Reporting
- 5.3.3. Targeted Spontaneous Reporting
- 5.3.4. Cohort Event Monitoring
- 5.3.5. EHR Mining
- 5.4. Market Analysis, Insights and Forecast - by End User
- 5.4.1. Hospitals
- 5.4.2. Pharmaceutical Companies
- 5.4.3. Other End Users
- 5.5. Market Analysis, Insights and Forecast - by Region
- 5.5.1. North America
- 5.5.2. Europe
- 5.5.3. Asia Pacific
- 5.5.4. Middle East and Africa
- 5.5.5. South America
- 5.1. Market Analysis, Insights and Forecast - by Clinical Trial Phase
- 6. Global Pharmacovigilance Market Analysis, Insights and Forecast, 2021-2033
- 6.1. Market Analysis, Insights and Forecast - by Clinical Trial Phase
- 6.1.1. Preclinical
- 6.1.2. Phase I
- 6.1.3. Phase II
- 6.1.4. Phase III
- 6.1.5. Phase IV
- 6.2. Market Analysis, Insights and Forecast - by Service Provider
- 6.2.1. In-house
- 6.2.2. Contract Outsourcing
- 6.3. Market Analysis, Insights and Forecast - by Type of Reporting
- 6.3.1. Spontaneous Reporting
- 6.3.2. Intensified ADR Reporting
- 6.3.3. Targeted Spontaneous Reporting
- 6.3.4. Cohort Event Monitoring
- 6.3.5. EHR Mining
- 6.4. Market Analysis, Insights and Forecast - by End User
- 6.4.1. Hospitals
- 6.4.2. Pharmaceutical Companies
- 6.4.3. Other End Users
- 6.1. Market Analysis, Insights and Forecast - by Clinical Trial Phase
- 7. North America Pharmacovigilance Market Analysis, Insights and Forecast, 2020-2032
- 7.1. Market Analysis, Insights and Forecast - by Clinical Trial Phase
- 7.1.1. Preclinical
- 7.1.2. Phase I
- 7.1.3. Phase II
- 7.1.4. Phase III
- 7.1.5. Phase IV
- 7.2. Market Analysis, Insights and Forecast - by Service Provider
- 7.2.1. In-house
- 7.2.2. Contract Outsourcing
- 7.3. Market Analysis, Insights and Forecast - by Type of Reporting
- 7.3.1. Spontaneous Reporting
- 7.3.2. Intensified ADR Reporting
- 7.3.3. Targeted Spontaneous Reporting
- 7.3.4. Cohort Event Monitoring
- 7.3.5. EHR Mining
- 7.4. Market Analysis, Insights and Forecast - by End User
- 7.4.1. Hospitals
- 7.4.2. Pharmaceutical Companies
- 7.4.3. Other End Users
- 7.1. Market Analysis, Insights and Forecast - by Clinical Trial Phase
- 8. Europe Pharmacovigilance Market Analysis, Insights and Forecast, 2020-2032
- 8.1. Market Analysis, Insights and Forecast - by Clinical Trial Phase
- 8.1.1. Preclinical
- 8.1.2. Phase I
- 8.1.3. Phase II
- 8.1.4. Phase III
- 8.1.5. Phase IV
- 8.2. Market Analysis, Insights and Forecast - by Service Provider
- 8.2.1. In-house
- 8.2.2. Contract Outsourcing
- 8.3. Market Analysis, Insights and Forecast - by Type of Reporting
- 8.3.1. Spontaneous Reporting
- 8.3.2. Intensified ADR Reporting
- 8.3.3. Targeted Spontaneous Reporting
- 8.3.4. Cohort Event Monitoring
- 8.3.5. EHR Mining
- 8.4. Market Analysis, Insights and Forecast - by End User
- 8.4.1. Hospitals
- 8.4.2. Pharmaceutical Companies
- 8.4.3. Other End Users
- 8.1. Market Analysis, Insights and Forecast - by Clinical Trial Phase
- 9. Asia Pacific Pharmacovigilance Market Analysis, Insights and Forecast, 2020-2032
- 9.1. Market Analysis, Insights and Forecast - by Clinical Trial Phase
- 9.1.1. Preclinical
- 9.1.2. Phase I
- 9.1.3. Phase II
- 9.1.4. Phase III
- 9.1.5. Phase IV
- 9.2. Market Analysis, Insights and Forecast - by Service Provider
- 9.2.1. In-house
- 9.2.2. Contract Outsourcing
- 9.3. Market Analysis, Insights and Forecast - by Type of Reporting
- 9.3.1. Spontaneous Reporting
- 9.3.2. Intensified ADR Reporting
- 9.3.3. Targeted Spontaneous Reporting
- 9.3.4. Cohort Event Monitoring
- 9.3.5. EHR Mining
- 9.4. Market Analysis, Insights and Forecast - by End User
- 9.4.1. Hospitals
- 9.4.2. Pharmaceutical Companies
- 9.4.3. Other End Users
- 9.1. Market Analysis, Insights and Forecast - by Clinical Trial Phase
- 10. Middle East and Africa Pharmacovigilance Market Analysis, Insights and Forecast, 2020-2032
- 10.1. Market Analysis, Insights and Forecast - by Clinical Trial Phase
- 10.1.1. Preclinical
- 10.1.2. Phase I
- 10.1.3. Phase II
- 10.1.4. Phase III
- 10.1.5. Phase IV
- 10.2. Market Analysis, Insights and Forecast - by Service Provider
- 10.2.1. In-house
- 10.2.2. Contract Outsourcing
- 10.3. Market Analysis, Insights and Forecast - by Type of Reporting
- 10.3.1. Spontaneous Reporting
- 10.3.2. Intensified ADR Reporting
- 10.3.3. Targeted Spontaneous Reporting
- 10.3.4. Cohort Event Monitoring
- 10.3.5. EHR Mining
- 10.4. Market Analysis, Insights and Forecast - by End User
- 10.4.1. Hospitals
- 10.4.2. Pharmaceutical Companies
- 10.4.3. Other End Users
- 10.1. Market Analysis, Insights and Forecast - by Clinical Trial Phase
- 11. South America Pharmacovigilance Market Analysis, Insights and Forecast, 2020-2032
- 11.1. Market Analysis, Insights and Forecast - by Clinical Trial Phase
- 11.1.1. Preclinical
- 11.1.2. Phase I
- 11.1.3. Phase II
- 11.1.4. Phase III
- 11.1.5. Phase IV
- 11.2. Market Analysis, Insights and Forecast - by Service Provider
- 11.2.1. In-house
- 11.2.2. Contract Outsourcing
- 11.3. Market Analysis, Insights and Forecast - by Type of Reporting
- 11.3.1. Spontaneous Reporting
- 11.3.2. Intensified ADR Reporting
- 11.3.3. Targeted Spontaneous Reporting
- 11.3.4. Cohort Event Monitoring
- 11.3.5. EHR Mining
- 11.4. Market Analysis, Insights and Forecast - by End User
- 11.4.1. Hospitals
- 11.4.2. Pharmaceutical Companies
- 11.4.3. Other End Users
- 11.1. Market Analysis, Insights and Forecast - by Clinical Trial Phase
- 12. Competitive Analysis
- 12.1. Company Profiles
- 12.1.1 ArisGlobal
- 12.1.1.1. Company Overview
- 12.1.1.2. Products
- 12.1.1.3. Company Financials
- 12.1.1.4. SWOT Analysis
- 12.1.2 Laboratory Corporation of America Holdings
- 12.1.2.1. Company Overview
- 12.1.2.2. Products
- 12.1.2.3. Company Financials
- 12.1.2.4. SWOT Analysis
- 12.1.3 Cognizant
- 12.1.3.1. Company Overview
- 12.1.3.2. Products
- 12.1.3.3. Company Financials
- 12.1.3.4. SWOT Analysis
- 12.1.4 PAREXEL International Corporation
- 12.1.4.1. Company Overview
- 12.1.4.2. Products
- 12.1.4.3. Company Financials
- 12.1.4.4. SWOT Analysis
- 12.1.5 IBM Corporation
- 12.1.5.1. Company Overview
- 12.1.5.2. Products
- 12.1.5.3. Company Financials
- 12.1.5.4. SWOT Analysis
- 12.1.6 Wipro Ltd*List Not Exhaustive
- 12.1.6.1. Company Overview
- 12.1.6.2. Products
- 12.1.6.3. Company Financials
- 12.1.6.4. SWOT Analysis
- 12.1.7 ICON PLC
- 12.1.7.1. Company Overview
- 12.1.7.2. Products
- 12.1.7.3. Company Financials
- 12.1.7.4. SWOT Analysis
- 12.1.8 Accenture
- 12.1.8.1. Company Overview
- 12.1.8.2. Products
- 12.1.8.3. Company Financials
- 12.1.8.4. SWOT Analysis
- 12.1.9 BioClinica
- 12.1.9.1. Company Overview
- 12.1.9.2. Products
- 12.1.9.3. Company Financials
- 12.1.9.4. SWOT Analysis
- 12.1.10 Linical Accelovance
- 12.1.10.1. Company Overview
- 12.1.10.2. Products
- 12.1.10.3. Company Financials
- 12.1.10.4. SWOT Analysis
- 12.1.11 IQVIA
- 12.1.11.1. Company Overview
- 12.1.11.2. Products
- 12.1.11.3. Company Financials
- 12.1.11.4. SWOT Analysis
- 12.1.12 TAKE Solutions Ltd
- 12.1.12.1. Company Overview
- 12.1.12.2. Products
- 12.1.12.3. Company Financials
- 12.1.12.4. SWOT Analysis
- 12.1.13 ITClinical
- 12.1.13.1. Company Overview
- 12.1.13.2. Products
- 12.1.13.3. Company Financials
- 12.1.13.4. SWOT Analysis
- 12.1.14 Capgemini
- 12.1.14.1. Company Overview
- 12.1.14.2. Products
- 12.1.14.3. Company Financials
- 12.1.14.4. SWOT Analysis
- 12.1.15 United BioSource Corporation
- 12.1.15.1. Company Overview
- 12.1.15.2. Products
- 12.1.15.3. Company Financials
- 12.1.15.4. SWOT Analysis
- 12.1.1 ArisGlobal
- 12.2. Market Entropy
- 12.2.1 Company's Key Areas Served
- 12.2.2 Recent Developments
- 12.3. Company Market Share Analysis 2025
- 12.3.1 Top 5 Companies Market Share Analysis
- 12.3.2 Top 3 Companies Market Share Analysis
- 12.4. List of Potential Customers
- 13. Research Methodology
List of Figures
- Figure 1: Global Pharmacovigilance Market Revenue Breakdown (Billion, %) by Region 2025 & 2033
- Figure 2: North America Pharmacovigilance Market Revenue (Billion), by Clinical Trial Phase 2025 & 2033
- Figure 3: North America Pharmacovigilance Market Revenue Share (%), by Clinical Trial Phase 2025 & 2033
- Figure 4: North America Pharmacovigilance Market Revenue (Billion), by Service Provider 2025 & 2033
- Figure 5: North America Pharmacovigilance Market Revenue Share (%), by Service Provider 2025 & 2033
- Figure 6: North America Pharmacovigilance Market Revenue (Billion), by Type of Reporting 2025 & 2033
- Figure 7: North America Pharmacovigilance Market Revenue Share (%), by Type of Reporting 2025 & 2033
- Figure 8: North America Pharmacovigilance Market Revenue (Billion), by End User 2025 & 2033
- Figure 9: North America Pharmacovigilance Market Revenue Share (%), by End User 2025 & 2033
- Figure 10: North America Pharmacovigilance Market Revenue (Billion), by Country 2025 & 2033
- Figure 11: North America Pharmacovigilance Market Revenue Share (%), by Country 2025 & 2033
- Figure 12: Europe Pharmacovigilance Market Revenue (Billion), by Clinical Trial Phase 2025 & 2033
- Figure 13: Europe Pharmacovigilance Market Revenue Share (%), by Clinical Trial Phase 2025 & 2033
- Figure 14: Europe Pharmacovigilance Market Revenue (Billion), by Service Provider 2025 & 2033
- Figure 15: Europe Pharmacovigilance Market Revenue Share (%), by Service Provider 2025 & 2033
- Figure 16: Europe Pharmacovigilance Market Revenue (Billion), by Type of Reporting 2025 & 2033
- Figure 17: Europe Pharmacovigilance Market Revenue Share (%), by Type of Reporting 2025 & 2033
- Figure 18: Europe Pharmacovigilance Market Revenue (Billion), by End User 2025 & 2033
- Figure 19: Europe Pharmacovigilance Market Revenue Share (%), by End User 2025 & 2033
- Figure 20: Europe Pharmacovigilance Market Revenue (Billion), by Country 2025 & 2033
- Figure 21: Europe Pharmacovigilance Market Revenue Share (%), by Country 2025 & 2033
- Figure 22: Asia Pacific Pharmacovigilance Market Revenue (Billion), by Clinical Trial Phase 2025 & 2033
- Figure 23: Asia Pacific Pharmacovigilance Market Revenue Share (%), by Clinical Trial Phase 2025 & 2033
- Figure 24: Asia Pacific Pharmacovigilance Market Revenue (Billion), by Service Provider 2025 & 2033
- Figure 25: Asia Pacific Pharmacovigilance Market Revenue Share (%), by Service Provider 2025 & 2033
- Figure 26: Asia Pacific Pharmacovigilance Market Revenue (Billion), by Type of Reporting 2025 & 2033
- Figure 27: Asia Pacific Pharmacovigilance Market Revenue Share (%), by Type of Reporting 2025 & 2033
- Figure 28: Asia Pacific Pharmacovigilance Market Revenue (Billion), by End User 2025 & 2033
- Figure 29: Asia Pacific Pharmacovigilance Market Revenue Share (%), by End User 2025 & 2033
- Figure 30: Asia Pacific Pharmacovigilance Market Revenue (Billion), by Country 2025 & 2033
- Figure 31: Asia Pacific Pharmacovigilance Market Revenue Share (%), by Country 2025 & 2033
- Figure 32: Middle East and Africa Pharmacovigilance Market Revenue (Billion), by Clinical Trial Phase 2025 & 2033
- Figure 33: Middle East and Africa Pharmacovigilance Market Revenue Share (%), by Clinical Trial Phase 2025 & 2033
- Figure 34: Middle East and Africa Pharmacovigilance Market Revenue (Billion), by Service Provider 2025 & 2033
- Figure 35: Middle East and Africa Pharmacovigilance Market Revenue Share (%), by Service Provider 2025 & 2033
- Figure 36: Middle East and Africa Pharmacovigilance Market Revenue (Billion), by Type of Reporting 2025 & 2033
- Figure 37: Middle East and Africa Pharmacovigilance Market Revenue Share (%), by Type of Reporting 2025 & 2033
- Figure 38: Middle East and Africa Pharmacovigilance Market Revenue (Billion), by End User 2025 & 2033
- Figure 39: Middle East and Africa Pharmacovigilance Market Revenue Share (%), by End User 2025 & 2033
- Figure 40: Middle East and Africa Pharmacovigilance Market Revenue (Billion), by Country 2025 & 2033
- Figure 41: Middle East and Africa Pharmacovigilance Market Revenue Share (%), by Country 2025 & 2033
- Figure 42: South America Pharmacovigilance Market Revenue (Billion), by Clinical Trial Phase 2025 & 2033
- Figure 43: South America Pharmacovigilance Market Revenue Share (%), by Clinical Trial Phase 2025 & 2033
- Figure 44: South America Pharmacovigilance Market Revenue (Billion), by Service Provider 2025 & 2033
- Figure 45: South America Pharmacovigilance Market Revenue Share (%), by Service Provider 2025 & 2033
- Figure 46: South America Pharmacovigilance Market Revenue (Billion), by Type of Reporting 2025 & 2033
- Figure 47: South America Pharmacovigilance Market Revenue Share (%), by Type of Reporting 2025 & 2033
- Figure 48: South America Pharmacovigilance Market Revenue (Billion), by End User 2025 & 2033
- Figure 49: South America Pharmacovigilance Market Revenue Share (%), by End User 2025 & 2033
- Figure 50: South America Pharmacovigilance Market Revenue (Billion), by Country 2025 & 2033
- Figure 51: South America Pharmacovigilance Market Revenue Share (%), by Country 2025 & 2033
List of Tables
- Table 1: Global Pharmacovigilance Market Revenue Billion Forecast, by Clinical Trial Phase 2020 & 2033
- Table 2: Global Pharmacovigilance Market Revenue Billion Forecast, by Service Provider 2020 & 2033
- Table 3: Global Pharmacovigilance Market Revenue Billion Forecast, by Type of Reporting 2020 & 2033
- Table 4: Global Pharmacovigilance Market Revenue Billion Forecast, by End User 2020 & 2033
- Table 5: Global Pharmacovigilance Market Revenue Billion Forecast, by Region 2020 & 2033
- Table 6: Global Pharmacovigilance Market Revenue Billion Forecast, by Clinical Trial Phase 2020 & 2033
- Table 7: Global Pharmacovigilance Market Revenue Billion Forecast, by Service Provider 2020 & 2033
- Table 8: Global Pharmacovigilance Market Revenue Billion Forecast, by Type of Reporting 2020 & 2033
- Table 9: Global Pharmacovigilance Market Revenue Billion Forecast, by End User 2020 & 2033
- Table 10: Global Pharmacovigilance Market Revenue Billion Forecast, by Country 2020 & 2033
- Table 11: United States Pharmacovigilance Market Revenue (Billion) Forecast, by Application 2020 & 2033
- Table 12: Canada Pharmacovigilance Market Revenue (Billion) Forecast, by Application 2020 & 2033
- Table 13: Mexico Pharmacovigilance Market Revenue (Billion) Forecast, by Application 2020 & 2033
- Table 14: Global Pharmacovigilance Market Revenue Billion Forecast, by Clinical Trial Phase 2020 & 2033
- Table 15: Global Pharmacovigilance Market Revenue Billion Forecast, by Service Provider 2020 & 2033
- Table 16: Global Pharmacovigilance Market Revenue Billion Forecast, by Type of Reporting 2020 & 2033
- Table 17: Global Pharmacovigilance Market Revenue Billion Forecast, by End User 2020 & 2033
- Table 18: Global Pharmacovigilance Market Revenue Billion Forecast, by Country 2020 & 2033
- Table 19: Germany Pharmacovigilance Market Revenue (Billion) Forecast, by Application 2020 & 2033
- Table 20: United Kingdom Pharmacovigilance Market Revenue (Billion) Forecast, by Application 2020 & 2033
- Table 21: France Pharmacovigilance Market Revenue (Billion) Forecast, by Application 2020 & 2033
- Table 22: Italy Pharmacovigilance Market Revenue (Billion) Forecast, by Application 2020 & 2033
- Table 23: Spain Pharmacovigilance Market Revenue (Billion) Forecast, by Application 2020 & 2033
- Table 24: Rest of Europe Pharmacovigilance Market Revenue (Billion) Forecast, by Application 2020 & 2033
- Table 25: Global Pharmacovigilance Market Revenue Billion Forecast, by Clinical Trial Phase 2020 & 2033
- Table 26: Global Pharmacovigilance Market Revenue Billion Forecast, by Service Provider 2020 & 2033
- Table 27: Global Pharmacovigilance Market Revenue Billion Forecast, by Type of Reporting 2020 & 2033
- Table 28: Global Pharmacovigilance Market Revenue Billion Forecast, by End User 2020 & 2033
- Table 29: Global Pharmacovigilance Market Revenue Billion Forecast, by Country 2020 & 2033
- Table 30: China Pharmacovigilance Market Revenue (Billion) Forecast, by Application 2020 & 2033
- Table 31: Japan Pharmacovigilance Market Revenue (Billion) Forecast, by Application 2020 & 2033
- Table 32: India Pharmacovigilance Market Revenue (Billion) Forecast, by Application 2020 & 2033
- Table 33: Australia Pharmacovigilance Market Revenue (Billion) Forecast, by Application 2020 & 2033
- Table 34: South Korea Pharmacovigilance Market Revenue (Billion) Forecast, by Application 2020 & 2033
- Table 35: Rest of Asia Pacific Pharmacovigilance Market Revenue (Billion) Forecast, by Application 2020 & 2033
- Table 36: Global Pharmacovigilance Market Revenue Billion Forecast, by Clinical Trial Phase 2020 & 2033
- Table 37: Global Pharmacovigilance Market Revenue Billion Forecast, by Service Provider 2020 & 2033
- Table 38: Global Pharmacovigilance Market Revenue Billion Forecast, by Type of Reporting 2020 & 2033
- Table 39: Global Pharmacovigilance Market Revenue Billion Forecast, by End User 2020 & 2033
- Table 40: Global Pharmacovigilance Market Revenue Billion Forecast, by Country 2020 & 2033
- Table 41: GCC Pharmacovigilance Market Revenue (Billion) Forecast, by Application 2020 & 2033
- Table 42: South Africa Pharmacovigilance Market Revenue (Billion) Forecast, by Application 2020 & 2033
- Table 43: Rest of Middle East and Africa Pharmacovigilance Market Revenue (Billion) Forecast, by Application 2020 & 2033
- Table 44: Global Pharmacovigilance Market Revenue Billion Forecast, by Clinical Trial Phase 2020 & 2033
- Table 45: Global Pharmacovigilance Market Revenue Billion Forecast, by Service Provider 2020 & 2033
- Table 46: Global Pharmacovigilance Market Revenue Billion Forecast, by Type of Reporting 2020 & 2033
- Table 47: Global Pharmacovigilance Market Revenue Billion Forecast, by End User 2020 & 2033
- Table 48: Global Pharmacovigilance Market Revenue Billion Forecast, by Country 2020 & 2033
- Table 49: Brazil Pharmacovigilance Market Revenue (Billion) Forecast, by Application 2020 & 2033
- Table 50: Argentina Pharmacovigilance Market Revenue (Billion) Forecast, by Application 2020 & 2033
- Table 51: Rest of South America Pharmacovigilance Market Revenue (Billion) Forecast, by Application 2020 & 2033
Frequently Asked Questions
1. What is the projected Compound Annual Growth Rate (CAGR) of the Pharmacovigilance Market?
The projected CAGR is approximately 8.65%.
2. Which companies are prominent players in the Pharmacovigilance Market?
Key companies in the market include ArisGlobal, Laboratory Corporation of America Holdings, Cognizant, PAREXEL International Corporation, IBM Corporation, Wipro Ltd*List Not Exhaustive, ICON PLC, Accenture, BioClinica, Linical Accelovance, IQVIA, TAKE Solutions Ltd, ITClinical, Capgemini, United BioSource Corporation.
3. What are the main segments of the Pharmacovigilance Market?
The market segments include Clinical Trial Phase, Service Provider, Type of Reporting, End User.
4. Can you provide details about the market size?
The market size is estimated to be USD 7.23 Billion as of 2022.
5. What are some drivers contributing to market growth?
Increasing Drug Consumption and Drug Development Rates; Growing Incidence Rates of Adverse Drug Reaction and Drug Toxicity; Increasing Trend of Outsourcing Pharmacovigilance Services.
6. What are the notable trends driving market growth?
The Pharmaceutical Companies Segment is Expected to Hold a Major Market Share.
7. Are there any restraints impacting market growth?
High Risk Associated with Data Security; Lack of Global Regulatory Harmonization and Lack of Data Standardization for Adverse Event Collection.
8. Can you provide examples of recent developments in the market?
In February 2022, Cognizant entered into a partnership with Medable Inc. to jointly deliver clinical research solutions based on Medable's software-as-a-service platform for decentralized clinical trials.
9. What pricing options are available for accessing the report?
Pricing options include single-user, multi-user, and enterprise licenses priced at USD 4750, USD 5250, and USD 8750 respectively.
10. Is the market size provided in terms of value or volume?
The market size is provided in terms of value, measured in Billion.
11. Are there any specific market keywords associated with the report?
Yes, the market keyword associated with the report is "Pharmacovigilance Market," which aids in identifying and referencing the specific market segment covered.
12. How do I determine which pricing option suits my needs best?
The pricing options vary based on user requirements and access needs. Individual users may opt for single-user licenses, while businesses requiring broader access may choose multi-user or enterprise licenses for cost-effective access to the report.
13. Are there any additional resources or data provided in the Pharmacovigilance Market report?
While the report offers comprehensive insights, it's advisable to review the specific contents or supplementary materials provided to ascertain if additional resources or data are available.
14. How can I stay updated on further developments or reports in the Pharmacovigilance Market?
To stay informed about further developments, trends, and reports in the Pharmacovigilance Market, consider subscribing to industry newsletters, following relevant companies and organizations, or regularly checking reputable industry news sources and publications.
Methodology
Step 1 - Identification of Relevant Samples Size from Population Database


Step 2 - Approaches for Defining Global Market Size (Value, Volume* & Price*)

Note*: In applicable scenarios
Step 3 - Data Sources
Primary Research
- Web Analytics
- Survey Reports
- Research Institute
- Latest Research Reports
- Opinion Leaders
Secondary Research
- Annual Reports
- White Paper
- Latest Press Release
- Industry Association
- Paid Database
- Investor Presentations

Step 4 - Data Triangulation
Involves using different sources of information in order to increase the validity of a study
These sources are likely to be stakeholders in a program - participants, other researchers, program staff, other community members, and so on.
Then we put all data in single framework & apply various statistical tools to find out the dynamic on the market.
During the analysis stage, feedback from the stakeholder groups would be compared to determine areas of agreement as well as areas of divergence