

Key Insights
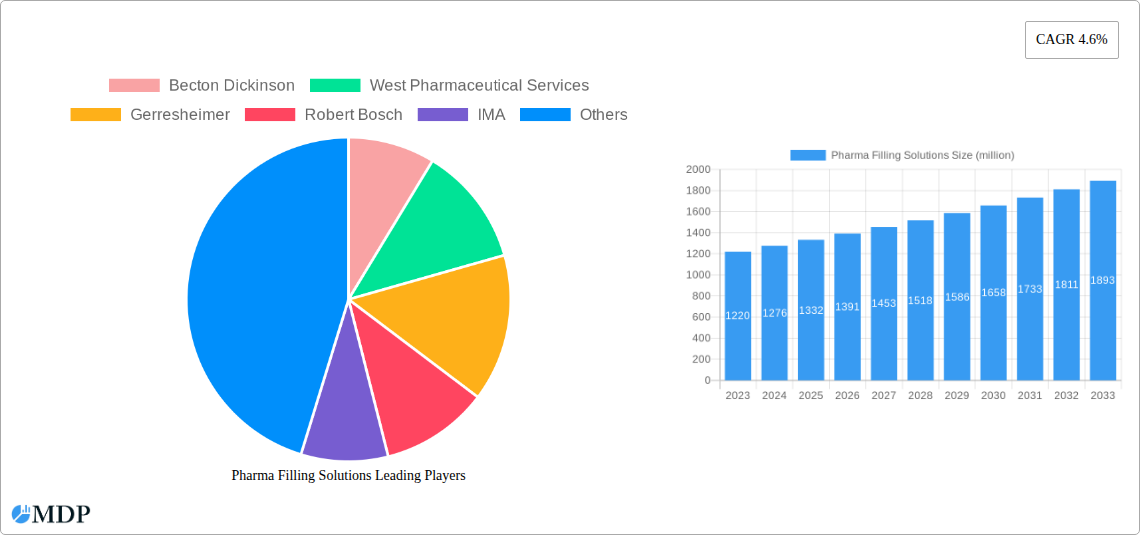
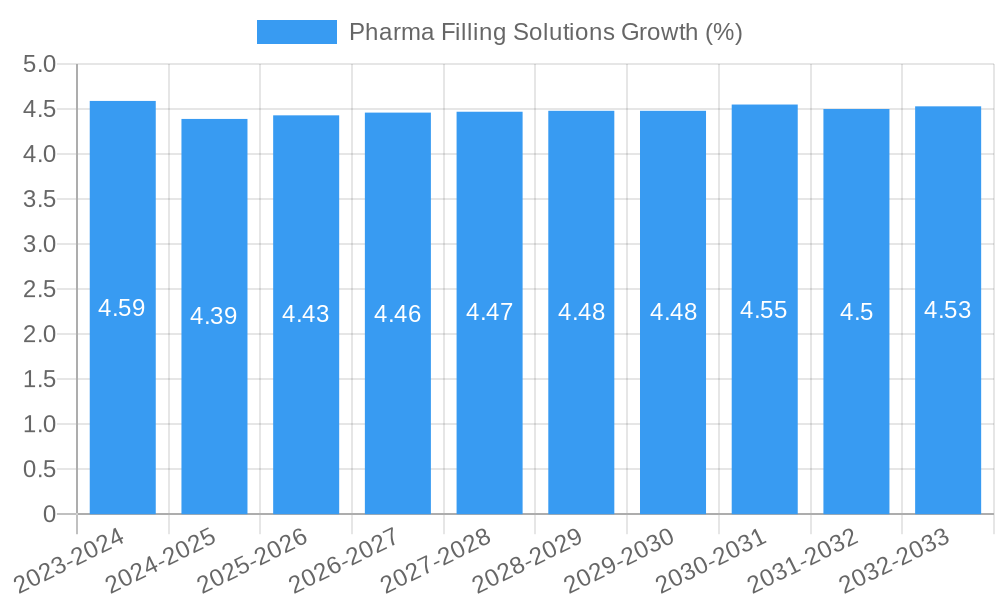
The global Pharma Filling Solutions market is poised for significant expansion, projected to reach approximately $1332 million by 2025, with a robust Compound Annual Growth Rate (CAGR) of 4.6% expected to carry the market through 2033. This sustained growth is fundamentally driven by the escalating global demand for pharmaceuticals, particularly in the wake of increased healthcare spending and the continuous development of novel drug formulations. The market's expansion is further fueled by advancements in automated filling technologies that enhance precision, efficiency, and sterility, crucial for minimizing contamination risks in drug manufacturing. Key trends include the increasing adoption of single-use systems, offering greater flexibility and reduced cross-contamination, and the integration of sophisticated data analytics and AI for process optimization and quality control. Furthermore, the growing prevalence of chronic diseases necessitates higher production volumes of both liquid and powder medications, directly stimulating the demand for advanced filling solutions.
The market's trajectory is characterized by a dynamic interplay of growth drivers and restraining factors. While the increasing focus on pharmaceutical product safety and the growing complexity of drug delivery systems are significant catalysts, regulatory stringency and the high initial investment required for advanced filling machinery present considerable challenges. However, the sector is actively responding to these restraints through innovation and the development of more cost-effective solutions. The market is broadly segmented by application into Liquid Medicine, Powder Medicine, and Others, with liquid and powder medicines dominating due to their widespread use. By type, Nonsterile Filling and Sterile Filling are critical, with sterile filling gaining prominence due to the rise of biologics and injectable drugs. Leading companies such as Becton Dickinson, West Pharmaceutical Services, and Gerresheimer are at the forefront, investing in research and development to meet evolving market demands and maintain a competitive edge in this vital segment of the pharmaceutical supply chain.
Pharma Filling Solutions Market Report: Unlocking Growth Opportunities (2019-2033)
Unlock critical insights into the dynamic Pharma Filling Solutions market with this comprehensive report. Covering the historical period of 2019-2024 and forecasting through 2033 with a base year of 2025, this report delves into market concentration, innovation, regulatory landscapes, and key industry developments. We analyze market segmentation by application (Liquid Medicine, Powder Medicine, Others) and type (Nonsterile Filling, Sterile Filling), highlighting leading markets and product innovations. Discover the driving forces behind market growth, prevailing challenges, and emerging opportunities, all while examining the strategies of key players such as Becton Dickinson, West Pharmaceutical Services, Gerresheimer, Robert Bosch, IMA, Optima, Bausch + Strobel, Romaco, CUBII, Dara Pharma, Sartorius, WMFTG US Biopharm, and All Fill.
Pharma Filling Solutions Market Dynamics & Concentration
The pharma filling solutions market, projected to reach xx million by 2025, exhibits a moderate level of concentration, with a few key players holding significant market share. Innovation is a primary driver, fueled by advancements in automation, aseptic processing, and serialization technologies. The market is shaped by stringent regulatory frameworks globally, emphasizing product safety and efficacy. While product substitutes are limited in core filling functions, alternative packaging formats and delivery systems can influence demand. End-user trends are dominated by the increasing demand for biologics, personalized medicine, and the growing prevalence of chronic diseases, all of which necessitate sophisticated and specialized filling solutions. Mergers and acquisitions (M&A) are a notable aspect of market dynamics, with an estimated xx major M&A deals in the historical period (2019-2024), consolidating expertise and expanding market reach. Key players like Becton Dickinson and West Pharmaceutical Services are actively involved in strategic acquisitions to bolster their portfolios and technological capabilities.
Pharma Filling Solutions Industry Trends & Analysis
The global pharma filling solutions market is poised for robust growth, driven by several interconnected trends. A significant growth driver is the escalating global healthcare expenditure, projected to exceed xx million by 2025, which directly translates into increased demand for pharmaceutical products and, consequently, filling solutions. The rising incidence of chronic diseases worldwide, coupled with an aging global population, further fuels the need for efficient and scalable drug manufacturing processes. Technological disruptions are revolutionizing the sector, with the adoption of advanced robotics, artificial intelligence (AI) for process optimization, and sophisticated aseptic filling technologies significantly improving precision and reducing contamination risks. The market penetration of sterile filling solutions, in particular, is expected to surge due to the growing demand for injectable drugs and biologics.
Consumer preferences are shifting towards more personalized medicine and targeted therapies, requiring flexible and adaptable filling systems capable of handling smaller batch sizes and a wider variety of drug formulations. This necessitates investment in advanced filling machines that can accommodate diverse product viscosities, fill volumes, and container types. The competitive landscape is characterized by intense rivalry among established players and emerging innovators, pushing companies to continuously invest in research and development to offer cutting-edge solutions. The compound annual growth rate (CAGR) for the pharma filling solutions market is estimated to be around xx% during the forecast period (2025–2033), indicating a healthy and sustained expansion. The increasing focus on drug safety and regulatory compliance, including the implementation of serialization and track-and-trace technologies, further propels the demand for integrated and intelligent filling systems. The integration of Industry 4.0 principles into manufacturing processes is another key trend, leading to the development of smart factories that offer enhanced efficiency, traceability, and data-driven decision-making capabilities. The market is witnessing a growing adoption of single-use technologies in aseptic filling, offering advantages in terms of sterility assurance and reduced cleaning validation efforts.
Leading Markets & Segments in Pharma Filling Solutions
The Liquid Medicine segment is the dominant force within the pharma filling solutions market, driven by the widespread prevalence of liquid-based pharmaceuticals across various therapeutic areas. This dominance is further amplified by the increasing global demand for oral liquids, injectables, and intravenous solutions. Within this segment, Sterile Filling operations are experiencing exceptional growth, a direct consequence of the burgeoning biologics and vaccine markets. The stringent requirements for sterility in these high-value drug products necessitate sophisticated aseptic filling technologies, making this a critical sub-segment.
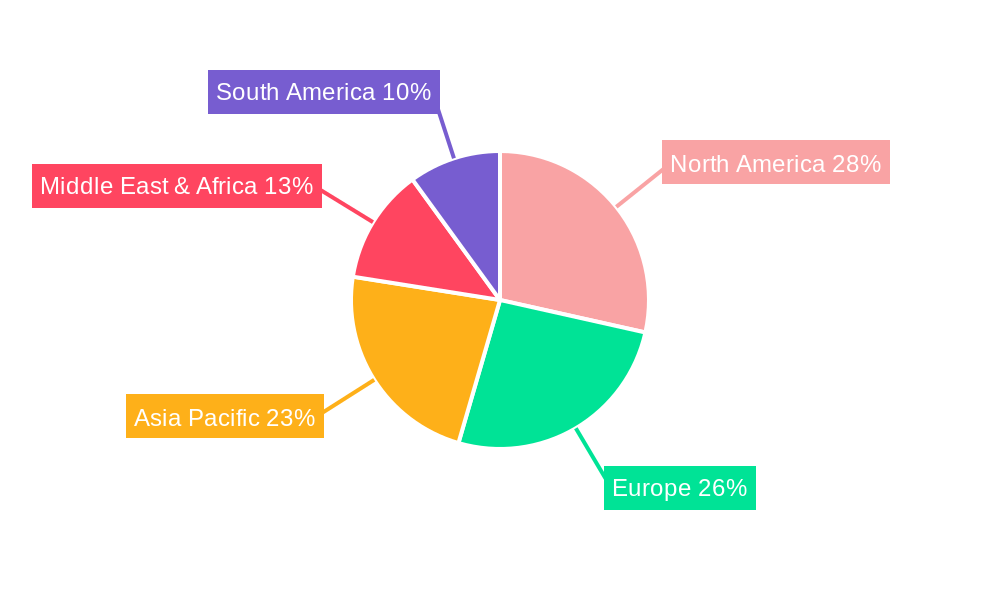
In terms of geographical reach, North America consistently emerges as a leading market for pharma filling solutions. This leadership is underpinned by several key drivers:
- Economic Policies: Favorable government initiatives supporting pharmaceutical R&D and manufacturing, including tax incentives and research grants, stimulate investment in advanced filling infrastructure. The presence of a robust pharmaceutical manufacturing base and a high concentration of drug development companies contribute significantly to market demand.
- Infrastructure: The region boasts a highly developed healthcare infrastructure, including advanced research institutions and hospitals, which are major consumers of pharmaceutical products. This drives a continuous need for reliable and efficient drug manufacturing, including filling processes.
- Technological Adoption: North America is at the forefront of adopting new technologies in pharmaceutical manufacturing, including advanced automation, robotics, and AI-powered solutions for filling. This encourages manufacturers to invest in cutting-edge filling equipment to maintain competitiveness.
- Regulatory Environment: While stringent, the regulatory framework in North America, spearheaded by agencies like the FDA, drives the adoption of high-quality and compliant filling solutions. Companies prioritize systems that ensure product integrity and patient safety, aligning with strict regulatory standards.
The Powder Medicine segment, while smaller than liquid medicine, is also experiencing steady growth, particularly with the rise of lyophilized products and dry powder inhalers. The Others segment, encompassing specialized applications like ophthalmic solutions and sterile powders, is a niche but rapidly evolving area, driven by personalized medicine and niche therapeutic developments. The overall market penetration of sterile filling solutions is expected to surpass xx% by 2025, reflecting the growing emphasis on injectable and biologic drug production.
Pharma Filling Solutions Product Developments
Recent product developments in the pharma filling solutions sector are characterized by a strong emphasis on automation, precision, and enhanced aseptic capabilities. Manufacturers are introducing advanced robotic filling systems that minimize human intervention, thereby reducing contamination risks and increasing operational efficiency. Innovations in high-speed filling machines for both liquid and powder formulations are also prevalent, catering to the growing demand for mass-produced pharmaceuticals. Furthermore, the integration of advanced sensor technologies and intelligent software allows for real-time process monitoring and control, ensuring superior product quality and batch consistency. The development of modular and flexible filling lines, capable of accommodating a wide range of container types and volumes, is another significant trend, offering pharmaceutical companies greater adaptability to market demands. These advancements provide a competitive advantage by improving throughput, reducing waste, and ensuring compliance with stringent regulatory standards.
Key Drivers of Pharma Filling Solutions Growth
Several interconnected factors are propelling the growth of the pharma filling solutions market. The escalating global demand for pharmaceuticals, driven by an aging population and the rising prevalence of chronic diseases, creates a foundational need for efficient drug production. Technological advancements, particularly in automation, robotics, and aseptic processing, are enabling higher precision, speed, and sterility assurance in filling operations. Regulatory mandates, such as serialization and track-and-trace requirements, are encouraging the adoption of sophisticated filling systems that can integrate these functionalities. Furthermore, the burgeoning biologics and personalized medicine sectors necessitate specialized and flexible filling solutions, opening up new avenues for growth. The increasing outsourcing of pharmaceutical manufacturing also contributes to market expansion as contract manufacturing organizations (CMOs) invest in advanced filling capabilities.
Challenges in the Pharma Filling Solutions Market
Despite its growth trajectory, the pharma filling solutions market faces several significant challenges. Stringent and evolving regulatory landscapes across different regions present a substantial hurdle, requiring continuous adaptation and investment in compliant technologies. High upfront capital costs associated with advanced filling equipment can be a barrier, especially for smaller pharmaceutical companies or emerging markets. The skilled labor shortage for operating and maintaining complex automated systems is another concern. Supply chain disruptions, as witnessed in recent years, can impact the availability of critical components and raw materials, affecting production timelines and costs. Intense price competition among manufacturers, coupled with the threat of counterfeit drugs, also puts pressure on profit margins.
Emerging Opportunities in Pharma Filling Solutions
The pharma filling solutions market is ripe with emerging opportunities fueled by groundbreaking technological advancements and evolving healthcare needs. The rapid expansion of the biologics and gene therapy sectors presents a significant opportunity for specialized aseptic filling solutions, requiring high containment and precision handling of sensitive drug products. The increasing adoption of personalized medicine and the development of targeted therapies demand flexible, multi-product filling systems capable of handling small batch sizes efficiently. The growing emphasis on sustainable manufacturing practices is driving demand for energy-efficient filling equipment and single-use technologies, reducing waste and environmental impact. Furthermore, the continuous push for digitalization and Industry 4.0 integration in pharmaceutical manufacturing opens avenues for smart, connected filling systems that offer enhanced data analytics, predictive maintenance, and real-time process optimization. Strategic partnerships between equipment manufacturers and pharmaceutical companies can accelerate innovation and market penetration of these advanced solutions.
Leading Players in the Pharma Filling Solutions Sector
- Becton Dickinson
- West Pharmaceutical Services
- Gerresheimer
- Robert Bosch
- IMA
- Optima
- Bausch + Strobel
- Romaco
- CUBII
- Dara Pharma
- Sartorius
- WMFTG US Biopharm
- All Fill
Key Milestones in Pharma Filling Solutions Industry
- 2019: Increased adoption of serialization technologies mandated by global regulations, driving demand for integrated filling and serialization solutions.
- 2020: Accelerated development and production of vaccines and therapeutics for global health crises, highlighting the critical role of efficient filling solutions and leading to increased investment in production capacity.
- 2021: Growing trend towards single-use filling technologies in aseptic processing, offering enhanced sterility assurance and reduced cross-contamination risks.
- 2022: Significant advancements in robotic and AI-driven automation for filling processes, enhancing precision, speed, and minimizing human intervention.
- 2023: Increased focus on flexible and modular filling systems to cater to the growing demand for personalized medicine and smaller batch sizes.
- 2024: Continued integration of Industry 4.0 principles, leading to the development of "smart" filling lines with advanced data analytics and IoT connectivity.
Strategic Outlook for Pharma Filling Solutions Market
The strategic outlook for the pharma filling solutions market is exceptionally positive, driven by sustained growth accelerators. The increasing global healthcare burden, coupled with an aging population, will continue to fuel the demand for a wide array of pharmaceutical products, necessitating advanced filling capabilities. The rapid evolution of biologics, gene therapies, and personalized medicine will create significant opportunities for specialized and highly precise filling solutions. Manufacturers who prioritize innovation in automation, aseptic technology, and digital integration will be well-positioned to capture market share. Furthermore, strategic partnerships and collaborations, particularly between equipment providers and pharmaceutical innovators, will be crucial for developing and deploying next-generation filling technologies. A focus on sustainability and efficiency will also be paramount, as the industry increasingly embraces environmentally conscious manufacturing practices.
Pharma Filling Solutions Segmentation
-
1. Application
- 1.1. Liquid Medicine
- 1.2. Powder Medicine
- 1.3. Others
-
2. Type
- 2.1. Nonsterile Filling
- 2.2. Sterile Filling
Pharma Filling Solutions Segmentation By Geography
-
1. North America
- 1.1. United States
- 1.2. Canada
- 1.3. Mexico
-
2. South America
- 2.1. Brazil
- 2.2. Argentina
- 2.3. Rest of South America
-
3. Europe
- 3.1. United Kingdom
- 3.2. Germany
- 3.3. France
- 3.4. Italy
- 3.5. Spain
- 3.6. Russia
- 3.7. Benelux
- 3.8. Nordics
- 3.9. Rest of Europe
-
4. Middle East & Africa
- 4.1. Turkey
- 4.2. Israel
- 4.3. GCC
- 4.4. North Africa
- 4.5. South Africa
- 4.6. Rest of Middle East & Africa
-
5. Asia Pacific
- 5.1. China
- 5.2. India
- 5.3. Japan
- 5.4. South Korea
- 5.5. ASEAN
- 5.6. Oceania
- 5.7. Rest of Asia Pacific
Pharma Filling Solutions REPORT HIGHLIGHTS
| Aspects | Details |
|---|---|
| Study Period | 2019-2033 |
| Base Year | 2024 |
| Estimated Year | 2025 |
| Forecast Period | 2025-2033 |
| Historical Period | 2019-2024 |
| Growth Rate | CAGR of 4.6% from 2019-2033 |
| Segmentation |
|
Table of Contents
- 1. Introduction
- 1.1. Research Scope
- 1.2. Market Segmentation
- 1.3. Research Methodology
- 1.4. Definitions and Assumptions
- 2. Executive Summary
- 2.1. Introduction
- 3. Market Dynamics
- 3.1. Introduction
- 3.2. Market Drivers
- 3.3. Market Restrains
- 3.4. Market Trends
- 4. Market Factor Analysis
- 4.1. Porters Five Forces
- 4.2. Supply/Value Chain
- 4.3. PESTEL analysis
- 4.4. Market Entropy
- 4.5. Patent/Trademark Analysis
- 5. Global Pharma Filling Solutions Analysis, Insights and Forecast, 2019-2031
- 5.1. Market Analysis, Insights and Forecast - by Application
- 5.1.1. Liquid Medicine
- 5.1.2. Powder Medicine
- 5.1.3. Others
- 5.2. Market Analysis, Insights and Forecast - by Type
- 5.2.1. Nonsterile Filling
- 5.2.2. Sterile Filling
- 5.3. Market Analysis, Insights and Forecast - by Region
- 5.3.1. North America
- 5.3.2. South America
- 5.3.3. Europe
- 5.3.4. Middle East & Africa
- 5.3.5. Asia Pacific
- 5.1. Market Analysis, Insights and Forecast - by Application
- 6. North America Pharma Filling Solutions Analysis, Insights and Forecast, 2019-2031
- 6.1. Market Analysis, Insights and Forecast - by Application
- 6.1.1. Liquid Medicine
- 6.1.2. Powder Medicine
- 6.1.3. Others
- 6.2. Market Analysis, Insights and Forecast - by Type
- 6.2.1. Nonsterile Filling
- 6.2.2. Sterile Filling
- 6.1. Market Analysis, Insights and Forecast - by Application
- 7. South America Pharma Filling Solutions Analysis, Insights and Forecast, 2019-2031
- 7.1. Market Analysis, Insights and Forecast - by Application
- 7.1.1. Liquid Medicine
- 7.1.2. Powder Medicine
- 7.1.3. Others
- 7.2. Market Analysis, Insights and Forecast - by Type
- 7.2.1. Nonsterile Filling
- 7.2.2. Sterile Filling
- 7.1. Market Analysis, Insights and Forecast - by Application
- 8. Europe Pharma Filling Solutions Analysis, Insights and Forecast, 2019-2031
- 8.1. Market Analysis, Insights and Forecast - by Application
- 8.1.1. Liquid Medicine
- 8.1.2. Powder Medicine
- 8.1.3. Others
- 8.2. Market Analysis, Insights and Forecast - by Type
- 8.2.1. Nonsterile Filling
- 8.2.2. Sterile Filling
- 8.1. Market Analysis, Insights and Forecast - by Application
- 9. Middle East & Africa Pharma Filling Solutions Analysis, Insights and Forecast, 2019-2031
- 9.1. Market Analysis, Insights and Forecast - by Application
- 9.1.1. Liquid Medicine
- 9.1.2. Powder Medicine
- 9.1.3. Others
- 9.2. Market Analysis, Insights and Forecast - by Type
- 9.2.1. Nonsterile Filling
- 9.2.2. Sterile Filling
- 9.1. Market Analysis, Insights and Forecast - by Application
- 10. Asia Pacific Pharma Filling Solutions Analysis, Insights and Forecast, 2019-2031
- 10.1. Market Analysis, Insights and Forecast - by Application
- 10.1.1. Liquid Medicine
- 10.1.2. Powder Medicine
- 10.1.3. Others
- 10.2. Market Analysis, Insights and Forecast - by Type
- 10.2.1. Nonsterile Filling
- 10.2.2. Sterile Filling
- 10.1. Market Analysis, Insights and Forecast - by Application
- 11. Competitive Analysis
- 11.1. Global Market Share Analysis 2024
- 11.2. Company Profiles
- 11.2.1 Becton Dickinson
- 11.2.1.1. Overview
- 11.2.1.2. Products
- 11.2.1.3. SWOT Analysis
- 11.2.1.4. Recent Developments
- 11.2.1.5. Financials (Based on Availability)
- 11.2.2 West Pharmaceutical Services
- 11.2.2.1. Overview
- 11.2.2.2. Products
- 11.2.2.3. SWOT Analysis
- 11.2.2.4. Recent Developments
- 11.2.2.5. Financials (Based on Availability)
- 11.2.3 Gerresheimer
- 11.2.3.1. Overview
- 11.2.3.2. Products
- 11.2.3.3. SWOT Analysis
- 11.2.3.4. Recent Developments
- 11.2.3.5. Financials (Based on Availability)
- 11.2.4 Robert Bosch
- 11.2.4.1. Overview
- 11.2.4.2. Products
- 11.2.4.3. SWOT Analysis
- 11.2.4.4. Recent Developments
- 11.2.4.5. Financials (Based on Availability)
- 11.2.5 IMA
- 11.2.5.1. Overview
- 11.2.5.2. Products
- 11.2.5.3. SWOT Analysis
- 11.2.5.4. Recent Developments
- 11.2.5.5. Financials (Based on Availability)
- 11.2.6 Optima
- 11.2.6.1. Overview
- 11.2.6.2. Products
- 11.2.6.3. SWOT Analysis
- 11.2.6.4. Recent Developments
- 11.2.6.5. Financials (Based on Availability)
- 11.2.7 Bausch + Strobel
- 11.2.7.1. Overview
- 11.2.7.2. Products
- 11.2.7.3. SWOT Analysis
- 11.2.7.4. Recent Developments
- 11.2.7.5. Financials (Based on Availability)
- 11.2.8 Romaco
- 11.2.8.1. Overview
- 11.2.8.2. Products
- 11.2.8.3. SWOT Analysis
- 11.2.8.4. Recent Developments
- 11.2.8.5. Financials (Based on Availability)
- 11.2.9 CUBII
- 11.2.9.1. Overview
- 11.2.9.2. Products
- 11.2.9.3. SWOT Analysis
- 11.2.9.4. Recent Developments
- 11.2.9.5. Financials (Based on Availability)
- 11.2.10 Dara Pharma
- 11.2.10.1. Overview
- 11.2.10.2. Products
- 11.2.10.3. SWOT Analysis
- 11.2.10.4. Recent Developments
- 11.2.10.5. Financials (Based on Availability)
- 11.2.11 Sartorius
- 11.2.11.1. Overview
- 11.2.11.2. Products
- 11.2.11.3. SWOT Analysis
- 11.2.11.4. Recent Developments
- 11.2.11.5. Financials (Based on Availability)
- 11.2.12 WMFTG US Biopharm
- 11.2.12.1. Overview
- 11.2.12.2. Products
- 11.2.12.3. SWOT Analysis
- 11.2.12.4. Recent Developments
- 11.2.12.5. Financials (Based on Availability)
- 11.2.13 All Fill
- 11.2.13.1. Overview
- 11.2.13.2. Products
- 11.2.13.3. SWOT Analysis
- 11.2.13.4. Recent Developments
- 11.2.13.5. Financials (Based on Availability)
- 11.2.1 Becton Dickinson
List of Figures
- Figure 1: Global Pharma Filling Solutions Revenue Breakdown (million, %) by Region 2024 & 2032
- Figure 2: North America Pharma Filling Solutions Revenue (million), by Application 2024 & 2032
- Figure 3: North America Pharma Filling Solutions Revenue Share (%), by Application 2024 & 2032
- Figure 4: North America Pharma Filling Solutions Revenue (million), by Type 2024 & 2032
- Figure 5: North America Pharma Filling Solutions Revenue Share (%), by Type 2024 & 2032
- Figure 6: North America Pharma Filling Solutions Revenue (million), by Country 2024 & 2032
- Figure 7: North America Pharma Filling Solutions Revenue Share (%), by Country 2024 & 2032
- Figure 8: South America Pharma Filling Solutions Revenue (million), by Application 2024 & 2032
- Figure 9: South America Pharma Filling Solutions Revenue Share (%), by Application 2024 & 2032
- Figure 10: South America Pharma Filling Solutions Revenue (million), by Type 2024 & 2032
- Figure 11: South America Pharma Filling Solutions Revenue Share (%), by Type 2024 & 2032
- Figure 12: South America Pharma Filling Solutions Revenue (million), by Country 2024 & 2032
- Figure 13: South America Pharma Filling Solutions Revenue Share (%), by Country 2024 & 2032
- Figure 14: Europe Pharma Filling Solutions Revenue (million), by Application 2024 & 2032
- Figure 15: Europe Pharma Filling Solutions Revenue Share (%), by Application 2024 & 2032
- Figure 16: Europe Pharma Filling Solutions Revenue (million), by Type 2024 & 2032
- Figure 17: Europe Pharma Filling Solutions Revenue Share (%), by Type 2024 & 2032
- Figure 18: Europe Pharma Filling Solutions Revenue (million), by Country 2024 & 2032
- Figure 19: Europe Pharma Filling Solutions Revenue Share (%), by Country 2024 & 2032
- Figure 20: Middle East & Africa Pharma Filling Solutions Revenue (million), by Application 2024 & 2032
- Figure 21: Middle East & Africa Pharma Filling Solutions Revenue Share (%), by Application 2024 & 2032
- Figure 22: Middle East & Africa Pharma Filling Solutions Revenue (million), by Type 2024 & 2032
- Figure 23: Middle East & Africa Pharma Filling Solutions Revenue Share (%), by Type 2024 & 2032
- Figure 24: Middle East & Africa Pharma Filling Solutions Revenue (million), by Country 2024 & 2032
- Figure 25: Middle East & Africa Pharma Filling Solutions Revenue Share (%), by Country 2024 & 2032
- Figure 26: Asia Pacific Pharma Filling Solutions Revenue (million), by Application 2024 & 2032
- Figure 27: Asia Pacific Pharma Filling Solutions Revenue Share (%), by Application 2024 & 2032
- Figure 28: Asia Pacific Pharma Filling Solutions Revenue (million), by Type 2024 & 2032
- Figure 29: Asia Pacific Pharma Filling Solutions Revenue Share (%), by Type 2024 & 2032
- Figure 30: Asia Pacific Pharma Filling Solutions Revenue (million), by Country 2024 & 2032
- Figure 31: Asia Pacific Pharma Filling Solutions Revenue Share (%), by Country 2024 & 2032
List of Tables
- Table 1: Global Pharma Filling Solutions Revenue million Forecast, by Region 2019 & 2032
- Table 2: Global Pharma Filling Solutions Revenue million Forecast, by Application 2019 & 2032
- Table 3: Global Pharma Filling Solutions Revenue million Forecast, by Type 2019 & 2032
- Table 4: Global Pharma Filling Solutions Revenue million Forecast, by Region 2019 & 2032
- Table 5: Global Pharma Filling Solutions Revenue million Forecast, by Application 2019 & 2032
- Table 6: Global Pharma Filling Solutions Revenue million Forecast, by Type 2019 & 2032
- Table 7: Global Pharma Filling Solutions Revenue million Forecast, by Country 2019 & 2032
- Table 8: United States Pharma Filling Solutions Revenue (million) Forecast, by Application 2019 & 2032
- Table 9: Canada Pharma Filling Solutions Revenue (million) Forecast, by Application 2019 & 2032
- Table 10: Mexico Pharma Filling Solutions Revenue (million) Forecast, by Application 2019 & 2032
- Table 11: Global Pharma Filling Solutions Revenue million Forecast, by Application 2019 & 2032
- Table 12: Global Pharma Filling Solutions Revenue million Forecast, by Type 2019 & 2032
- Table 13: Global Pharma Filling Solutions Revenue million Forecast, by Country 2019 & 2032
- Table 14: Brazil Pharma Filling Solutions Revenue (million) Forecast, by Application 2019 & 2032
- Table 15: Argentina Pharma Filling Solutions Revenue (million) Forecast, by Application 2019 & 2032
- Table 16: Rest of South America Pharma Filling Solutions Revenue (million) Forecast, by Application 2019 & 2032
- Table 17: Global Pharma Filling Solutions Revenue million Forecast, by Application 2019 & 2032
- Table 18: Global Pharma Filling Solutions Revenue million Forecast, by Type 2019 & 2032
- Table 19: Global Pharma Filling Solutions Revenue million Forecast, by Country 2019 & 2032
- Table 20: United Kingdom Pharma Filling Solutions Revenue (million) Forecast, by Application 2019 & 2032
- Table 21: Germany Pharma Filling Solutions Revenue (million) Forecast, by Application 2019 & 2032
- Table 22: France Pharma Filling Solutions Revenue (million) Forecast, by Application 2019 & 2032
- Table 23: Italy Pharma Filling Solutions Revenue (million) Forecast, by Application 2019 & 2032
- Table 24: Spain Pharma Filling Solutions Revenue (million) Forecast, by Application 2019 & 2032
- Table 25: Russia Pharma Filling Solutions Revenue (million) Forecast, by Application 2019 & 2032
- Table 26: Benelux Pharma Filling Solutions Revenue (million) Forecast, by Application 2019 & 2032
- Table 27: Nordics Pharma Filling Solutions Revenue (million) Forecast, by Application 2019 & 2032
- Table 28: Rest of Europe Pharma Filling Solutions Revenue (million) Forecast, by Application 2019 & 2032
- Table 29: Global Pharma Filling Solutions Revenue million Forecast, by Application 2019 & 2032
- Table 30: Global Pharma Filling Solutions Revenue million Forecast, by Type 2019 & 2032
- Table 31: Global Pharma Filling Solutions Revenue million Forecast, by Country 2019 & 2032
- Table 32: Turkey Pharma Filling Solutions Revenue (million) Forecast, by Application 2019 & 2032
- Table 33: Israel Pharma Filling Solutions Revenue (million) Forecast, by Application 2019 & 2032
- Table 34: GCC Pharma Filling Solutions Revenue (million) Forecast, by Application 2019 & 2032
- Table 35: North Africa Pharma Filling Solutions Revenue (million) Forecast, by Application 2019 & 2032
- Table 36: South Africa Pharma Filling Solutions Revenue (million) Forecast, by Application 2019 & 2032
- Table 37: Rest of Middle East & Africa Pharma Filling Solutions Revenue (million) Forecast, by Application 2019 & 2032
- Table 38: Global Pharma Filling Solutions Revenue million Forecast, by Application 2019 & 2032
- Table 39: Global Pharma Filling Solutions Revenue million Forecast, by Type 2019 & 2032
- Table 40: Global Pharma Filling Solutions Revenue million Forecast, by Country 2019 & 2032
- Table 41: China Pharma Filling Solutions Revenue (million) Forecast, by Application 2019 & 2032
- Table 42: India Pharma Filling Solutions Revenue (million) Forecast, by Application 2019 & 2032
- Table 43: Japan Pharma Filling Solutions Revenue (million) Forecast, by Application 2019 & 2032
- Table 44: South Korea Pharma Filling Solutions Revenue (million) Forecast, by Application 2019 & 2032
- Table 45: ASEAN Pharma Filling Solutions Revenue (million) Forecast, by Application 2019 & 2032
- Table 46: Oceania Pharma Filling Solutions Revenue (million) Forecast, by Application 2019 & 2032
- Table 47: Rest of Asia Pacific Pharma Filling Solutions Revenue (million) Forecast, by Application 2019 & 2032
Frequently Asked Questions
1. What is the projected Compound Annual Growth Rate (CAGR) of the Pharma Filling Solutions?
The projected CAGR is approximately 4.6%.
2. Which companies are prominent players in the Pharma Filling Solutions?
Key companies in the market include Becton Dickinson, West Pharmaceutical Services, Gerresheimer, Robert Bosch, IMA, Optima, Bausch + Strobel, Romaco, CUBII, Dara Pharma, Sartorius, WMFTG US Biopharm, All Fill.
3. What are the main segments of the Pharma Filling Solutions?
The market segments include Application, Type.
4. Can you provide details about the market size?
The market size is estimated to be USD 1332 million as of 2022.
5. What are some drivers contributing to market growth?
N/A
6. What are the notable trends driving market growth?
N/A
7. Are there any restraints impacting market growth?
N/A
8. Can you provide examples of recent developments in the market?
N/A
9. What pricing options are available for accessing the report?
Pricing options include single-user, multi-user, and enterprise licenses priced at USD 3950.00, USD 5925.00, and USD 7900.00 respectively.
10. Is the market size provided in terms of value or volume?
The market size is provided in terms of value, measured in million.
11. Are there any specific market keywords associated with the report?
Yes, the market keyword associated with the report is "Pharma Filling Solutions," which aids in identifying and referencing the specific market segment covered.
12. How do I determine which pricing option suits my needs best?
The pricing options vary based on user requirements and access needs. Individual users may opt for single-user licenses, while businesses requiring broader access may choose multi-user or enterprise licenses for cost-effective access to the report.
13. Are there any additional resources or data provided in the Pharma Filling Solutions report?
While the report offers comprehensive insights, it's advisable to review the specific contents or supplementary materials provided to ascertain if additional resources or data are available.
14. How can I stay updated on further developments or reports in the Pharma Filling Solutions?
To stay informed about further developments, trends, and reports in the Pharma Filling Solutions, consider subscribing to industry newsletters, following relevant companies and organizations, or regularly checking reputable industry news sources and publications.
Methodology
Step 1 - Identification of Relevant Samples Size from Population Database


Step 2 - Approaches for Defining Global Market Size (Value, Volume* & Price*)

Note*: In applicable scenarios
Step 3 - Data Sources
Primary Research
- Web Analytics
- Survey Reports
- Research Institute
- Latest Research Reports
- Opinion Leaders
Secondary Research
- Annual Reports
- White Paper
- Latest Press Release
- Industry Association
- Paid Database
- Investor Presentations

Step 4 - Data Triangulation
Involves using different sources of information in order to increase the validity of a study
These sources are likely to be stakeholders in a program - participants, other researchers, program staff, other community members, and so on.
Then we put all data in single framework & apply various statistical tools to find out the dynamic on the market.
During the analysis stage, feedback from the stakeholder groups would be compared to determine areas of agreement as well as areas of divergence
