

Key Insights
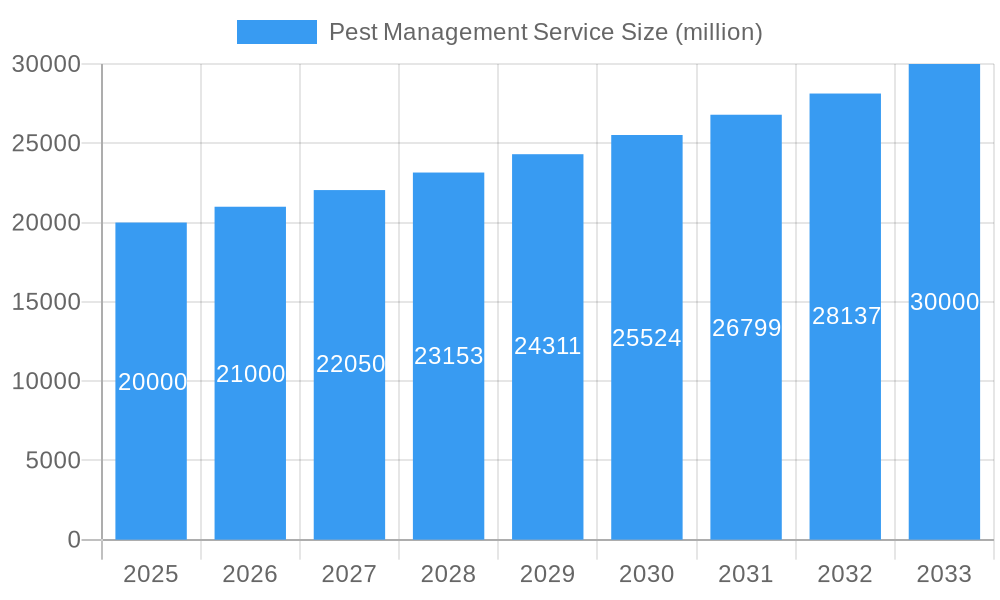
The global pest management services market is experiencing robust growth, driven by factors such as increasing urbanization, rising awareness of pest-borne diseases, and stricter government regulations regarding hygiene and sanitation. The market, estimated at $20 billion in 2025, is projected to exhibit a Compound Annual Growth Rate (CAGR) of 5% over the forecast period (2025-2033), reaching an estimated value exceeding $30 billion by 2033. This expansion is fueled by the increasing prevalence of pests resistant to traditional methods, necessitating advanced and integrated pest management strategies. The demand for professional pest control services is particularly high in densely populated areas and regions with favorable climates for pest proliferation. The market segmentation reveals a significant share held by chemical management services, although the demand for eco-friendly, physical management solutions is rapidly growing, driven by environmental concerns and consumer preferences. Ants and termites, along with flies and mosquitoes, constitute the largest application segments due to their prevalence and the potential health risks associated with them. Key players in the market, including BASF, Ecolab, Rollins, and Terminix, are investing heavily in research and development to develop innovative pest control solutions, further fueling market growth. Geographic distribution shows a concentration of the market in North America and Europe, but significant growth potential exists in developing regions of Asia and Africa.
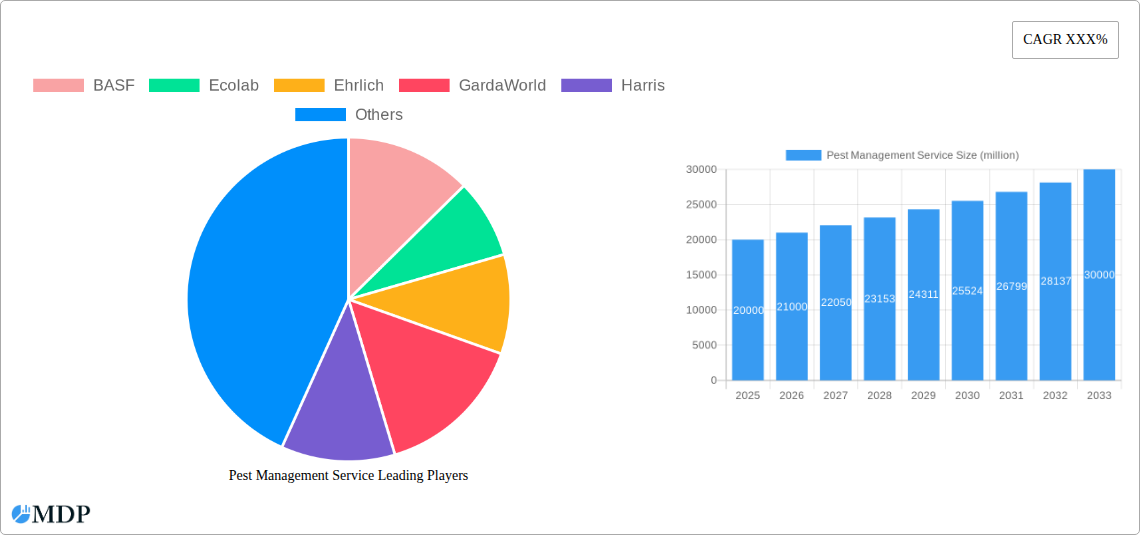
Pest Management Service Market Size (In Billion)
The competitive landscape is characterized by a mix of large multinational corporations and smaller, regional players. Larger companies benefit from economies of scale and a wider range of services, while smaller firms often offer more localized expertise and personalized customer service. Future growth will likely depend on factors such as technological advancements, including the development of more effective and environmentally friendly pesticides, improved monitoring technologies, and the integration of smart technologies into pest management strategies. Furthermore, the increasing adoption of integrated pest management (IPM) practices, which emphasize preventative measures and sustainable solutions, will shape the market landscape in the coming years. Companies that successfully adapt to these trends and cater to evolving customer preferences are expected to capture a significant market share.
Pest Management Service Company Market Share
Pest Management Service Market Report: A Comprehensive Analysis of a Multi-Billion Dollar Industry (2019-2033)
This in-depth report provides a comprehensive analysis of the global pest management service market, projecting a market value exceeding $XX billion by 2033. The study covers the period from 2019 to 2033, with a focus on the 2025-2033 forecast period. This report is essential for industry stakeholders, investors, and businesses seeking to understand the market dynamics, growth drivers, and competitive landscape of this vital sector. It leverages rigorous data analysis and expert insights to deliver actionable intelligence.
Pest Management Service Market Dynamics & Concentration
The global pest management service market is characterized by a moderately concentrated landscape, with key players like BASF, Ecolab, Ehrlich Pest Control, GardaWorld, Harris Pest Control, Johnson Group, Orkin, PSIPL, Rollins, Saela, Smithereen Pest Management, Sunrise Pest Management, Syngenta, and Terminix holding significant market share. Market concentration is further analyzed through the Herfindahl-Hirschman Index (HHI), revealing a value of xx, indicating a moderately concentrated market.
Innovation, particularly in environmentally friendly pest control solutions, is a key driver. Stringent regulatory frameworks, including those focused on pesticide use and worker safety, significantly influence market dynamics. The increasing availability of substitute pest control methods, such as integrated pest management (IPM) techniques, presents both challenges and opportunities. End-user trends, including growing awareness of pest-borne diseases and increased demand for professional pest control services in both residential and commercial sectors, are driving market expansion. Furthermore, the report analyzes a significant number of M&A activities during the historical period (2019-2024), with xx major deals recorded, indicating a trend of consolidation within the industry.
Pest Management Service Industry Trends & Analysis
The global pest management service market exhibits robust growth, driven by several factors. The Compound Annual Growth Rate (CAGR) is estimated at xx% during the forecast period (2025-2033). Increased urbanization and population density lead to higher pest infestations, fueling demand for professional services. Technological disruptions, such as the development of advanced monitoring systems and targeted pest control solutions, are enhancing efficiency and effectiveness. Changing consumer preferences, with a growing preference for eco-friendly and integrated pest management approaches, significantly impact market dynamics. The competitive landscape is dynamic, with established players facing challenges from smaller, specialized firms offering innovative solutions. Market penetration of IPM strategies is increasing, reaching xx% in 2025, reflecting a shift toward sustainable pest management practices.
Leading Markets & Segments in Pest Management Service
The North American region dominates the global pest management service market, primarily driven by high disposable incomes, stringent health regulations, and a robust commercial sector. Within application segments, Ants & Termites and Bedbugs & Cockroaches represent the largest revenue streams, due to their prevalence and the associated health risks. Chemical Management Services currently hold the largest market share compared to physical management services, reflecting the continued reliance on chemical pesticides.
Key Drivers:
- North America: High disposable incomes, stringent building codes, and robust commercial infrastructure contribute significantly to market growth.
- Ants & Termites: High prevalence and structural damage necessitate frequent professional interventions.
- Bedbugs & Cockroaches: Public health concerns associated with these pests fuel high demand for effective control measures.
- Chemical Management Services: Established efficacy and widespread availability contribute to a significant market share.
Pest Management Service Product Developments
Recent years have witnessed significant innovation in pest management products and services. Technological advancements, such as targeted pest control solutions (e.g., pheromone traps, RNA interference), advanced monitoring technologies, and eco-friendly pesticides are shaping the industry. These innovations enhance effectiveness, reduce environmental impact, and improve overall cost-efficiency, thereby gaining wider market acceptance.
Key Drivers of Pest Management Service Growth
The growth of the pest management service market is driven by a confluence of factors. Technological advancements in pest control methods, including targeted solutions and remote monitoring systems, are boosting efficiency and effectiveness. Economic growth, particularly in developing economies, correlates positively with increased demand for pest control services. Stringent regulatory frameworks promoting public health and environmental protection further incentivize the adoption of professional pest management solutions.
Challenges in the Pest Management Service Market
The pest management service market faces several challenges. Regulatory hurdles and varying pesticide regulations across regions create complexities for companies operating globally. Supply chain disruptions and fluctuations in the prices of raw materials, such as pesticides, affect profitability. Intense competition from established players and emerging firms, including those offering alternative pest control solutions, exerts downward pressure on pricing. These factors collectively impact the market's overall growth trajectory by an estimated xx%.
Emerging Opportunities in Pest Management Service
Several emerging opportunities promise long-term growth for the pest management service market. Technological breakthroughs, particularly in artificial intelligence (AI)-powered pest monitoring and predictive analytics, will optimize service delivery and resource allocation. Strategic partnerships and collaborations between pest management companies and technology providers are fostering innovation. Expansion into underserved markets and the adoption of integrated pest management strategies are key pathways to future growth.
Leading Players in the Pest Management Service Sector
- BASF
- Ecolab
- Ehrlich Pest Control
- GardaWorld
- Harris Pest Control
- Johnson Group
- Orkin
- PSIPL
- Rollins
- Saela
- Smithereen Pest Management
- Sunrise Pest Management
- Syngenta
- Terminix
Key Milestones in Pest Management Service Industry
- 2020: Increased adoption of digital pest monitoring systems.
- 2021: Launch of several eco-friendly pesticide products.
- 2022: Merger between two major pest control companies in the US.
- 2023: Regulatory changes impacting pesticide use in several key regions.
- 2024: Significant investment in R&D for targeted pest control technologies.
Strategic Outlook for Pest Management Service Market
The future of the pest management service market is bright, driven by sustained demand, technological advancements, and strategic investments. The increasing prevalence of pest-borne diseases and the growing awareness of their health impacts will continue to fuel demand. Continued innovation in targeted pest control, sustainable solutions, and data-driven services will shape the industry's evolution. Strategic partnerships and mergers will play a key role in consolidating market share and driving further growth.
Pest Management Service Segmentation
-
1. Application
- 1.1. Ants & Termites
- 1.2. Flies & Mosquitoes
- 1.3. Bedbugs & Cockroaches
- 1.4. Other
-
2. Type
- 2.1. Physical Management Services
- 2.2. Chemical Management Services
Pest Management Service Segmentation By Geography
-
1. North America
- 1.1. United States
- 1.2. Canada
- 1.3. Mexico
-
2. South America
- 2.1. Brazil
- 2.2. Argentina
- 2.3. Rest of South America
-
3. Europe
- 3.1. United Kingdom
- 3.2. Germany
- 3.3. France
- 3.4. Italy
- 3.5. Spain
- 3.6. Russia
- 3.7. Benelux
- 3.8. Nordics
- 3.9. Rest of Europe
-
4. Middle East & Africa
- 4.1. Turkey
- 4.2. Israel
- 4.3. GCC
- 4.4. North Africa
- 4.5. South Africa
- 4.6. Rest of Middle East & Africa
-
5. Asia Pacific
- 5.1. China
- 5.2. India
- 5.3. Japan
- 5.4. South Korea
- 5.5. ASEAN
- 5.6. Oceania
- 5.7. Rest of Asia Pacific
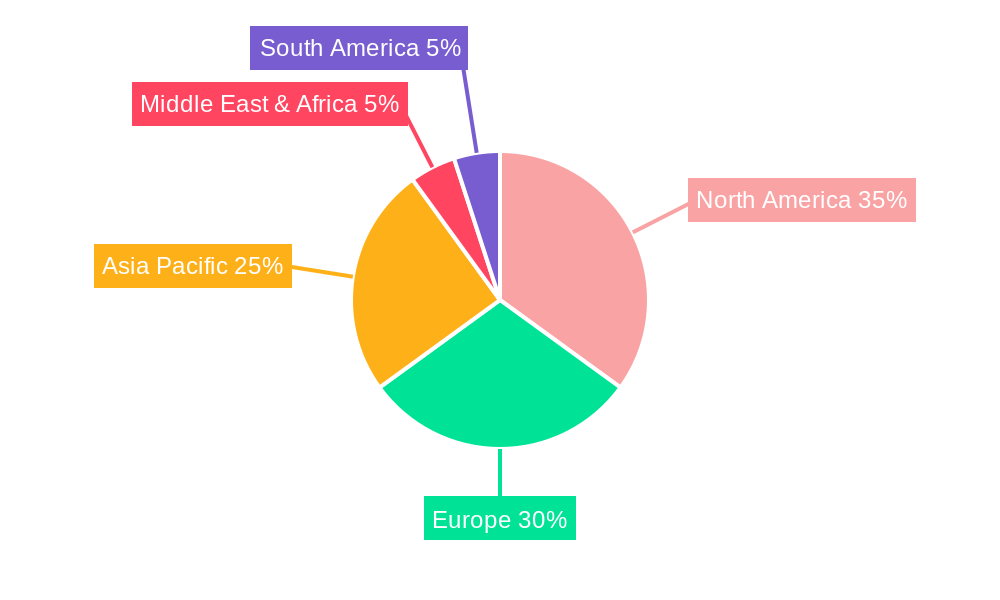
Pest Management Service Regional Market Share
Geographic Coverage of Pest Management Service
Pest Management Service REPORT HIGHLIGHTS
| Aspects | Details |
|---|---|
| Study Period | 2020-2034 |
| Base Year | 2025 |
| Estimated Year | 2026 |
| Forecast Period | 2026-2034 |
| Historical Period | 2020-2025 |
| Growth Rate | CAGR of 6.58% from 2020-2034 |
| Segmentation |
|
Table of Contents
- 1. Introduction
- 1.1. Research Scope
- 1.2. Market Segmentation
- 1.3. Research Methodology
- 1.4. Definitions and Assumptions
- 2. Executive Summary
- 2.1. Introduction
- 3. Market Dynamics
- 3.1. Introduction
- 3.2. Market Drivers
- 3.3. Market Restrains
- 3.4. Market Trends
- 4. Market Factor Analysis
- 4.1. Porters Five Forces
- 4.2. Supply/Value Chain
- 4.3. PESTEL analysis
- 4.4. Market Entropy
- 4.5. Patent/Trademark Analysis
- 5. Global Pest Management Service Analysis, Insights and Forecast, 2020-2032
- 5.1. Market Analysis, Insights and Forecast - by Application
- 5.1.1. Ants & Termites
- 5.1.2. Flies & Mosquitoes
- 5.1.3. Bedbugs & Cockroaches
- 5.1.4. Other
- 5.2. Market Analysis, Insights and Forecast - by Type
- 5.2.1. Physical Management Services
- 5.2.2. Chemical Management Services
- 5.3. Market Analysis, Insights and Forecast - by Region
- 5.3.1. North America
- 5.3.2. South America
- 5.3.3. Europe
- 5.3.4. Middle East & Africa
- 5.3.5. Asia Pacific
- 5.1. Market Analysis, Insights and Forecast - by Application
- 6. North America Pest Management Service Analysis, Insights and Forecast, 2020-2032
- 6.1. Market Analysis, Insights and Forecast - by Application
- 6.1.1. Ants & Termites
- 6.1.2. Flies & Mosquitoes
- 6.1.3. Bedbugs & Cockroaches
- 6.1.4. Other
- 6.2. Market Analysis, Insights and Forecast - by Type
- 6.2.1. Physical Management Services
- 6.2.2. Chemical Management Services
- 6.1. Market Analysis, Insights and Forecast - by Application
- 7. South America Pest Management Service Analysis, Insights and Forecast, 2020-2032
- 7.1. Market Analysis, Insights and Forecast - by Application
- 7.1.1. Ants & Termites
- 7.1.2. Flies & Mosquitoes
- 7.1.3. Bedbugs & Cockroaches
- 7.1.4. Other
- 7.2. Market Analysis, Insights and Forecast - by Type
- 7.2.1. Physical Management Services
- 7.2.2. Chemical Management Services
- 7.1. Market Analysis, Insights and Forecast - by Application
- 8. Europe Pest Management Service Analysis, Insights and Forecast, 2020-2032
- 8.1. Market Analysis, Insights and Forecast - by Application
- 8.1.1. Ants & Termites
- 8.1.2. Flies & Mosquitoes
- 8.1.3. Bedbugs & Cockroaches
- 8.1.4. Other
- 8.2. Market Analysis, Insights and Forecast - by Type
- 8.2.1. Physical Management Services
- 8.2.2. Chemical Management Services
- 8.1. Market Analysis, Insights and Forecast - by Application
- 9. Middle East & Africa Pest Management Service Analysis, Insights and Forecast, 2020-2032
- 9.1. Market Analysis, Insights and Forecast - by Application
- 9.1.1. Ants & Termites
- 9.1.2. Flies & Mosquitoes
- 9.1.3. Bedbugs & Cockroaches
- 9.1.4. Other
- 9.2. Market Analysis, Insights and Forecast - by Type
- 9.2.1. Physical Management Services
- 9.2.2. Chemical Management Services
- 9.1. Market Analysis, Insights and Forecast - by Application
- 10. Asia Pacific Pest Management Service Analysis, Insights and Forecast, 2020-2032
- 10.1. Market Analysis, Insights and Forecast - by Application
- 10.1.1. Ants & Termites
- 10.1.2. Flies & Mosquitoes
- 10.1.3. Bedbugs & Cockroaches
- 10.1.4. Other
- 10.2. Market Analysis, Insights and Forecast - by Type
- 10.2.1. Physical Management Services
- 10.2.2. Chemical Management Services
- 10.1. Market Analysis, Insights and Forecast - by Application
- 11. Competitive Analysis
- 11.1. Global Market Share Analysis 2025
- 11.2. Company Profiles
- 11.2.1 BASF
- 11.2.1.1. Overview
- 11.2.1.2. Products
- 11.2.1.3. SWOT Analysis
- 11.2.1.4. Recent Developments
- 11.2.1.5. Financials (Based on Availability)
- 11.2.2 Ecolab
- 11.2.2.1. Overview
- 11.2.2.2. Products
- 11.2.2.3. SWOT Analysis
- 11.2.2.4. Recent Developments
- 11.2.2.5. Financials (Based on Availability)
- 11.2.3 Ehrlich
- 11.2.3.1. Overview
- 11.2.3.2. Products
- 11.2.3.3. SWOT Analysis
- 11.2.3.4. Recent Developments
- 11.2.3.5. Financials (Based on Availability)
- 11.2.4 GardaWorld
- 11.2.4.1. Overview
- 11.2.4.2. Products
- 11.2.4.3. SWOT Analysis
- 11.2.4.4. Recent Developments
- 11.2.4.5. Financials (Based on Availability)
- 11.2.5 Harris
- 11.2.5.1. Overview
- 11.2.5.2. Products
- 11.2.5.3. SWOT Analysis
- 11.2.5.4. Recent Developments
- 11.2.5.5. Financials (Based on Availability)
- 11.2.6 Johnson Group
- 11.2.6.1. Overview
- 11.2.6.2. Products
- 11.2.6.3. SWOT Analysis
- 11.2.6.4. Recent Developments
- 11.2.6.5. Financials (Based on Availability)
- 11.2.7 Orkin
- 11.2.7.1. Overview
- 11.2.7.2. Products
- 11.2.7.3. SWOT Analysis
- 11.2.7.4. Recent Developments
- 11.2.7.5. Financials (Based on Availability)
- 11.2.8 PSIPL
- 11.2.8.1. Overview
- 11.2.8.2. Products
- 11.2.8.3. SWOT Analysis
- 11.2.8.4. Recent Developments
- 11.2.8.5. Financials (Based on Availability)
- 11.2.9 Rollins
- 11.2.9.1. Overview
- 11.2.9.2. Products
- 11.2.9.3. SWOT Analysis
- 11.2.9.4. Recent Developments
- 11.2.9.5. Financials (Based on Availability)
- 11.2.10 Saela
- 11.2.10.1. Overview
- 11.2.10.2. Products
- 11.2.10.3. SWOT Analysis
- 11.2.10.4. Recent Developments
- 11.2.10.5. Financials (Based on Availability)
- 11.2.11 Smithereen Pest Management
- 11.2.11.1. Overview
- 11.2.11.2. Products
- 11.2.11.3. SWOT Analysis
- 11.2.11.4. Recent Developments
- 11.2.11.5. Financials (Based on Availability)
- 11.2.12 Sunrise Pest Management
- 11.2.12.1. Overview
- 11.2.12.2. Products
- 11.2.12.3. SWOT Analysis
- 11.2.12.4. Recent Developments
- 11.2.12.5. Financials (Based on Availability)
- 11.2.13 Syngenta
- 11.2.13.1. Overview
- 11.2.13.2. Products
- 11.2.13.3. SWOT Analysis
- 11.2.13.4. Recent Developments
- 11.2.13.5. Financials (Based on Availability)
- 11.2.14 Terminix
- 11.2.14.1. Overview
- 11.2.14.2. Products
- 11.2.14.3. SWOT Analysis
- 11.2.14.4. Recent Developments
- 11.2.14.5. Financials (Based on Availability)
- 11.2.1 BASF
List of Figures
- Figure 1: Global Pest Management Service Revenue Breakdown (undefined, %) by Region 2025 & 2033
- Figure 2: North America Pest Management Service Revenue (undefined), by Application 2025 & 2033
- Figure 3: North America Pest Management Service Revenue Share (%), by Application 2025 & 2033
- Figure 4: North America Pest Management Service Revenue (undefined), by Type 2025 & 2033
- Figure 5: North America Pest Management Service Revenue Share (%), by Type 2025 & 2033
- Figure 6: North America Pest Management Service Revenue (undefined), by Country 2025 & 2033
- Figure 7: North America Pest Management Service Revenue Share (%), by Country 2025 & 2033
- Figure 8: South America Pest Management Service Revenue (undefined), by Application 2025 & 2033
- Figure 9: South America Pest Management Service Revenue Share (%), by Application 2025 & 2033
- Figure 10: South America Pest Management Service Revenue (undefined), by Type 2025 & 2033
- Figure 11: South America Pest Management Service Revenue Share (%), by Type 2025 & 2033
- Figure 12: South America Pest Management Service Revenue (undefined), by Country 2025 & 2033
- Figure 13: South America Pest Management Service Revenue Share (%), by Country 2025 & 2033
- Figure 14: Europe Pest Management Service Revenue (undefined), by Application 2025 & 2033
- Figure 15: Europe Pest Management Service Revenue Share (%), by Application 2025 & 2033
- Figure 16: Europe Pest Management Service Revenue (undefined), by Type 2025 & 2033
- Figure 17: Europe Pest Management Service Revenue Share (%), by Type 2025 & 2033
- Figure 18: Europe Pest Management Service Revenue (undefined), by Country 2025 & 2033
- Figure 19: Europe Pest Management Service Revenue Share (%), by Country 2025 & 2033
- Figure 20: Middle East & Africa Pest Management Service Revenue (undefined), by Application 2025 & 2033
- Figure 21: Middle East & Africa Pest Management Service Revenue Share (%), by Application 2025 & 2033
- Figure 22: Middle East & Africa Pest Management Service Revenue (undefined), by Type 2025 & 2033
- Figure 23: Middle East & Africa Pest Management Service Revenue Share (%), by Type 2025 & 2033
- Figure 24: Middle East & Africa Pest Management Service Revenue (undefined), by Country 2025 & 2033
- Figure 25: Middle East & Africa Pest Management Service Revenue Share (%), by Country 2025 & 2033
- Figure 26: Asia Pacific Pest Management Service Revenue (undefined), by Application 2025 & 2033
- Figure 27: Asia Pacific Pest Management Service Revenue Share (%), by Application 2025 & 2033
- Figure 28: Asia Pacific Pest Management Service Revenue (undefined), by Type 2025 & 2033
- Figure 29: Asia Pacific Pest Management Service Revenue Share (%), by Type 2025 & 2033
- Figure 30: Asia Pacific Pest Management Service Revenue (undefined), by Country 2025 & 2033
- Figure 31: Asia Pacific Pest Management Service Revenue Share (%), by Country 2025 & 2033
List of Tables
- Table 1: Global Pest Management Service Revenue undefined Forecast, by Application 2020 & 2033
- Table 2: Global Pest Management Service Revenue undefined Forecast, by Type 2020 & 2033
- Table 3: Global Pest Management Service Revenue undefined Forecast, by Region 2020 & 2033
- Table 4: Global Pest Management Service Revenue undefined Forecast, by Application 2020 & 2033
- Table 5: Global Pest Management Service Revenue undefined Forecast, by Type 2020 & 2033
- Table 6: Global Pest Management Service Revenue undefined Forecast, by Country 2020 & 2033
- Table 7: United States Pest Management Service Revenue (undefined) Forecast, by Application 2020 & 2033
- Table 8: Canada Pest Management Service Revenue (undefined) Forecast, by Application 2020 & 2033
- Table 9: Mexico Pest Management Service Revenue (undefined) Forecast, by Application 2020 & 2033
- Table 10: Global Pest Management Service Revenue undefined Forecast, by Application 2020 & 2033
- Table 11: Global Pest Management Service Revenue undefined Forecast, by Type 2020 & 2033
- Table 12: Global Pest Management Service Revenue undefined Forecast, by Country 2020 & 2033
- Table 13: Brazil Pest Management Service Revenue (undefined) Forecast, by Application 2020 & 2033
- Table 14: Argentina Pest Management Service Revenue (undefined) Forecast, by Application 2020 & 2033
- Table 15: Rest of South America Pest Management Service Revenue (undefined) Forecast, by Application 2020 & 2033
- Table 16: Global Pest Management Service Revenue undefined Forecast, by Application 2020 & 2033
- Table 17: Global Pest Management Service Revenue undefined Forecast, by Type 2020 & 2033
- Table 18: Global Pest Management Service Revenue undefined Forecast, by Country 2020 & 2033
- Table 19: United Kingdom Pest Management Service Revenue (undefined) Forecast, by Application 2020 & 2033
- Table 20: Germany Pest Management Service Revenue (undefined) Forecast, by Application 2020 & 2033
- Table 21: France Pest Management Service Revenue (undefined) Forecast, by Application 2020 & 2033
- Table 22: Italy Pest Management Service Revenue (undefined) Forecast, by Application 2020 & 2033
- Table 23: Spain Pest Management Service Revenue (undefined) Forecast, by Application 2020 & 2033
- Table 24: Russia Pest Management Service Revenue (undefined) Forecast, by Application 2020 & 2033
- Table 25: Benelux Pest Management Service Revenue (undefined) Forecast, by Application 2020 & 2033
- Table 26: Nordics Pest Management Service Revenue (undefined) Forecast, by Application 2020 & 2033
- Table 27: Rest of Europe Pest Management Service Revenue (undefined) Forecast, by Application 2020 & 2033
- Table 28: Global Pest Management Service Revenue undefined Forecast, by Application 2020 & 2033
- Table 29: Global Pest Management Service Revenue undefined Forecast, by Type 2020 & 2033
- Table 30: Global Pest Management Service Revenue undefined Forecast, by Country 2020 & 2033
- Table 31: Turkey Pest Management Service Revenue (undefined) Forecast, by Application 2020 & 2033
- Table 32: Israel Pest Management Service Revenue (undefined) Forecast, by Application 2020 & 2033
- Table 33: GCC Pest Management Service Revenue (undefined) Forecast, by Application 2020 & 2033
- Table 34: North Africa Pest Management Service Revenue (undefined) Forecast, by Application 2020 & 2033
- Table 35: South Africa Pest Management Service Revenue (undefined) Forecast, by Application 2020 & 2033
- Table 36: Rest of Middle East & Africa Pest Management Service Revenue (undefined) Forecast, by Application 2020 & 2033
- Table 37: Global Pest Management Service Revenue undefined Forecast, by Application 2020 & 2033
- Table 38: Global Pest Management Service Revenue undefined Forecast, by Type 2020 & 2033
- Table 39: Global Pest Management Service Revenue undefined Forecast, by Country 2020 & 2033
- Table 40: China Pest Management Service Revenue (undefined) Forecast, by Application 2020 & 2033
- Table 41: India Pest Management Service Revenue (undefined) Forecast, by Application 2020 & 2033
- Table 42: Japan Pest Management Service Revenue (undefined) Forecast, by Application 2020 & 2033
- Table 43: South Korea Pest Management Service Revenue (undefined) Forecast, by Application 2020 & 2033
- Table 44: ASEAN Pest Management Service Revenue (undefined) Forecast, by Application 2020 & 2033
- Table 45: Oceania Pest Management Service Revenue (undefined) Forecast, by Application 2020 & 2033
- Table 46: Rest of Asia Pacific Pest Management Service Revenue (undefined) Forecast, by Application 2020 & 2033
Frequently Asked Questions
1. What is the projected Compound Annual Growth Rate (CAGR) of the Pest Management Service?
The projected CAGR is approximately 6.58%.
2. Which companies are prominent players in the Pest Management Service?
Key companies in the market include BASF, Ecolab, Ehrlich, GardaWorld, Harris, Johnson Group, Orkin, PSIPL, Rollins, Saela, Smithereen Pest Management, Sunrise Pest Management, Syngenta, Terminix.
3. What are the main segments of the Pest Management Service?
The market segments include Application, Type.
4. Can you provide details about the market size?
The market size is estimated to be USD XXX N/A as of 2022.
5. What are some drivers contributing to market growth?
N/A
6. What are the notable trends driving market growth?
N/A
7. Are there any restraints impacting market growth?
N/A
8. Can you provide examples of recent developments in the market?
N/A
9. What pricing options are available for accessing the report?
Pricing options include single-user, multi-user, and enterprise licenses priced at USD 2900.00, USD 4350.00, and USD 5800.00 respectively.
10. Is the market size provided in terms of value or volume?
The market size is provided in terms of value, measured in N/A.
11. Are there any specific market keywords associated with the report?
Yes, the market keyword associated with the report is "Pest Management Service," which aids in identifying and referencing the specific market segment covered.
12. How do I determine which pricing option suits my needs best?
The pricing options vary based on user requirements and access needs. Individual users may opt for single-user licenses, while businesses requiring broader access may choose multi-user or enterprise licenses for cost-effective access to the report.
13. Are there any additional resources or data provided in the Pest Management Service report?
While the report offers comprehensive insights, it's advisable to review the specific contents or supplementary materials provided to ascertain if additional resources or data are available.
14. How can I stay updated on further developments or reports in the Pest Management Service?
To stay informed about further developments, trends, and reports in the Pest Management Service, consider subscribing to industry newsletters, following relevant companies and organizations, or regularly checking reputable industry news sources and publications.
Methodology
Step 1 - Identification of Relevant Samples Size from Population Database


Step 2 - Approaches for Defining Global Market Size (Value, Volume* & Price*)

Note*: In applicable scenarios
Step 3 - Data Sources
Primary Research
- Web Analytics
- Survey Reports
- Research Institute
- Latest Research Reports
- Opinion Leaders
Secondary Research
- Annual Reports
- White Paper
- Latest Press Release
- Industry Association
- Paid Database
- Investor Presentations

Step 4 - Data Triangulation
Involves using different sources of information in order to increase the validity of a study
These sources are likely to be stakeholders in a program - participants, other researchers, program staff, other community members, and so on.
Then we put all data in single framework & apply various statistical tools to find out the dynamic on the market.
During the analysis stage, feedback from the stakeholder groups would be compared to determine areas of agreement as well as areas of divergence