

Key Insights
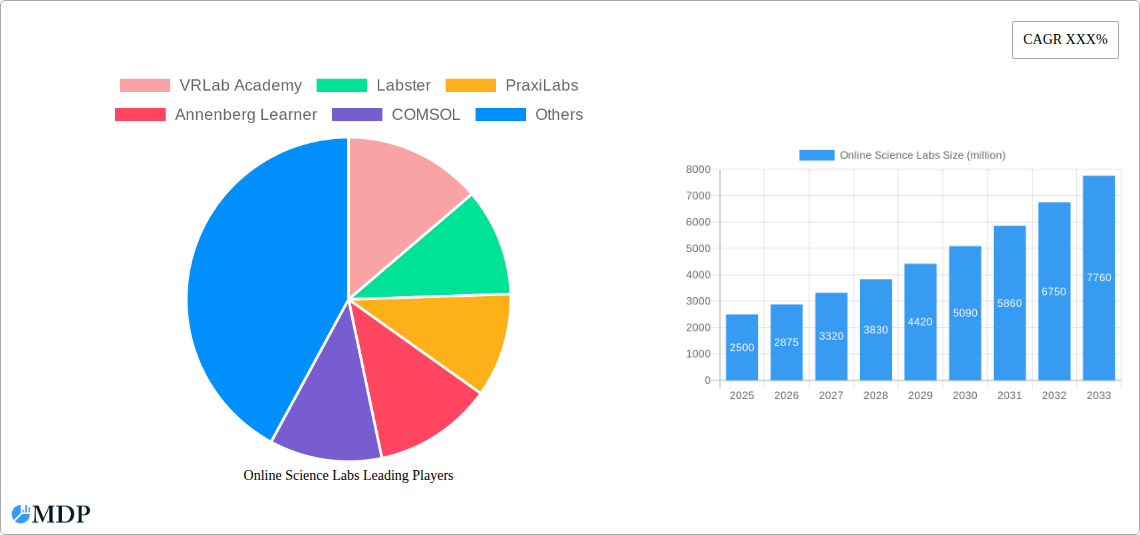
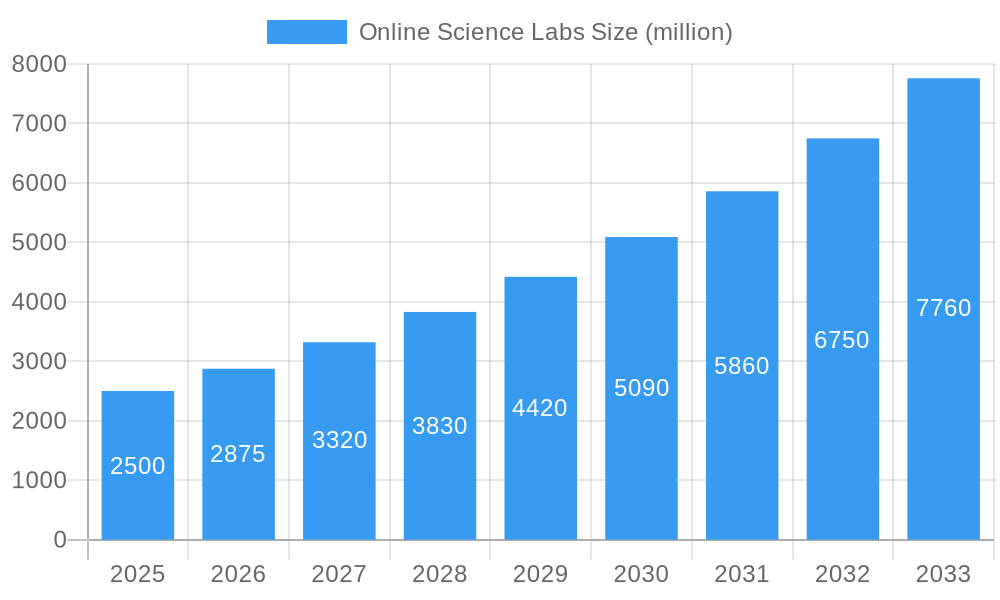
The global online science labs market is experiencing robust growth, driven by the increasing adoption of technology in education and the rising demand for flexible and accessible learning solutions. The market, estimated at $2.5 billion in 2025, is projected to witness a Compound Annual Growth Rate (CAGR) of 15% from 2025 to 2033, reaching an estimated $8 billion by 2033. This expansion is fueled by several key factors. Firstly, the COVID-19 pandemic accelerated the shift towards online learning, highlighting the effectiveness and convenience of virtual labs. Secondly, the rising accessibility of high-speed internet and affordable devices has broadened the reach of online science education, particularly in underserved regions. Thirdly, the increasing emphasis on STEM (Science, Technology, Engineering, and Mathematics) education globally is driving demand for innovative and engaging learning tools. The market is segmented by application (research institutions, schools, and others) and by type (biology, chemistry, physics, and others), with the educational sector (schools and research institutions) currently dominating market share. Competition is intense, with established players like Labster and PhET alongside newer entrants like VRLab Academy and PraxiLabs constantly innovating to offer engaging and realistic virtual lab experiences. Geographic growth is expected to be fairly distributed, although North America and Europe are anticipated to retain significant market leadership due to higher technology adoption rates and established educational infrastructure. However, the Asia-Pacific region is poised for substantial growth driven by increasing internet penetration and government initiatives to improve STEM education.
Online Science Labs Market Size (In Billion)
Constraints on market growth include the need for robust internet infrastructure, concerns about the digital divide, and the potential for inadequate teacher training in utilizing online lab platforms effectively. Despite these challenges, the market is expected to maintain strong growth trajectory due to the inherent benefits of online science labs, including cost savings, improved safety, and increased accessibility. The integration of advanced technologies like virtual and augmented reality (VR/AR) further enhances the immersive learning experience, creating a more engaging and effective way to learn science. This will likely attract further investment and innovation in this rapidly evolving sector.
Online Science Labs Company Market Share
Online Science Labs Market Report: 2019-2033 - A Comprehensive Analysis of a Multi-Billion Dollar Industry
This comprehensive report provides an in-depth analysis of the burgeoning online science labs market, projecting a market value exceeding $XX billion by 2033. The report covers the period 2019-2033, with a focus on the base year 2025 and a forecast period of 2025-2033. Key players like VRLab Academy, Labster, PraxiLabs, Annenberg Learner, COMSOL, PhET, Science Interactive, PNX Labs, EON Reality, and Learnetic are analyzed, along with market trends, growth drivers, and challenges. This report is crucial for investors, industry stakeholders, and researchers seeking actionable insights into this rapidly evolving sector.
Online Science Labs Market Dynamics & Concentration
The online science labs market exhibits a moderately concentrated structure, with a few major players holding significant market share. In 2025, the top five companies are estimated to account for approximately 60% of the global market, driven by their strong brand recognition, extensive product portfolios, and strategic partnerships. Market concentration is expected to increase slightly by 2033 as larger companies acquire smaller players and consolidate their market presence. Innovation drivers include advancements in virtual reality (VR), augmented reality (AR), and artificial intelligence (AI), which are enhancing the realism and engagement of online science labs. Regulatory frameworks vary across different regions, impacting market access and adoption. Product substitutes, such as traditional laboratory practices, continue to compete, particularly in sectors with limited internet access or budget constraints. M&A activity has been steadily increasing, with an estimated XX deals concluded during the 2019-2024 period, primarily focusing on technology acquisition and geographic expansion. End-user trends indicate a growing preference for flexible, cost-effective, and accessible online learning solutions.
- Market Share (2025): Top 5 players: 60%
- M&A Deal Count (2019-2024): XX
Online Science Labs Industry Trends & Analysis
The online science labs market is experiencing robust growth, with a projected CAGR of XX% during the forecast period (2025-2033). This growth is primarily driven by increasing demand for remote learning solutions, rising investments in educational technology, and the growing adoption of digital learning platforms in schools and research institutions. Technological disruptions, including the integration of advanced simulations and interactive learning tools, are significantly enhancing the user experience and making online science labs more engaging. Consumer preferences are shifting toward personalized learning experiences and gamified learning environments, which are becoming increasingly integrated into online science lab platforms. Competitive dynamics are intensifying, with companies focusing on product differentiation, strategic partnerships, and geographic expansion to gain a competitive edge. Market penetration in the education sector is accelerating, with a growing number of schools and universities adopting online science labs into their curriculums.
Leading Markets & Segments in Online Science Labs
The North American region dominates the online science labs market, driven by robust technological advancements, high levels of internet penetration, and significant investments in educational technology. The school segment holds the largest market share, fueled by the increasing demand for remote learning solutions and the growing adoption of online learning platforms in educational institutions. Within the application segments:
- Research Institutions: Strong growth is driven by the need for cost-effective research methods and remote collaboration capabilities. Key drivers include government funding for research and the availability of high-speed internet.
- Schools: The dominant segment, driven by the increasing need for affordable and accessible science education, coupled with the rising adoption of technology in classrooms. Key drivers include government initiatives promoting STEM education and the integration of online learning platforms into school curriculums.
- Others: This segment includes individual learners and corporate training programs. Growth is driven by the increasing demand for self-paced learning solutions and professional development opportunities.
Within the type segments:
- Biology: High demand driven by the need for virtual dissection and microscopy simulations.
- Chemistry: Growing adoption is fueled by the need for safe and cost-effective simulations of chemical reactions and experiments.
- Physics: Driven by the increasing demand for virtual simulations of physical phenomena and experiments.
Online Science Labs Product Developments
Recent product innovations have focused on enhancing realism, interactivity, and accessibility. Advanced features such as VR/AR integration, AI-powered feedback systems, and personalized learning pathways are becoming increasingly common. These innovations are enhancing the learning experience and addressing the limitations of traditional laboratory practices. The improved accessibility of online science labs through mobile devices and diverse internet connectivity options is expanding market reach and affordability.
Key Drivers of Online Science Labs Growth
Technological advancements, particularly in VR/AR, AI, and cloud computing, are pivotal in driving market growth. Increased government funding for STEM education and initiatives promoting digital learning are also significant catalysts. The increasing affordability and accessibility of online learning solutions are expanding market reach and driving adoption.
Challenges in the Online Science Labs Market
Limited internet access in certain regions restricts market penetration. The need for robust cybersecurity measures to protect sensitive data poses a challenge. Concerns over the effectiveness of online learning compared to traditional laboratory practices are also barriers to widespread adoption. Competition among established players and emerging startups creates a dynamic and challenging market environment.
Emerging Opportunities in Online Science Labs
The integration of advanced analytics and personalized learning pathways offers significant growth opportunities. The expansion into new geographic markets, particularly in developing economies, presents untapped potential. Strategic partnerships between online science lab providers and educational institutions can accelerate market adoption and enhance learning outcomes.
Leading Players in the Online Science Labs Sector
- VRLab Academy
- Labster
- PraxiLabs
- Annenberg Learner
- COMSOL
- PhET
- Science Interactive
- PNX Labs
- EON Reality
- Learnetic
Key Milestones in Online Science Labs Industry
- 2020: Increased adoption of online science labs due to COVID-19 pandemic lockdowns.
- 2021: Significant investments in educational technology and development of enhanced VR/AR simulations.
- 2022: Launch of several new online science lab platforms with advanced features.
- 2023: Several mergers and acquisitions among online science lab providers.
- 2024: Growing focus on personalized learning and data analytics in online science labs.
Strategic Outlook for Online Science Labs Market
The online science labs market holds significant long-term growth potential, driven by technological advancements and increasing demand for accessible and engaging science education. Strategic partnerships, targeted marketing campaigns, and continuous product innovation will be key to success in this competitive market. Expanding into emerging markets and developing customized solutions for specific educational needs will present substantial opportunities for growth.
Online Science Labs Segmentation
-
1. Application
- 1.1. Research Institution
- 1.2. School
- 1.3. Others
-
2. Type
- 2.1. Biology
- 2.2. Chemistry
- 2.3. Physics
- 2.4. Others
Online Science Labs Segmentation By Geography
-
1. North America
- 1.1. United States
- 1.2. Canada
- 1.3. Mexico
-
2. South America
- 2.1. Brazil
- 2.2. Argentina
- 2.3. Rest of South America
-
3. Europe
- 3.1. United Kingdom
- 3.2. Germany
- 3.3. France
- 3.4. Italy
- 3.5. Spain
- 3.6. Russia
- 3.7. Benelux
- 3.8. Nordics
- 3.9. Rest of Europe
-
4. Middle East & Africa
- 4.1. Turkey
- 4.2. Israel
- 4.3. GCC
- 4.4. North Africa
- 4.5. South Africa
- 4.6. Rest of Middle East & Africa
-
5. Asia Pacific
- 5.1. China
- 5.2. India
- 5.3. Japan
- 5.4. South Korea
- 5.5. ASEAN
- 5.6. Oceania
- 5.7. Rest of Asia Pacific
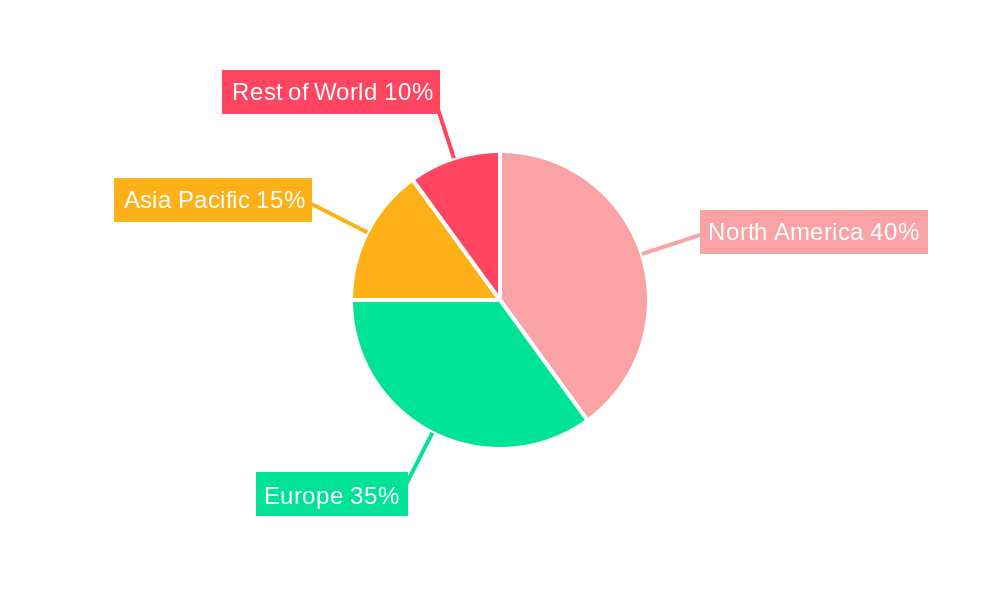
Online Science Labs Regional Market Share
Geographic Coverage of Online Science Labs
Online Science Labs REPORT HIGHLIGHTS
| Aspects | Details |
|---|---|
| Study Period | 2020-2034 |
| Base Year | 2025 |
| Estimated Year | 2026 |
| Forecast Period | 2026-2034 |
| Historical Period | 2020-2025 |
| Growth Rate | CAGR of 15% from 2020-2034 |
| Segmentation |
|
Table of Contents
- 1. Introduction
- 1.1. Research Scope
- 1.2. Market Segmentation
- 1.3. Research Methodology
- 1.4. Definitions and Assumptions
- 2. Executive Summary
- 2.1. Introduction
- 3. Market Dynamics
- 3.1. Introduction
- 3.2. Market Drivers
- 3.3. Market Restrains
- 3.4. Market Trends
- 4. Market Factor Analysis
- 4.1. Porters Five Forces
- 4.2. Supply/Value Chain
- 4.3. PESTEL analysis
- 4.4. Market Entropy
- 4.5. Patent/Trademark Analysis
- 5. Global Online Science Labs Analysis, Insights and Forecast, 2020-2032
- 5.1. Market Analysis, Insights and Forecast - by Application
- 5.1.1. Research Institution
- 5.1.2. School
- 5.1.3. Others
- 5.2. Market Analysis, Insights and Forecast - by Type
- 5.2.1. Biology
- 5.2.2. Chemistry
- 5.2.3. Physics
- 5.2.4. Others
- 5.3. Market Analysis, Insights and Forecast - by Region
- 5.3.1. North America
- 5.3.2. South America
- 5.3.3. Europe
- 5.3.4. Middle East & Africa
- 5.3.5. Asia Pacific
- 5.1. Market Analysis, Insights and Forecast - by Application
- 6. North America Online Science Labs Analysis, Insights and Forecast, 2020-2032
- 6.1. Market Analysis, Insights and Forecast - by Application
- 6.1.1. Research Institution
- 6.1.2. School
- 6.1.3. Others
- 6.2. Market Analysis, Insights and Forecast - by Type
- 6.2.1. Biology
- 6.2.2. Chemistry
- 6.2.3. Physics
- 6.2.4. Others
- 6.1. Market Analysis, Insights and Forecast - by Application
- 7. South America Online Science Labs Analysis, Insights and Forecast, 2020-2032
- 7.1. Market Analysis, Insights and Forecast - by Application
- 7.1.1. Research Institution
- 7.1.2. School
- 7.1.3. Others
- 7.2. Market Analysis, Insights and Forecast - by Type
- 7.2.1. Biology
- 7.2.2. Chemistry
- 7.2.3. Physics
- 7.2.4. Others
- 7.1. Market Analysis, Insights and Forecast - by Application
- 8. Europe Online Science Labs Analysis, Insights and Forecast, 2020-2032
- 8.1. Market Analysis, Insights and Forecast - by Application
- 8.1.1. Research Institution
- 8.1.2. School
- 8.1.3. Others
- 8.2. Market Analysis, Insights and Forecast - by Type
- 8.2.1. Biology
- 8.2.2. Chemistry
- 8.2.3. Physics
- 8.2.4. Others
- 8.1. Market Analysis, Insights and Forecast - by Application
- 9. Middle East & Africa Online Science Labs Analysis, Insights and Forecast, 2020-2032
- 9.1. Market Analysis, Insights and Forecast - by Application
- 9.1.1. Research Institution
- 9.1.2. School
- 9.1.3. Others
- 9.2. Market Analysis, Insights and Forecast - by Type
- 9.2.1. Biology
- 9.2.2. Chemistry
- 9.2.3. Physics
- 9.2.4. Others
- 9.1. Market Analysis, Insights and Forecast - by Application
- 10. Asia Pacific Online Science Labs Analysis, Insights and Forecast, 2020-2032
- 10.1. Market Analysis, Insights and Forecast - by Application
- 10.1.1. Research Institution
- 10.1.2. School
- 10.1.3. Others
- 10.2. Market Analysis, Insights and Forecast - by Type
- 10.2.1. Biology
- 10.2.2. Chemistry
- 10.2.3. Physics
- 10.2.4. Others
- 10.1. Market Analysis, Insights and Forecast - by Application
- 11. Competitive Analysis
- 11.1. Global Market Share Analysis 2025
- 11.2. Company Profiles
- 11.2.1 VRLab Academy
- 11.2.1.1. Overview
- 11.2.1.2. Products
- 11.2.1.3. SWOT Analysis
- 11.2.1.4. Recent Developments
- 11.2.1.5. Financials (Based on Availability)
- 11.2.2 Labster
- 11.2.2.1. Overview
- 11.2.2.2. Products
- 11.2.2.3. SWOT Analysis
- 11.2.2.4. Recent Developments
- 11.2.2.5. Financials (Based on Availability)
- 11.2.3 PraxiLabs
- 11.2.3.1. Overview
- 11.2.3.2. Products
- 11.2.3.3. SWOT Analysis
- 11.2.3.4. Recent Developments
- 11.2.3.5. Financials (Based on Availability)
- 11.2.4 Annenberg Learner
- 11.2.4.1. Overview
- 11.2.4.2. Products
- 11.2.4.3. SWOT Analysis
- 11.2.4.4. Recent Developments
- 11.2.4.5. Financials (Based on Availability)
- 11.2.5 COMSOL
- 11.2.5.1. Overview
- 11.2.5.2. Products
- 11.2.5.3. SWOT Analysis
- 11.2.5.4. Recent Developments
- 11.2.5.5. Financials (Based on Availability)
- 11.2.6 PhET
- 11.2.6.1. Overview
- 11.2.6.2. Products
- 11.2.6.3. SWOT Analysis
- 11.2.6.4. Recent Developments
- 11.2.6.5. Financials (Based on Availability)
- 11.2.7 Science Interactive
- 11.2.7.1. Overview
- 11.2.7.2. Products
- 11.2.7.3. SWOT Analysis
- 11.2.7.4. Recent Developments
- 11.2.7.5. Financials (Based on Availability)
- 11.2.8 PNX Labs
- 11.2.8.1. Overview
- 11.2.8.2. Products
- 11.2.8.3. SWOT Analysis
- 11.2.8.4. Recent Developments
- 11.2.8.5. Financials (Based on Availability)
- 11.2.9 EON Reality
- 11.2.9.1. Overview
- 11.2.9.2. Products
- 11.2.9.3. SWOT Analysis
- 11.2.9.4. Recent Developments
- 11.2.9.5. Financials (Based on Availability)
- 11.2.10 Learnetic
- 11.2.10.1. Overview
- 11.2.10.2. Products
- 11.2.10.3. SWOT Analysis
- 11.2.10.4. Recent Developments
- 11.2.10.5. Financials (Based on Availability)
- 11.2.1 VRLab Academy
List of Figures
- Figure 1: Global Online Science Labs Revenue Breakdown (undefined, %) by Region 2025 & 2033
- Figure 2: North America Online Science Labs Revenue (undefined), by Application 2025 & 2033
- Figure 3: North America Online Science Labs Revenue Share (%), by Application 2025 & 2033
- Figure 4: North America Online Science Labs Revenue (undefined), by Type 2025 & 2033
- Figure 5: North America Online Science Labs Revenue Share (%), by Type 2025 & 2033
- Figure 6: North America Online Science Labs Revenue (undefined), by Country 2025 & 2033
- Figure 7: North America Online Science Labs Revenue Share (%), by Country 2025 & 2033
- Figure 8: South America Online Science Labs Revenue (undefined), by Application 2025 & 2033
- Figure 9: South America Online Science Labs Revenue Share (%), by Application 2025 & 2033
- Figure 10: South America Online Science Labs Revenue (undefined), by Type 2025 & 2033
- Figure 11: South America Online Science Labs Revenue Share (%), by Type 2025 & 2033
- Figure 12: South America Online Science Labs Revenue (undefined), by Country 2025 & 2033
- Figure 13: South America Online Science Labs Revenue Share (%), by Country 2025 & 2033
- Figure 14: Europe Online Science Labs Revenue (undefined), by Application 2025 & 2033
- Figure 15: Europe Online Science Labs Revenue Share (%), by Application 2025 & 2033
- Figure 16: Europe Online Science Labs Revenue (undefined), by Type 2025 & 2033
- Figure 17: Europe Online Science Labs Revenue Share (%), by Type 2025 & 2033
- Figure 18: Europe Online Science Labs Revenue (undefined), by Country 2025 & 2033
- Figure 19: Europe Online Science Labs Revenue Share (%), by Country 2025 & 2033
- Figure 20: Middle East & Africa Online Science Labs Revenue (undefined), by Application 2025 & 2033
- Figure 21: Middle East & Africa Online Science Labs Revenue Share (%), by Application 2025 & 2033
- Figure 22: Middle East & Africa Online Science Labs Revenue (undefined), by Type 2025 & 2033
- Figure 23: Middle East & Africa Online Science Labs Revenue Share (%), by Type 2025 & 2033
- Figure 24: Middle East & Africa Online Science Labs Revenue (undefined), by Country 2025 & 2033
- Figure 25: Middle East & Africa Online Science Labs Revenue Share (%), by Country 2025 & 2033
- Figure 26: Asia Pacific Online Science Labs Revenue (undefined), by Application 2025 & 2033
- Figure 27: Asia Pacific Online Science Labs Revenue Share (%), by Application 2025 & 2033
- Figure 28: Asia Pacific Online Science Labs Revenue (undefined), by Type 2025 & 2033
- Figure 29: Asia Pacific Online Science Labs Revenue Share (%), by Type 2025 & 2033
- Figure 30: Asia Pacific Online Science Labs Revenue (undefined), by Country 2025 & 2033
- Figure 31: Asia Pacific Online Science Labs Revenue Share (%), by Country 2025 & 2033
List of Tables
- Table 1: Global Online Science Labs Revenue undefined Forecast, by Application 2020 & 2033
- Table 2: Global Online Science Labs Revenue undefined Forecast, by Type 2020 & 2033
- Table 3: Global Online Science Labs Revenue undefined Forecast, by Region 2020 & 2033
- Table 4: Global Online Science Labs Revenue undefined Forecast, by Application 2020 & 2033
- Table 5: Global Online Science Labs Revenue undefined Forecast, by Type 2020 & 2033
- Table 6: Global Online Science Labs Revenue undefined Forecast, by Country 2020 & 2033
- Table 7: United States Online Science Labs Revenue (undefined) Forecast, by Application 2020 & 2033
- Table 8: Canada Online Science Labs Revenue (undefined) Forecast, by Application 2020 & 2033
- Table 9: Mexico Online Science Labs Revenue (undefined) Forecast, by Application 2020 & 2033
- Table 10: Global Online Science Labs Revenue undefined Forecast, by Application 2020 & 2033
- Table 11: Global Online Science Labs Revenue undefined Forecast, by Type 2020 & 2033
- Table 12: Global Online Science Labs Revenue undefined Forecast, by Country 2020 & 2033
- Table 13: Brazil Online Science Labs Revenue (undefined) Forecast, by Application 2020 & 2033
- Table 14: Argentina Online Science Labs Revenue (undefined) Forecast, by Application 2020 & 2033
- Table 15: Rest of South America Online Science Labs Revenue (undefined) Forecast, by Application 2020 & 2033
- Table 16: Global Online Science Labs Revenue undefined Forecast, by Application 2020 & 2033
- Table 17: Global Online Science Labs Revenue undefined Forecast, by Type 2020 & 2033
- Table 18: Global Online Science Labs Revenue undefined Forecast, by Country 2020 & 2033
- Table 19: United Kingdom Online Science Labs Revenue (undefined) Forecast, by Application 2020 & 2033
- Table 20: Germany Online Science Labs Revenue (undefined) Forecast, by Application 2020 & 2033
- Table 21: France Online Science Labs Revenue (undefined) Forecast, by Application 2020 & 2033
- Table 22: Italy Online Science Labs Revenue (undefined) Forecast, by Application 2020 & 2033
- Table 23: Spain Online Science Labs Revenue (undefined) Forecast, by Application 2020 & 2033
- Table 24: Russia Online Science Labs Revenue (undefined) Forecast, by Application 2020 & 2033
- Table 25: Benelux Online Science Labs Revenue (undefined) Forecast, by Application 2020 & 2033
- Table 26: Nordics Online Science Labs Revenue (undefined) Forecast, by Application 2020 & 2033
- Table 27: Rest of Europe Online Science Labs Revenue (undefined) Forecast, by Application 2020 & 2033
- Table 28: Global Online Science Labs Revenue undefined Forecast, by Application 2020 & 2033
- Table 29: Global Online Science Labs Revenue undefined Forecast, by Type 2020 & 2033
- Table 30: Global Online Science Labs Revenue undefined Forecast, by Country 2020 & 2033
- Table 31: Turkey Online Science Labs Revenue (undefined) Forecast, by Application 2020 & 2033
- Table 32: Israel Online Science Labs Revenue (undefined) Forecast, by Application 2020 & 2033
- Table 33: GCC Online Science Labs Revenue (undefined) Forecast, by Application 2020 & 2033
- Table 34: North Africa Online Science Labs Revenue (undefined) Forecast, by Application 2020 & 2033
- Table 35: South Africa Online Science Labs Revenue (undefined) Forecast, by Application 2020 & 2033
- Table 36: Rest of Middle East & Africa Online Science Labs Revenue (undefined) Forecast, by Application 2020 & 2033
- Table 37: Global Online Science Labs Revenue undefined Forecast, by Application 2020 & 2033
- Table 38: Global Online Science Labs Revenue undefined Forecast, by Type 2020 & 2033
- Table 39: Global Online Science Labs Revenue undefined Forecast, by Country 2020 & 2033
- Table 40: China Online Science Labs Revenue (undefined) Forecast, by Application 2020 & 2033
- Table 41: India Online Science Labs Revenue (undefined) Forecast, by Application 2020 & 2033
- Table 42: Japan Online Science Labs Revenue (undefined) Forecast, by Application 2020 & 2033
- Table 43: South Korea Online Science Labs Revenue (undefined) Forecast, by Application 2020 & 2033
- Table 44: ASEAN Online Science Labs Revenue (undefined) Forecast, by Application 2020 & 2033
- Table 45: Oceania Online Science Labs Revenue (undefined) Forecast, by Application 2020 & 2033
- Table 46: Rest of Asia Pacific Online Science Labs Revenue (undefined) Forecast, by Application 2020 & 2033
Frequently Asked Questions
1. What is the projected Compound Annual Growth Rate (CAGR) of the Online Science Labs?
The projected CAGR is approximately 15%.
2. Which companies are prominent players in the Online Science Labs?
Key companies in the market include VRLab Academy, Labster, PraxiLabs, Annenberg Learner, COMSOL, PhET, Science Interactive, PNX Labs, EON Reality, Learnetic.
3. What are the main segments of the Online Science Labs?
The market segments include Application, Type.
4. Can you provide details about the market size?
The market size is estimated to be USD XXX N/A as of 2022.
5. What are some drivers contributing to market growth?
N/A
6. What are the notable trends driving market growth?
N/A
7. Are there any restraints impacting market growth?
N/A
8. Can you provide examples of recent developments in the market?
N/A
9. What pricing options are available for accessing the report?
Pricing options include single-user, multi-user, and enterprise licenses priced at USD 2900.00, USD 4350.00, and USD 5800.00 respectively.
10. Is the market size provided in terms of value or volume?
The market size is provided in terms of value, measured in N/A.
11. Are there any specific market keywords associated with the report?
Yes, the market keyword associated with the report is "Online Science Labs," which aids in identifying and referencing the specific market segment covered.
12. How do I determine which pricing option suits my needs best?
The pricing options vary based on user requirements and access needs. Individual users may opt for single-user licenses, while businesses requiring broader access may choose multi-user or enterprise licenses for cost-effective access to the report.
13. Are there any additional resources or data provided in the Online Science Labs report?
While the report offers comprehensive insights, it's advisable to review the specific contents or supplementary materials provided to ascertain if additional resources or data are available.
14. How can I stay updated on further developments or reports in the Online Science Labs?
To stay informed about further developments, trends, and reports in the Online Science Labs, consider subscribing to industry newsletters, following relevant companies and organizations, or regularly checking reputable industry news sources and publications.
Methodology
Step 1 - Identification of Relevant Samples Size from Population Database


Step 2 - Approaches for Defining Global Market Size (Value, Volume* & Price*)

Note*: In applicable scenarios
Step 3 - Data Sources
Primary Research
- Web Analytics
- Survey Reports
- Research Institute
- Latest Research Reports
- Opinion Leaders
Secondary Research
- Annual Reports
- White Paper
- Latest Press Release
- Industry Association
- Paid Database
- Investor Presentations

Step 4 - Data Triangulation
Involves using different sources of information in order to increase the validity of a study
These sources are likely to be stakeholders in a program - participants, other researchers, program staff, other community members, and so on.
Then we put all data in single framework & apply various statistical tools to find out the dynamic on the market.
During the analysis stage, feedback from the stakeholder groups would be compared to determine areas of agreement as well as areas of divergence