

Key Insights
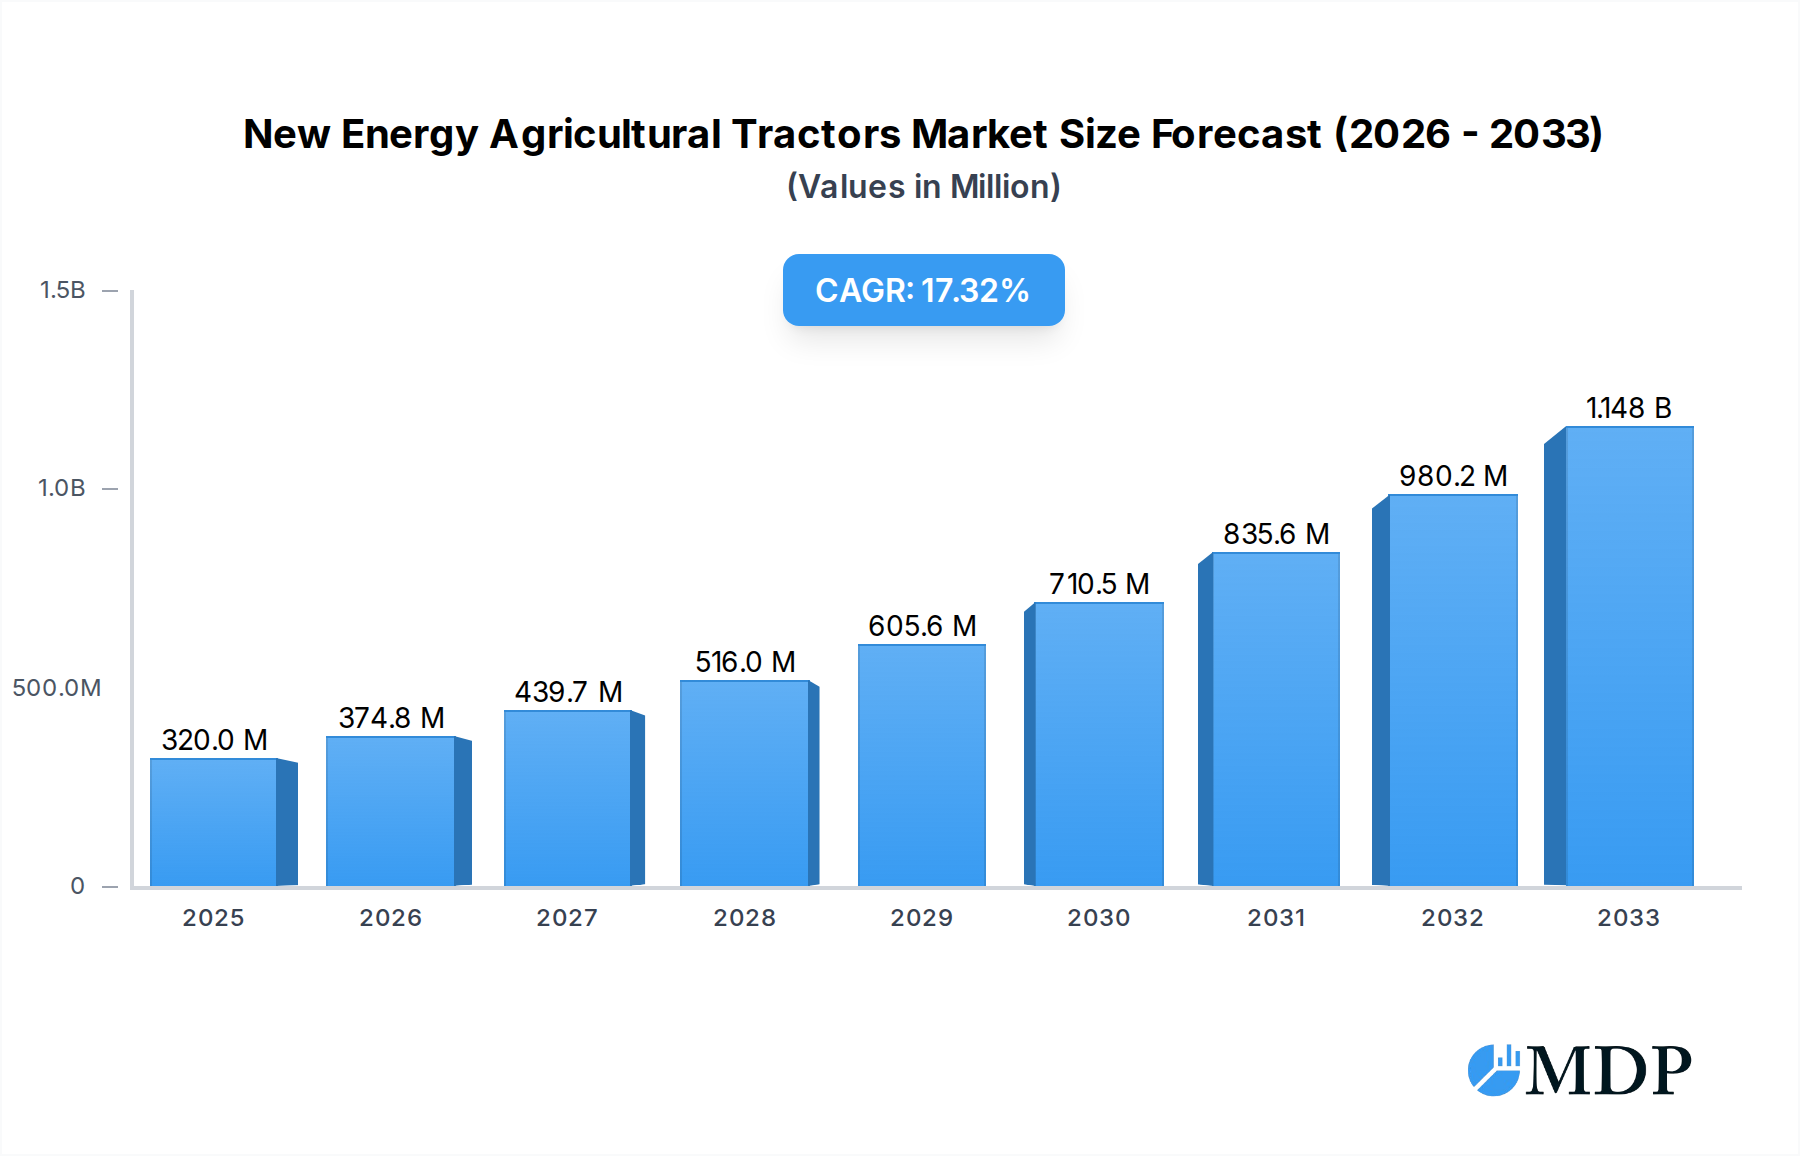
The global market for New Energy Agricultural Tractors is poised for significant expansion, driven by a strong commitment to sustainable agriculture and technological innovation. Valued at an estimated $0.32 billion in 2025, the market is projected to experience a robust CAGR of 17.04% through the forecast period of 2025-2033. This remarkable growth is fueled by an increasing awareness of environmental concerns, government incentives promoting eco-friendly farming practices, and the rising demand for enhanced operational efficiency and reduced emissions in agriculture. Key drivers include the quest for lower operating costs associated with electric and hybrid powertrains, reduced reliance on fossil fuels, and the integration of advanced technologies for precision farming. The application segment is broadly categorized, with Crop Cultivation and Harvesting, and Plant Protection and Irrigation being the dominant areas, reflecting the critical role of tractors in these core agricultural operations.

New Energy Agricultural Tractors Market Size (In Million)
The burgeoning market is characterized by a clear trend towards the adoption of both pure electric and hybrid tractor technologies, catering to diverse operational needs and farm sizes. While the market benefits from these powerful growth drivers, it also faces certain restraints. These may include the initial high cost of some advanced new energy tractor models, the availability and charging infrastructure for electric variants, and the need for robust battery life to support extensive field operations. However, ongoing research and development, coupled with increased manufacturing scale, are expected to mitigate these challenges. Leading players like John Deere, Fendt, Solectrac, and Monarch Tractor are at the forefront, introducing innovative solutions and expanding their product portfolios. Geographically, North America and Europe are anticipated to lead market adoption due to their advanced agricultural infrastructure and proactive environmental policies, with Asia Pacific showing substantial growth potential, particularly China and India, given their vast agricultural sectors and increasing focus on modernization.
New Energy Agricultural Tractors Company Market Share
Revolutionizing Agriculture: An In-Depth Report on New Energy Agricultural Tractors (2019-2033)
This comprehensive report delves into the dynamic and rapidly evolving global New Energy Agricultural Tractors market. Spanning a detailed study period from 2019 to 2033, with a base and estimated year of 2025, this analysis provides critical insights for stakeholders seeking to understand market dynamics, industry trends, leading segments, product developments, growth drivers, challenges, and emerging opportunities. With a forecast period extending to 2033, this report is your essential guide to navigating the future of sustainable agricultural mechanization. We explore the innovations and strategies of key players like John Deere, Fendt, Rigitrac, Solectrac, Monarch Tractor, Kubota, Sonalika Group, Case IH, Nongbang Agricultural Machinery, and Jiangsu Yueda Intelligent Agricultural Equipment, and dissect market penetration across crucial applications including Crop Cultivation and Harvesting, Plant Protection Irrigation, Animal Husbandry, and Others (Aquaculture, Horticulture, Forestry), as well as types such as Pure Electricity and Hybrid.
New Energy Agricultural Tractors Market Dynamics & Concentration
The New Energy Agricultural Tractors market is characterized by a moderate concentration, with established players like John Deere and Fendt holding significant market share, estimated to be between 15% and 20% each. However, the emergence of innovative startups such as Solectrac and Monarch Tractor is progressively fragmenting the landscape, driving intense competition and innovation. Key drivers fueling market growth include increasing government incentives for sustainable agriculture, stringent emission regulations, and the rising demand for operational efficiency and reduced running costs. Regulatory frameworks are increasingly pushing for cleaner agricultural machinery, with many regions implementing subsidies and tax breaks for electric and hybrid tractor adoption. Product substitutes, primarily conventional diesel tractors, are facing pressure due to their higher operational and environmental costs. End-user trends are leaning towards precision agriculture and smart farming solutions, where new energy tractors are well-positioned to integrate advanced technologies. Mergers and acquisition (M&A) activities, while currently limited, are anticipated to increase as larger companies seek to acquire innovative technologies and market access. The historical M&A deal count from 2019-2024 stands at approximately 5 billion, indicating a nascent but growing trend.
New Energy Agricultural Tractors Industry Trends & Analysis
The New Energy Agricultural Tractors industry is experiencing robust growth, driven by a confluence of technological advancements, environmental consciousness, and economic imperatives. The compound annual growth rate (CAGR) for the new energy agricultural tractor market is projected to be an impressive 22.50% during the forecast period (2025-2033), signifying a significant shift from traditional machinery. Technological disruptions are at the forefront, with rapid advancements in battery technology, electric drivetrains, and hybrid systems enhancing performance, range, and efficiency. The market penetration of electric agricultural tractors, currently at around 5%, is expected to surge to over 30% by 2033. Consumer preferences are increasingly shifting towards tractors that offer lower operational costs, reduced noise pollution, and a smaller carbon footprint. The rising cost of diesel fuel and the growing awareness of climate change are compelling farmers to explore sustainable alternatives. Competitive dynamics are intensifying, with traditional agricultural machinery manufacturers investing heavily in R&D for new energy solutions, while agile startups are disrupting the market with novel designs and business models. The integration of autonomous features and smart farming capabilities further enhances the appeal of new energy tractors, aligning with the broader trend of digitalization in agriculture. The global market size for new energy agricultural tractors is projected to reach approximately 50 billion by 2025 and expand to over 100 billion by 2033, underscoring its immense potential.
Leading Markets & Segments in New Energy Agricultural Tractors
The North American region is currently the dominant market for new energy agricultural tractors, driven by substantial government support for sustainable farming practices and a high level of technological adoption among farmers. Within North America, the United States leads in market penetration, with an estimated 60% of the regional market share. The primary application segment driving this dominance is Crop Cultivation and Harvesting, which accounts for approximately 55% of the total market. This is attributed to the extensive use of tractors in large-scale farming operations and the increasing demand for efficient and environmentally friendly machinery for planting, tilling, and harvesting crops.
- Key Drivers of Dominance in Crop Cultivation and Harvesting:
- Economic Policies: Government subsidies and tax incentives for adopting electric and hybrid agricultural machinery significantly reduce the upfront cost for farmers.
- Infrastructure Development: Investments in charging infrastructure, though still in early stages, are gradually improving the feasibility of electric tractor use.
- Technological Advancement: The availability of powerful and reliable electric tractors capable of handling demanding cultivation and harvesting tasks.
- Farmer Awareness: Growing recognition of the long-term cost savings and environmental benefits associated with new energy tractors.
The Pure Electricity type segment is witnessing accelerated growth within the new energy agricultural tractor market, holding an estimated 70% of the market share in 2025. This surge is fueled by improvements in battery density, longer operating hours, and faster charging capabilities, making them increasingly viable for a wider range of agricultural applications. While Hybrid tractors offer a transitional solution, the long-term trend indicates a stronger preference for fully electric systems due to their zero-emission profile and lower maintenance requirements.
New Energy Agricultural Tractors Product Developments
Product innovation in the new energy agricultural tractor sector is focused on enhancing power output, battery longevity, and smart integration. Manufacturers are introducing tractors with improved battery management systems, enabling longer operational cycles and faster charging times. John Deere is pioneering advanced electrification in its larger horsepower tractors, while Fendt is focusing on hybrid technologies for optimized performance. Rigitrac and Solectrac are at the forefront of compact electric tractor development for specialized applications. Monarch Tractor is distinguishing itself with autonomous capabilities and integrated AI for precision farming. These developments aim to address farmers' concerns regarding range anxiety and operational efficiency, making new energy tractors a compelling alternative to conventional diesel models.
Key Drivers of New Energy Agricultural Tractors Growth
Several key drivers are propelling the growth of the New Energy Agricultural Tractors market. Firstly, stringent environmental regulations and government incentives for sustainable agriculture are mandating a shift towards cleaner machinery. Secondly, the declining costs of battery technology and electric drivetrains are making these tractors more economically viable for farmers. Thirdly, the increasing operational efficiency and lower maintenance costs associated with electric and hybrid tractors offer significant long-term cost savings. Finally, the growing demand for precision agriculture and smart farming solutions, which are often integrated with electric tractor platforms, is further accelerating adoption.
Challenges in the New Energy Agricultural Tractors Market
Despite the promising growth, the New Energy Agricultural Tractors market faces several challenges. High upfront purchase costs compared to traditional diesel tractors remain a significant barrier for many farmers. The limited charging infrastructure in rural areas and the longer charging times compared to refueling a diesel tractor can lead to operational disruptions. Battery lifespan and replacement costs are also concerns, although these are improving. Furthermore, the availability of skilled technicians for maintenance and repair of electric agricultural machinery is still limited. Intense competition from established diesel tractor manufacturers and the need for continued R&D investment to improve performance and reduce costs are also notable challenges.
Emerging Opportunities in New Energy Agricultural Tractors
Emerging opportunities in the New Energy Agricultural Tractors market are abundant, driven by technological breakthroughs and strategic market expansion. The development of advanced battery technologies, such as solid-state batteries, promises to significantly increase energy density and reduce charging times, addressing a key limitation. Strategic partnerships between tractor manufacturers, battery suppliers, and energy providers are crucial for building robust charging infrastructure. Furthermore, the growing demand for autonomous and semi-autonomous agricultural machinery presents a significant opportunity for electric tractor platforms, which are inherently better suited for integration with advanced electronic systems. Expansion into emerging economies with developing agricultural sectors also offers substantial long-term growth potential.
Leading Players in the New Energy Agricultural Tractors Sector
- John Deere
- Fendt
- Rigitrac
- Solectrac
- Monarch Tractor
- Kubota
- Sonalika Group
- Case IH
- Nongbang Agricultural Machinery
- Jiangsu Yueda Intelligent Agricultural Equipment
Key Milestones in New Energy Agricultural Tractors Industry
- 2019: Launch of early-stage electric tractor prototypes by several startups, generating initial market interest.
- 2020: Increased government funding and subsidies for electric agricultural machinery in key markets like the EU and North America.
- 2021: First commercial releases of high-horsepower electric tractors by established manufacturers, signaling mainstream adoption.
- 2022: Significant advancements in battery technology leading to improved range and faster charging capabilities becoming widely available.
- 2023: Growing number of pilot programs and field trials by large agricultural enterprises showcasing the viability of electric tractors in commercial operations.
- 2024: Increased focus on autonomous and smart farming integration with new energy tractor platforms, leading to new product launches.
Strategic Outlook for New Energy Agricultural Tractors Market
The strategic outlook for the New Energy Agricultural Tractors market is overwhelmingly positive, characterized by accelerating adoption and technological innovation. Growth accelerators include ongoing government support through incentives and regulations, continued advancements in battery and electric drivetrain technology that will further enhance performance and reduce costs, and the increasing integration of autonomous and AI-driven features. The expanding charging infrastructure and the growing awareness among farmers about the economic and environmental benefits will solidify the transition. Strategic partnerships and collaborations will be crucial for market players to innovate, scale production, and establish robust service networks, ensuring sustained growth and market leadership in the coming years.
New Energy Agricultural Tractors Segmentation
-
1. Application
- 1.1. Crop Cultivation and Harvesting
- 1.2. Plant Protection Irrigation
- 1.3. Animal Husbandry
- 1.4. Others (Aquaculture, Horticulture, Forestry)
-
2. Types
- 2.1. Pure Electricity
- 2.2. Hybrid
New Energy Agricultural Tractors Segmentation By Geography
-
1. North America
- 1.1. United States
- 1.2. Canada
- 1.3. Mexico
-
2. South America
- 2.1. Brazil
- 2.2. Argentina
- 2.3. Rest of South America
-
3. Europe
- 3.1. United Kingdom
- 3.2. Germany
- 3.3. France
- 3.4. Italy
- 3.5. Spain
- 3.6. Russia
- 3.7. Benelux
- 3.8. Nordics
- 3.9. Rest of Europe
-
4. Middle East & Africa
- 4.1. Turkey
- 4.2. Israel
- 4.3. GCC
- 4.4. North Africa
- 4.5. South Africa
- 4.6. Rest of Middle East & Africa
-
5. Asia Pacific
- 5.1. China
- 5.2. India
- 5.3. Japan
- 5.4. South Korea
- 5.5. ASEAN
- 5.6. Oceania
- 5.7. Rest of Asia Pacific
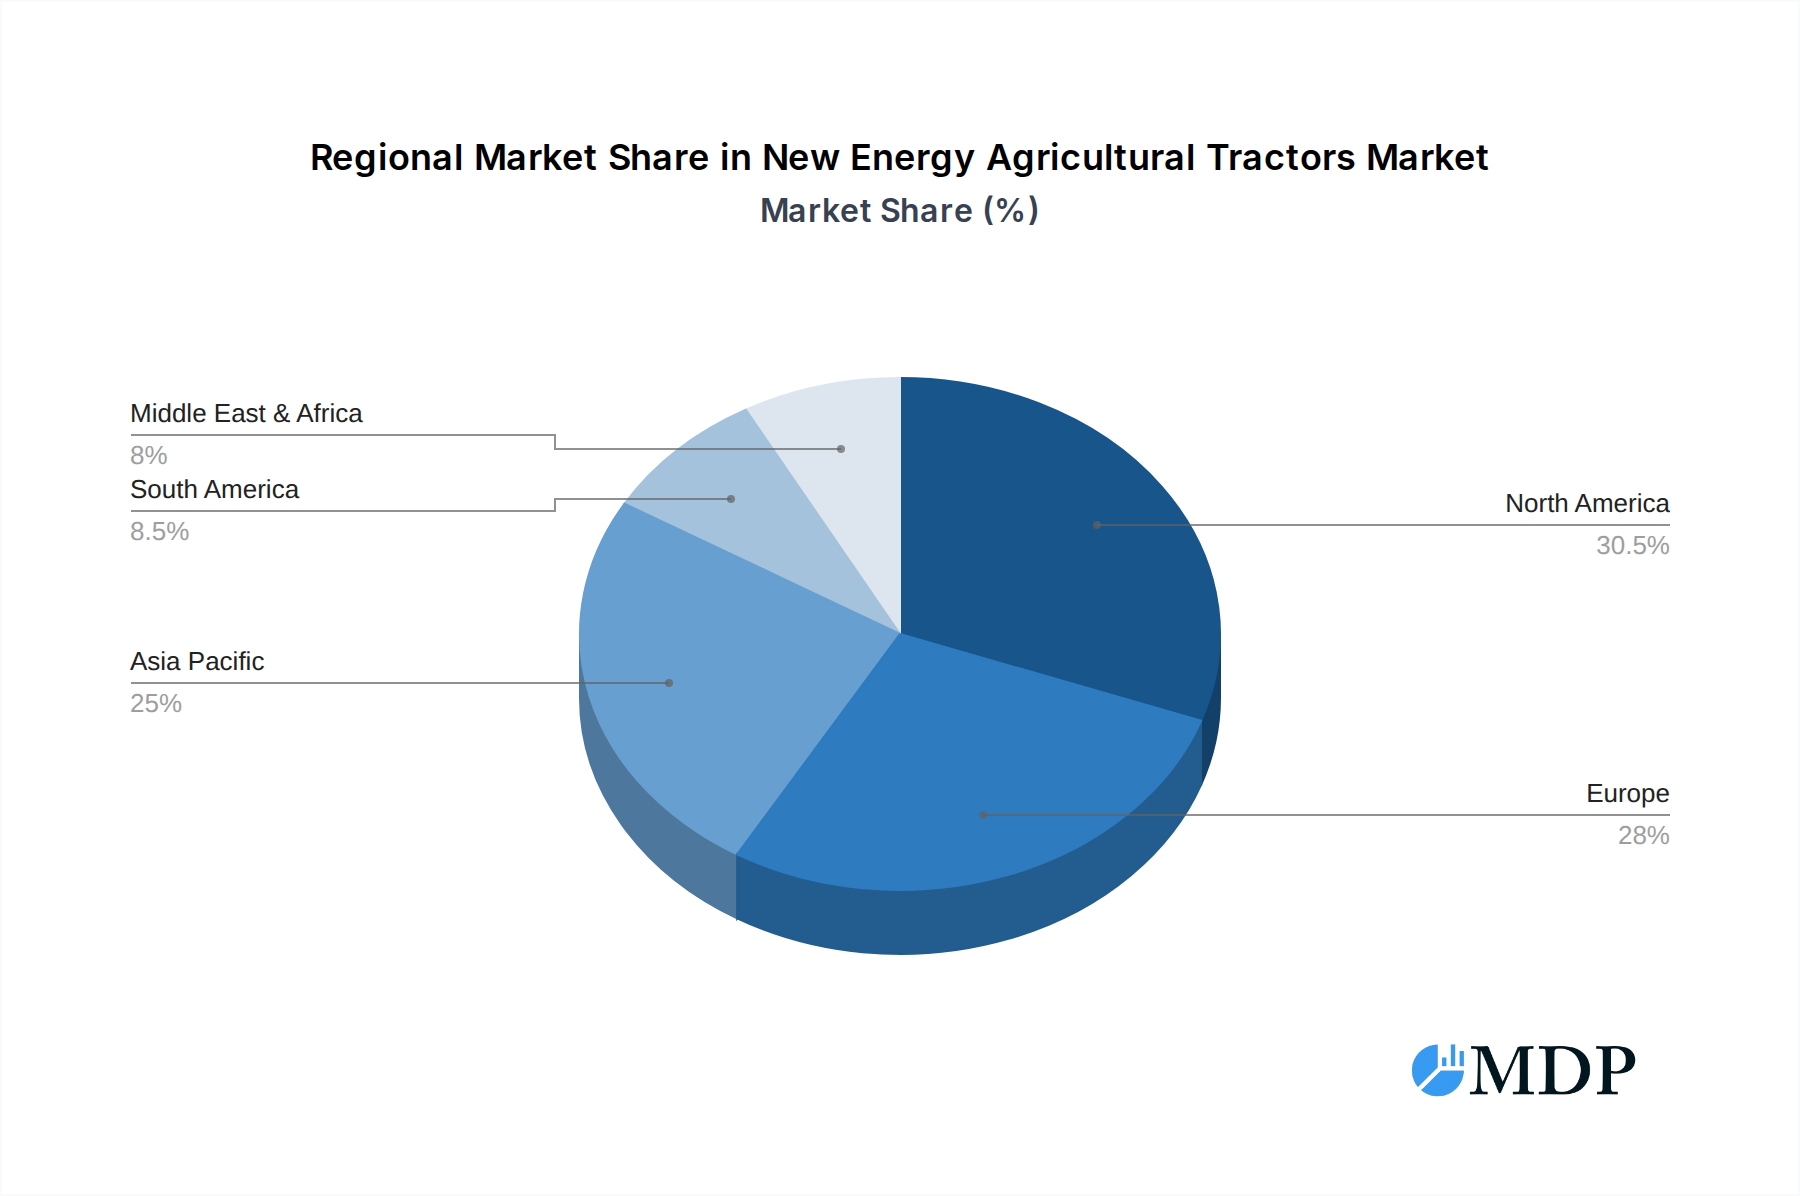
New Energy Agricultural Tractors Regional Market Share
Geographic Coverage of New Energy Agricultural Tractors
New Energy Agricultural Tractors REPORT HIGHLIGHTS
| Aspects | Details |
|---|---|
| Study Period | 2020-2034 |
| Base Year | 2025 |
| Estimated Year | 2026 |
| Forecast Period | 2026-2034 |
| Historical Period | 2020-2025 |
| Growth Rate | CAGR of 17.04% from 2020-2034 |
| Segmentation |
|
Table of Contents
- 1. Introduction
- 1.1. Research Scope
- 1.2. Market Segmentation
- 1.3. Research Methodology
- 1.4. Definitions and Assumptions
- 2. Executive Summary
- 2.1. Introduction
- 3. Market Dynamics
- 3.1. Introduction
- 3.2. Market Drivers
- 3.3. Market Restrains
- 3.4. Market Trends
- 4. Market Factor Analysis
- 4.1. Porters Five Forces
- 4.2. Supply/Value Chain
- 4.3. PESTEL analysis
- 4.4. Market Entropy
- 4.5. Patent/Trademark Analysis
- 5. Global New Energy Agricultural Tractors Analysis, Insights and Forecast, 2020-2032
- 5.1. Market Analysis, Insights and Forecast - by Application
- 5.1.1. Crop Cultivation and Harvesting
- 5.1.2. Plant Protection Irrigation
- 5.1.3. Animal Husbandry
- 5.1.4. Others (Aquaculture, Horticulture, Forestry)
- 5.2. Market Analysis, Insights and Forecast - by Types
- 5.2.1. Pure Electricity
- 5.2.2. Hybrid
- 5.3. Market Analysis, Insights and Forecast - by Region
- 5.3.1. North America
- 5.3.2. South America
- 5.3.3. Europe
- 5.3.4. Middle East & Africa
- 5.3.5. Asia Pacific
- 5.1. Market Analysis, Insights and Forecast - by Application
- 6. North America New Energy Agricultural Tractors Analysis, Insights and Forecast, 2020-2032
- 6.1. Market Analysis, Insights and Forecast - by Application
- 6.1.1. Crop Cultivation and Harvesting
- 6.1.2. Plant Protection Irrigation
- 6.1.3. Animal Husbandry
- 6.1.4. Others (Aquaculture, Horticulture, Forestry)
- 6.2. Market Analysis, Insights and Forecast - by Types
- 6.2.1. Pure Electricity
- 6.2.2. Hybrid
- 6.1. Market Analysis, Insights and Forecast - by Application
- 7. South America New Energy Agricultural Tractors Analysis, Insights and Forecast, 2020-2032
- 7.1. Market Analysis, Insights and Forecast - by Application
- 7.1.1. Crop Cultivation and Harvesting
- 7.1.2. Plant Protection Irrigation
- 7.1.3. Animal Husbandry
- 7.1.4. Others (Aquaculture, Horticulture, Forestry)
- 7.2. Market Analysis, Insights and Forecast - by Types
- 7.2.1. Pure Electricity
- 7.2.2. Hybrid
- 7.1. Market Analysis, Insights and Forecast - by Application
- 8. Europe New Energy Agricultural Tractors Analysis, Insights and Forecast, 2020-2032
- 8.1. Market Analysis, Insights and Forecast - by Application
- 8.1.1. Crop Cultivation and Harvesting
- 8.1.2. Plant Protection Irrigation
- 8.1.3. Animal Husbandry
- 8.1.4. Others (Aquaculture, Horticulture, Forestry)
- 8.2. Market Analysis, Insights and Forecast - by Types
- 8.2.1. Pure Electricity
- 8.2.2. Hybrid
- 8.1. Market Analysis, Insights and Forecast - by Application
- 9. Middle East & Africa New Energy Agricultural Tractors Analysis, Insights and Forecast, 2020-2032
- 9.1. Market Analysis, Insights and Forecast - by Application
- 9.1.1. Crop Cultivation and Harvesting
- 9.1.2. Plant Protection Irrigation
- 9.1.3. Animal Husbandry
- 9.1.4. Others (Aquaculture, Horticulture, Forestry)
- 9.2. Market Analysis, Insights and Forecast - by Types
- 9.2.1. Pure Electricity
- 9.2.2. Hybrid
- 9.1. Market Analysis, Insights and Forecast - by Application
- 10. Asia Pacific New Energy Agricultural Tractors Analysis, Insights and Forecast, 2020-2032
- 10.1. Market Analysis, Insights and Forecast - by Application
- 10.1.1. Crop Cultivation and Harvesting
- 10.1.2. Plant Protection Irrigation
- 10.1.3. Animal Husbandry
- 10.1.4. Others (Aquaculture, Horticulture, Forestry)
- 10.2. Market Analysis, Insights and Forecast - by Types
- 10.2.1. Pure Electricity
- 10.2.2. Hybrid
- 10.1. Market Analysis, Insights and Forecast - by Application
- 11. Competitive Analysis
- 11.1. Global Market Share Analysis 2025
- 11.2. Company Profiles
- 11.2.1 John Deere
- 11.2.1.1. Overview
- 11.2.1.2. Products
- 11.2.1.3. SWOT Analysis
- 11.2.1.4. Recent Developments
- 11.2.1.5. Financials (Based on Availability)
- 11.2.2 Fendt
- 11.2.2.1. Overview
- 11.2.2.2. Products
- 11.2.2.3. SWOT Analysis
- 11.2.2.4. Recent Developments
- 11.2.2.5. Financials (Based on Availability)
- 11.2.3 Rigitrac
- 11.2.3.1. Overview
- 11.2.3.2. Products
- 11.2.3.3. SWOT Analysis
- 11.2.3.4. Recent Developments
- 11.2.3.5. Financials (Based on Availability)
- 11.2.4 Solectrac
- 11.2.4.1. Overview
- 11.2.4.2. Products
- 11.2.4.3. SWOT Analysis
- 11.2.4.4. Recent Developments
- 11.2.4.5. Financials (Based on Availability)
- 11.2.5 Monarch Tractor
- 11.2.5.1. Overview
- 11.2.5.2. Products
- 11.2.5.3. SWOT Analysis
- 11.2.5.4. Recent Developments
- 11.2.5.5. Financials (Based on Availability)
- 11.2.6 Kubota
- 11.2.6.1. Overview
- 11.2.6.2. Products
- 11.2.6.3. SWOT Analysis
- 11.2.6.4. Recent Developments
- 11.2.6.5. Financials (Based on Availability)
- 11.2.7 Sonalika Group
- 11.2.7.1. Overview
- 11.2.7.2. Products
- 11.2.7.3. SWOT Analysis
- 11.2.7.4. Recent Developments
- 11.2.7.5. Financials (Based on Availability)
- 11.2.8 Case IH
- 11.2.8.1. Overview
- 11.2.8.2. Products
- 11.2.8.3. SWOT Analysis
- 11.2.8.4. Recent Developments
- 11.2.8.5. Financials (Based on Availability)
- 11.2.9 Nongbang Agricultural Machinery
- 11.2.9.1. Overview
- 11.2.9.2. Products
- 11.2.9.3. SWOT Analysis
- 11.2.9.4. Recent Developments
- 11.2.9.5. Financials (Based on Availability)
- 11.2.10 Jiangsu Yueda Intelligent Agricultural Equipment
- 11.2.10.1. Overview
- 11.2.10.2. Products
- 11.2.10.3. SWOT Analysis
- 11.2.10.4. Recent Developments
- 11.2.10.5. Financials (Based on Availability)
- 11.2.1 John Deere
List of Figures
- Figure 1: Global New Energy Agricultural Tractors Revenue Breakdown (undefined, %) by Region 2025 & 2033
- Figure 2: Global New Energy Agricultural Tractors Volume Breakdown (K, %) by Region 2025 & 2033
- Figure 3: North America New Energy Agricultural Tractors Revenue (undefined), by Application 2025 & 2033
- Figure 4: North America New Energy Agricultural Tractors Volume (K), by Application 2025 & 2033
- Figure 5: North America New Energy Agricultural Tractors Revenue Share (%), by Application 2025 & 2033
- Figure 6: North America New Energy Agricultural Tractors Volume Share (%), by Application 2025 & 2033
- Figure 7: North America New Energy Agricultural Tractors Revenue (undefined), by Types 2025 & 2033
- Figure 8: North America New Energy Agricultural Tractors Volume (K), by Types 2025 & 2033
- Figure 9: North America New Energy Agricultural Tractors Revenue Share (%), by Types 2025 & 2033
- Figure 10: North America New Energy Agricultural Tractors Volume Share (%), by Types 2025 & 2033
- Figure 11: North America New Energy Agricultural Tractors Revenue (undefined), by Country 2025 & 2033
- Figure 12: North America New Energy Agricultural Tractors Volume (K), by Country 2025 & 2033
- Figure 13: North America New Energy Agricultural Tractors Revenue Share (%), by Country 2025 & 2033
- Figure 14: North America New Energy Agricultural Tractors Volume Share (%), by Country 2025 & 2033
- Figure 15: South America New Energy Agricultural Tractors Revenue (undefined), by Application 2025 & 2033
- Figure 16: South America New Energy Agricultural Tractors Volume (K), by Application 2025 & 2033
- Figure 17: South America New Energy Agricultural Tractors Revenue Share (%), by Application 2025 & 2033
- Figure 18: South America New Energy Agricultural Tractors Volume Share (%), by Application 2025 & 2033
- Figure 19: South America New Energy Agricultural Tractors Revenue (undefined), by Types 2025 & 2033
- Figure 20: South America New Energy Agricultural Tractors Volume (K), by Types 2025 & 2033
- Figure 21: South America New Energy Agricultural Tractors Revenue Share (%), by Types 2025 & 2033
- Figure 22: South America New Energy Agricultural Tractors Volume Share (%), by Types 2025 & 2033
- Figure 23: South America New Energy Agricultural Tractors Revenue (undefined), by Country 2025 & 2033
- Figure 24: South America New Energy Agricultural Tractors Volume (K), by Country 2025 & 2033
- Figure 25: South America New Energy Agricultural Tractors Revenue Share (%), by Country 2025 & 2033
- Figure 26: South America New Energy Agricultural Tractors Volume Share (%), by Country 2025 & 2033
- Figure 27: Europe New Energy Agricultural Tractors Revenue (undefined), by Application 2025 & 2033
- Figure 28: Europe New Energy Agricultural Tractors Volume (K), by Application 2025 & 2033
- Figure 29: Europe New Energy Agricultural Tractors Revenue Share (%), by Application 2025 & 2033
- Figure 30: Europe New Energy Agricultural Tractors Volume Share (%), by Application 2025 & 2033
- Figure 31: Europe New Energy Agricultural Tractors Revenue (undefined), by Types 2025 & 2033
- Figure 32: Europe New Energy Agricultural Tractors Volume (K), by Types 2025 & 2033
- Figure 33: Europe New Energy Agricultural Tractors Revenue Share (%), by Types 2025 & 2033
- Figure 34: Europe New Energy Agricultural Tractors Volume Share (%), by Types 2025 & 2033
- Figure 35: Europe New Energy Agricultural Tractors Revenue (undefined), by Country 2025 & 2033
- Figure 36: Europe New Energy Agricultural Tractors Volume (K), by Country 2025 & 2033
- Figure 37: Europe New Energy Agricultural Tractors Revenue Share (%), by Country 2025 & 2033
- Figure 38: Europe New Energy Agricultural Tractors Volume Share (%), by Country 2025 & 2033
- Figure 39: Middle East & Africa New Energy Agricultural Tractors Revenue (undefined), by Application 2025 & 2033
- Figure 40: Middle East & Africa New Energy Agricultural Tractors Volume (K), by Application 2025 & 2033
- Figure 41: Middle East & Africa New Energy Agricultural Tractors Revenue Share (%), by Application 2025 & 2033
- Figure 42: Middle East & Africa New Energy Agricultural Tractors Volume Share (%), by Application 2025 & 2033
- Figure 43: Middle East & Africa New Energy Agricultural Tractors Revenue (undefined), by Types 2025 & 2033
- Figure 44: Middle East & Africa New Energy Agricultural Tractors Volume (K), by Types 2025 & 2033
- Figure 45: Middle East & Africa New Energy Agricultural Tractors Revenue Share (%), by Types 2025 & 2033
- Figure 46: Middle East & Africa New Energy Agricultural Tractors Volume Share (%), by Types 2025 & 2033
- Figure 47: Middle East & Africa New Energy Agricultural Tractors Revenue (undefined), by Country 2025 & 2033
- Figure 48: Middle East & Africa New Energy Agricultural Tractors Volume (K), by Country 2025 & 2033
- Figure 49: Middle East & Africa New Energy Agricultural Tractors Revenue Share (%), by Country 2025 & 2033
- Figure 50: Middle East & Africa New Energy Agricultural Tractors Volume Share (%), by Country 2025 & 2033
- Figure 51: Asia Pacific New Energy Agricultural Tractors Revenue (undefined), by Application 2025 & 2033
- Figure 52: Asia Pacific New Energy Agricultural Tractors Volume (K), by Application 2025 & 2033
- Figure 53: Asia Pacific New Energy Agricultural Tractors Revenue Share (%), by Application 2025 & 2033
- Figure 54: Asia Pacific New Energy Agricultural Tractors Volume Share (%), by Application 2025 & 2033
- Figure 55: Asia Pacific New Energy Agricultural Tractors Revenue (undefined), by Types 2025 & 2033
- Figure 56: Asia Pacific New Energy Agricultural Tractors Volume (K), by Types 2025 & 2033
- Figure 57: Asia Pacific New Energy Agricultural Tractors Revenue Share (%), by Types 2025 & 2033
- Figure 58: Asia Pacific New Energy Agricultural Tractors Volume Share (%), by Types 2025 & 2033
- Figure 59: Asia Pacific New Energy Agricultural Tractors Revenue (undefined), by Country 2025 & 2033
- Figure 60: Asia Pacific New Energy Agricultural Tractors Volume (K), by Country 2025 & 2033
- Figure 61: Asia Pacific New Energy Agricultural Tractors Revenue Share (%), by Country 2025 & 2033
- Figure 62: Asia Pacific New Energy Agricultural Tractors Volume Share (%), by Country 2025 & 2033
List of Tables
- Table 1: Global New Energy Agricultural Tractors Revenue undefined Forecast, by Application 2020 & 2033
- Table 2: Global New Energy Agricultural Tractors Volume K Forecast, by Application 2020 & 2033
- Table 3: Global New Energy Agricultural Tractors Revenue undefined Forecast, by Types 2020 & 2033
- Table 4: Global New Energy Agricultural Tractors Volume K Forecast, by Types 2020 & 2033
- Table 5: Global New Energy Agricultural Tractors Revenue undefined Forecast, by Region 2020 & 2033
- Table 6: Global New Energy Agricultural Tractors Volume K Forecast, by Region 2020 & 2033
- Table 7: Global New Energy Agricultural Tractors Revenue undefined Forecast, by Application 2020 & 2033
- Table 8: Global New Energy Agricultural Tractors Volume K Forecast, by Application 2020 & 2033
- Table 9: Global New Energy Agricultural Tractors Revenue undefined Forecast, by Types 2020 & 2033
- Table 10: Global New Energy Agricultural Tractors Volume K Forecast, by Types 2020 & 2033
- Table 11: Global New Energy Agricultural Tractors Revenue undefined Forecast, by Country 2020 & 2033
- Table 12: Global New Energy Agricultural Tractors Volume K Forecast, by Country 2020 & 2033
- Table 13: United States New Energy Agricultural Tractors Revenue (undefined) Forecast, by Application 2020 & 2033
- Table 14: United States New Energy Agricultural Tractors Volume (K) Forecast, by Application 2020 & 2033
- Table 15: Canada New Energy Agricultural Tractors Revenue (undefined) Forecast, by Application 2020 & 2033
- Table 16: Canada New Energy Agricultural Tractors Volume (K) Forecast, by Application 2020 & 2033
- Table 17: Mexico New Energy Agricultural Tractors Revenue (undefined) Forecast, by Application 2020 & 2033
- Table 18: Mexico New Energy Agricultural Tractors Volume (K) Forecast, by Application 2020 & 2033
- Table 19: Global New Energy Agricultural Tractors Revenue undefined Forecast, by Application 2020 & 2033
- Table 20: Global New Energy Agricultural Tractors Volume K Forecast, by Application 2020 & 2033
- Table 21: Global New Energy Agricultural Tractors Revenue undefined Forecast, by Types 2020 & 2033
- Table 22: Global New Energy Agricultural Tractors Volume K Forecast, by Types 2020 & 2033
- Table 23: Global New Energy Agricultural Tractors Revenue undefined Forecast, by Country 2020 & 2033
- Table 24: Global New Energy Agricultural Tractors Volume K Forecast, by Country 2020 & 2033
- Table 25: Brazil New Energy Agricultural Tractors Revenue (undefined) Forecast, by Application 2020 & 2033
- Table 26: Brazil New Energy Agricultural Tractors Volume (K) Forecast, by Application 2020 & 2033
- Table 27: Argentina New Energy Agricultural Tractors Revenue (undefined) Forecast, by Application 2020 & 2033
- Table 28: Argentina New Energy Agricultural Tractors Volume (K) Forecast, by Application 2020 & 2033
- Table 29: Rest of South America New Energy Agricultural Tractors Revenue (undefined) Forecast, by Application 2020 & 2033
- Table 30: Rest of South America New Energy Agricultural Tractors Volume (K) Forecast, by Application 2020 & 2033
- Table 31: Global New Energy Agricultural Tractors Revenue undefined Forecast, by Application 2020 & 2033
- Table 32: Global New Energy Agricultural Tractors Volume K Forecast, by Application 2020 & 2033
- Table 33: Global New Energy Agricultural Tractors Revenue undefined Forecast, by Types 2020 & 2033
- Table 34: Global New Energy Agricultural Tractors Volume K Forecast, by Types 2020 & 2033
- Table 35: Global New Energy Agricultural Tractors Revenue undefined Forecast, by Country 2020 & 2033
- Table 36: Global New Energy Agricultural Tractors Volume K Forecast, by Country 2020 & 2033
- Table 37: United Kingdom New Energy Agricultural Tractors Revenue (undefined) Forecast, by Application 2020 & 2033
- Table 38: United Kingdom New Energy Agricultural Tractors Volume (K) Forecast, by Application 2020 & 2033
- Table 39: Germany New Energy Agricultural Tractors Revenue (undefined) Forecast, by Application 2020 & 2033
- Table 40: Germany New Energy Agricultural Tractors Volume (K) Forecast, by Application 2020 & 2033
- Table 41: France New Energy Agricultural Tractors Revenue (undefined) Forecast, by Application 2020 & 2033
- Table 42: France New Energy Agricultural Tractors Volume (K) Forecast, by Application 2020 & 2033
- Table 43: Italy New Energy Agricultural Tractors Revenue (undefined) Forecast, by Application 2020 & 2033
- Table 44: Italy New Energy Agricultural Tractors Volume (K) Forecast, by Application 2020 & 2033
- Table 45: Spain New Energy Agricultural Tractors Revenue (undefined) Forecast, by Application 2020 & 2033
- Table 46: Spain New Energy Agricultural Tractors Volume (K) Forecast, by Application 2020 & 2033
- Table 47: Russia New Energy Agricultural Tractors Revenue (undefined) Forecast, by Application 2020 & 2033
- Table 48: Russia New Energy Agricultural Tractors Volume (K) Forecast, by Application 2020 & 2033
- Table 49: Benelux New Energy Agricultural Tractors Revenue (undefined) Forecast, by Application 2020 & 2033
- Table 50: Benelux New Energy Agricultural Tractors Volume (K) Forecast, by Application 2020 & 2033
- Table 51: Nordics New Energy Agricultural Tractors Revenue (undefined) Forecast, by Application 2020 & 2033
- Table 52: Nordics New Energy Agricultural Tractors Volume (K) Forecast, by Application 2020 & 2033
- Table 53: Rest of Europe New Energy Agricultural Tractors Revenue (undefined) Forecast, by Application 2020 & 2033
- Table 54: Rest of Europe New Energy Agricultural Tractors Volume (K) Forecast, by Application 2020 & 2033
- Table 55: Global New Energy Agricultural Tractors Revenue undefined Forecast, by Application 2020 & 2033
- Table 56: Global New Energy Agricultural Tractors Volume K Forecast, by Application 2020 & 2033
- Table 57: Global New Energy Agricultural Tractors Revenue undefined Forecast, by Types 2020 & 2033
- Table 58: Global New Energy Agricultural Tractors Volume K Forecast, by Types 2020 & 2033
- Table 59: Global New Energy Agricultural Tractors Revenue undefined Forecast, by Country 2020 & 2033
- Table 60: Global New Energy Agricultural Tractors Volume K Forecast, by Country 2020 & 2033
- Table 61: Turkey New Energy Agricultural Tractors Revenue (undefined) Forecast, by Application 2020 & 2033
- Table 62: Turkey New Energy Agricultural Tractors Volume (K) Forecast, by Application 2020 & 2033
- Table 63: Israel New Energy Agricultural Tractors Revenue (undefined) Forecast, by Application 2020 & 2033
- Table 64: Israel New Energy Agricultural Tractors Volume (K) Forecast, by Application 2020 & 2033
- Table 65: GCC New Energy Agricultural Tractors Revenue (undefined) Forecast, by Application 2020 & 2033
- Table 66: GCC New Energy Agricultural Tractors Volume (K) Forecast, by Application 2020 & 2033
- Table 67: North Africa New Energy Agricultural Tractors Revenue (undefined) Forecast, by Application 2020 & 2033
- Table 68: North Africa New Energy Agricultural Tractors Volume (K) Forecast, by Application 2020 & 2033
- Table 69: South Africa New Energy Agricultural Tractors Revenue (undefined) Forecast, by Application 2020 & 2033
- Table 70: South Africa New Energy Agricultural Tractors Volume (K) Forecast, by Application 2020 & 2033
- Table 71: Rest of Middle East & Africa New Energy Agricultural Tractors Revenue (undefined) Forecast, by Application 2020 & 2033
- Table 72: Rest of Middle East & Africa New Energy Agricultural Tractors Volume (K) Forecast, by Application 2020 & 2033
- Table 73: Global New Energy Agricultural Tractors Revenue undefined Forecast, by Application 2020 & 2033
- Table 74: Global New Energy Agricultural Tractors Volume K Forecast, by Application 2020 & 2033
- Table 75: Global New Energy Agricultural Tractors Revenue undefined Forecast, by Types 2020 & 2033
- Table 76: Global New Energy Agricultural Tractors Volume K Forecast, by Types 2020 & 2033
- Table 77: Global New Energy Agricultural Tractors Revenue undefined Forecast, by Country 2020 & 2033
- Table 78: Global New Energy Agricultural Tractors Volume K Forecast, by Country 2020 & 2033
- Table 79: China New Energy Agricultural Tractors Revenue (undefined) Forecast, by Application 2020 & 2033
- Table 80: China New Energy Agricultural Tractors Volume (K) Forecast, by Application 2020 & 2033
- Table 81: India New Energy Agricultural Tractors Revenue (undefined) Forecast, by Application 2020 & 2033
- Table 82: India New Energy Agricultural Tractors Volume (K) Forecast, by Application 2020 & 2033
- Table 83: Japan New Energy Agricultural Tractors Revenue (undefined) Forecast, by Application 2020 & 2033
- Table 84: Japan New Energy Agricultural Tractors Volume (K) Forecast, by Application 2020 & 2033
- Table 85: South Korea New Energy Agricultural Tractors Revenue (undefined) Forecast, by Application 2020 & 2033
- Table 86: South Korea New Energy Agricultural Tractors Volume (K) Forecast, by Application 2020 & 2033
- Table 87: ASEAN New Energy Agricultural Tractors Revenue (undefined) Forecast, by Application 2020 & 2033
- Table 88: ASEAN New Energy Agricultural Tractors Volume (K) Forecast, by Application 2020 & 2033
- Table 89: Oceania New Energy Agricultural Tractors Revenue (undefined) Forecast, by Application 2020 & 2033
- Table 90: Oceania New Energy Agricultural Tractors Volume (K) Forecast, by Application 2020 & 2033
- Table 91: Rest of Asia Pacific New Energy Agricultural Tractors Revenue (undefined) Forecast, by Application 2020 & 2033
- Table 92: Rest of Asia Pacific New Energy Agricultural Tractors Volume (K) Forecast, by Application 2020 & 2033
Frequently Asked Questions
1. What is the projected Compound Annual Growth Rate (CAGR) of the New Energy Agricultural Tractors?
The projected CAGR is approximately 17.04%.
2. Which companies are prominent players in the New Energy Agricultural Tractors?
Key companies in the market include John Deere, Fendt, Rigitrac, Solectrac, Monarch Tractor, Kubota, Sonalika Group, Case IH, Nongbang Agricultural Machinery, Jiangsu Yueda Intelligent Agricultural Equipment.
3. What are the main segments of the New Energy Agricultural Tractors?
The market segments include Application, Types.
4. Can you provide details about the market size?
The market size is estimated to be USD XXX N/A as of 2022.
5. What are some drivers contributing to market growth?
N/A
6. What are the notable trends driving market growth?
N/A
7. Are there any restraints impacting market growth?
N/A
8. Can you provide examples of recent developments in the market?
N/A
9. What pricing options are available for accessing the report?
Pricing options include single-user, multi-user, and enterprise licenses priced at USD 3950.00, USD 5925.00, and USD 7900.00 respectively.
10. Is the market size provided in terms of value or volume?
The market size is provided in terms of value, measured in N/A and volume, measured in K.
11. Are there any specific market keywords associated with the report?
Yes, the market keyword associated with the report is "New Energy Agricultural Tractors," which aids in identifying and referencing the specific market segment covered.
12. How do I determine which pricing option suits my needs best?
The pricing options vary based on user requirements and access needs. Individual users may opt for single-user licenses, while businesses requiring broader access may choose multi-user or enterprise licenses for cost-effective access to the report.
13. Are there any additional resources or data provided in the New Energy Agricultural Tractors report?
While the report offers comprehensive insights, it's advisable to review the specific contents or supplementary materials provided to ascertain if additional resources or data are available.
14. How can I stay updated on further developments or reports in the New Energy Agricultural Tractors?
To stay informed about further developments, trends, and reports in the New Energy Agricultural Tractors, consider subscribing to industry newsletters, following relevant companies and organizations, or regularly checking reputable industry news sources and publications.
Methodology
Step 1 - Identification of Relevant Samples Size from Population Database


Step 2 - Approaches for Defining Global Market Size (Value, Volume* & Price*)

Note*: In applicable scenarios
Step 3 - Data Sources
Primary Research
- Web Analytics
- Survey Reports
- Research Institute
- Latest Research Reports
- Opinion Leaders
Secondary Research
- Annual Reports
- White Paper
- Latest Press Release
- Industry Association
- Paid Database
- Investor Presentations

Step 4 - Data Triangulation
Involves using different sources of information in order to increase the validity of a study
These sources are likely to be stakeholders in a program - participants, other researchers, program staff, other community members, and so on.
Then we put all data in single framework & apply various statistical tools to find out the dynamic on the market.
During the analysis stage, feedback from the stakeholder groups would be compared to determine areas of agreement as well as areas of divergence