

Key Insights
The global meat analogues market is experiencing robust growth, driven by increasing consumer demand for plant-based protein sources. Factors such as rising health consciousness, environmental concerns surrounding traditional meat production, and the growing popularity of vegetarian and vegan diets are significantly contributing to this expansion. The market is highly competitive, with established food giants like Nestle, Unilever, and Kellogg's alongside innovative startups such as Beyond Meat and Impossible Foods vying for market share. Technological advancements in mimicking the texture, taste, and nutritional profile of meat are crucial to the market's continued success. Product diversification, encompassing burgers, sausages, poultry alternatives, and even seafood substitutes, caters to a broader consumer base and fuels market expansion. Regional variations exist, with North America and Europe currently dominating the market due to higher adoption rates and greater awareness of plant-based alternatives. However, Asia-Pacific is poised for significant growth, driven by increasing disposable incomes and a growing population. The market is segmented by product type, distribution channel (retail, food service), and geographic location, allowing for targeted marketing and investment strategies. Challenges remain, including consumer perceptions related to taste and price, as well as the need for continued innovation to enhance product appeal and sustainability. Despite these challenges, the long-term outlook for the meat analogues market remains positive, with projections indicating sustained growth over the next decade.
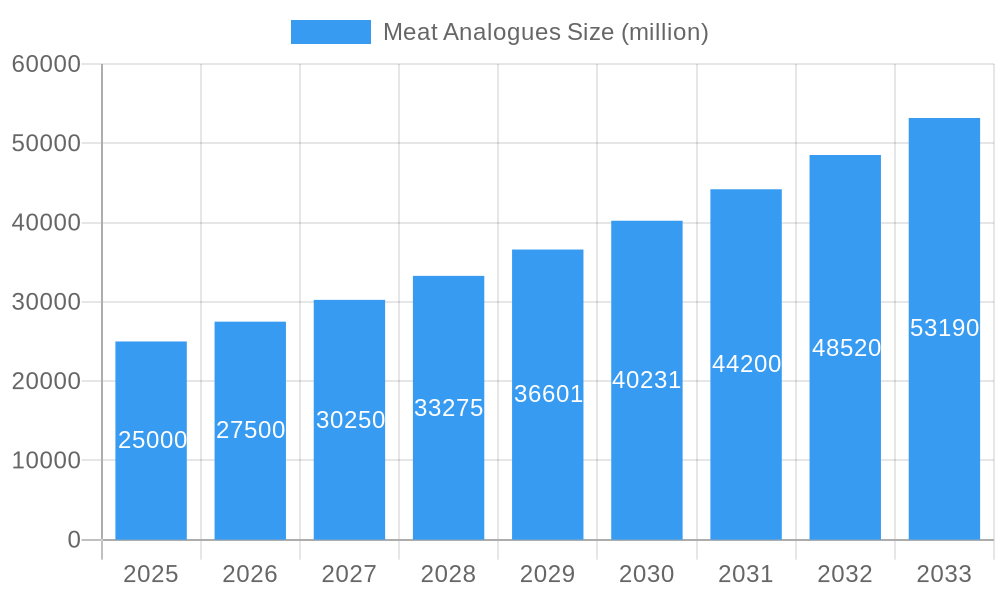
Meat Analogues Market Size (In Billion)
The competitive landscape is characterized by a mix of large multinational corporations and smaller, innovative companies. The larger players leverage their established distribution networks and brand recognition, while smaller companies focus on innovation and niche market penetration. Strategic partnerships, mergers and acquisitions, and product launches are key competitive strategies within this dynamic market. Pricing strategies, marketing campaigns emphasizing health benefits and environmental sustainability, and supply chain optimization are also important factors influencing market dynamics. Continued research and development efforts focused on improving product quality, reducing costs, and expanding product offerings are essential for sustained success in this competitive landscape. Regulation and government initiatives promoting sustainable food production and plant-based alternatives will also play a crucial role in shaping future market growth. Ultimately, the meat analogues market is positioned for substantial growth, driven by evolving consumer preferences and a growing awareness of the environmental and health implications of traditional meat consumption.
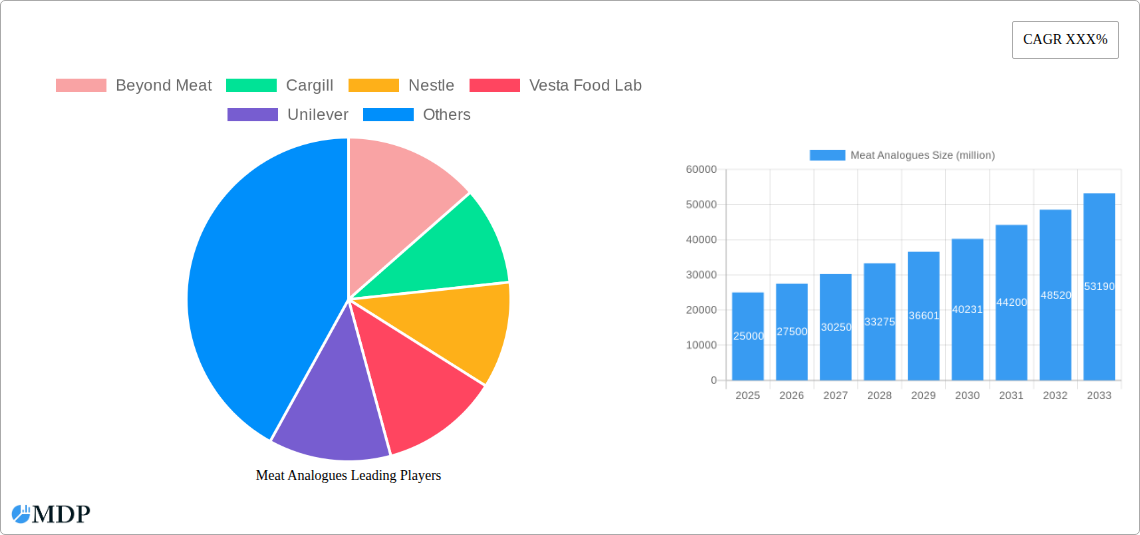
Meat Analogues Company Market Share
Meat Analogues Market Report: A Comprehensive Analysis (2019-2033)
This comprehensive report provides an in-depth analysis of the global meat analogues market, offering invaluable insights for industry stakeholders, investors, and businesses seeking to navigate this rapidly evolving sector. The study period covers 2019-2033, with a base year of 2025 and a forecast period of 2025-2033. This report projects a market valued at $xx million in 2025, experiencing significant growth throughout the forecast period. The report leverages extensive data analysis to provide actionable insights and projections, focusing on key market trends, leading players, and emerging opportunities.
Meat Analogues Market Dynamics & Concentration
The global meat analogues market is characterized by a dynamic interplay of factors influencing its growth and concentration. Market concentration is moderately high, with several key players holding significant market share. However, the presence of numerous smaller players and ongoing innovation ensures a competitive landscape. Beyond Meat and Impossible Foods currently hold leading positions, followed by established food giants like Nestle and Cargill. Mergers and acquisitions (M&A) have played a significant role in shaping the market landscape, with approximately xx M&A deals recorded between 2019 and 2024. Innovation drivers include advancements in plant-based protein technologies, increasing consumer demand for sustainable food options, and favorable regulatory environments in certain regions. Product substitutes include traditional meat products, which continue to compete, while end-user trends show a strong preference for healthier and more sustainable options.
- Market Share (2025 Estimate): Beyond Meat (xx%), Impossible Foods (xx%), Nestle (xx%), Cargill (xx%), Others (xx%).
- M&A Deal Count (2019-2024): xx
- Key Innovation Drivers: Advancements in plant-based protein extraction and processing, improved taste and texture of meat analogues, development of novel ingredients.
- Regulatory Frameworks: Vary across regions, impacting market growth and ingredient usage.
Meat Analogues Industry Trends & Analysis
The meat analogues market is experiencing robust growth, driven by a confluence of factors. The compound annual growth rate (CAGR) is projected to be xx% during the forecast period (2025-2033). This growth is fueled by several key trends: increasing consumer awareness of health and environmental concerns associated with traditional meat consumption; rising demand for sustainable and ethical food sources; technological advancements leading to improved product quality and affordability; and expansion of distribution channels, making meat analogues increasingly accessible. The market penetration rate is expected to reach xx% by 2033, signifying a substantial increase in market adoption. Competitive dynamics are shaped by ongoing innovation, branding strategies, and price competition. Market segmentation continues to evolve with the emergence of new product categories and variations tailored to different consumer needs and preferences.
Leading Markets & Segments in Meat Analogues
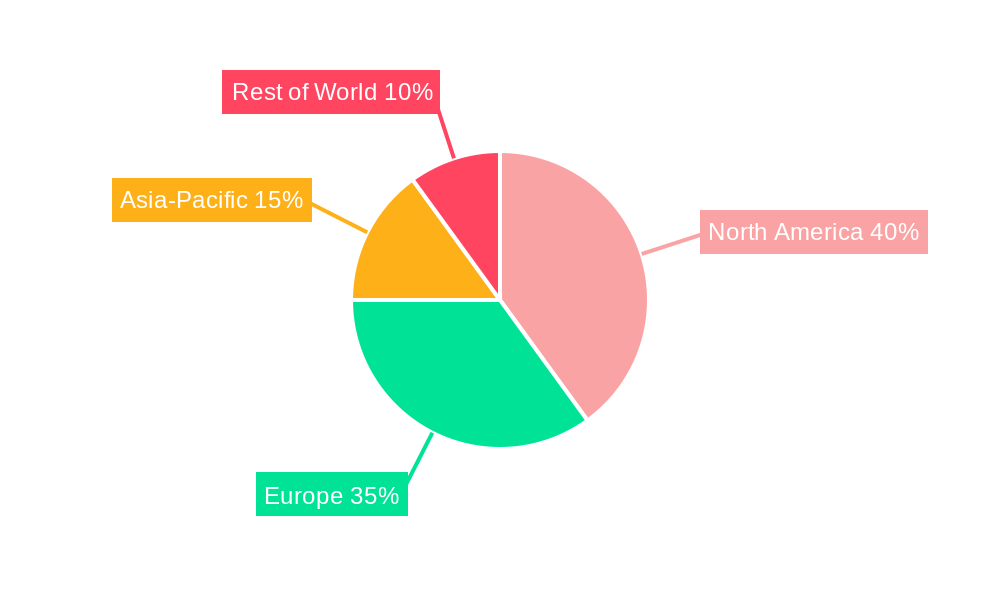
North America currently dominates the global meat analogues market, followed by Europe and Asia-Pacific. This dominance stems from several factors:
- North America: High consumer awareness of health and environmental issues, strong regulatory support for plant-based products, and established distribution networks.
- Europe: Growing demand for sustainable food, stringent regulations promoting plant-based alternatives, and strong consumer adoption of vegetarian and vegan lifestyles.
- Asia-Pacific: Rapidly expanding market fueled by increasing disposable incomes, rising health consciousness, and a growing preference for plant-based protein sources.
The burger segment holds the largest market share, followed by sausages and other meat alternatives.
- Key Drivers in North America: High disposable incomes, strong consumer preference for plant-based alternatives, and availability of diverse product offerings.
- Key Drivers in Europe: Stricter environmental regulations, increased awareness of the environmental impact of meat consumption, and a higher percentage of vegetarian/vegan consumers.
- Key Drivers in Asia-Pacific: Expanding middle class, increasing dietary diversification, and government support for sustainable agriculture practices.
Meat Analogues Product Developments
Recent product developments focus on enhancing taste, texture, and nutritional profile, mimicking traditional meat products more closely. This involves innovative processing techniques, improved protein sources, and the addition of natural flavorings and colorings. The emphasis is on creating products that appeal to a broader consumer base, moving beyond strictly vegetarian/vegan consumers. Technological trends include the use of 3D printing and precision fermentation to produce realistic meat analogues. These developments are strategically tailored to address market needs and preferences for more sustainable and convenient options.
Key Drivers of Meat Analogues Growth
Several factors are driving the sustained growth of the meat analogues market:
- Technological Advancements: Improved production processes, resulting in cost-effectiveness and higher-quality products.
- Economic Factors: Rising disposable incomes in developing economies, increasing demand for affordable protein sources.
- Regulatory Support: Government policies and initiatives promoting sustainable agriculture and plant-based foods. Examples include subsidies for plant-based protein production and labeling regulations promoting transparency.
Challenges in the Meat Analogues Market
Despite significant growth potential, the meat analogues market faces several challenges:
- Regulatory Hurdles: Varying regulatory landscapes across different regions create complexities in product development and market entry.
- Supply Chain Issues: Securing consistent supplies of high-quality raw materials, such as plant-based proteins, remains a challenge for some manufacturers.
- Competitive Pressures: Intense competition from established meat producers and emerging players requires constant innovation and strategic marketing. This competition significantly impacts pricing strategies and market share.
Emerging Opportunities in Meat Analogues
The future of the meat analogues market presents significant opportunities. Technological breakthroughs in cellular agriculture and precision fermentation could revolutionize the production of meat analogues, offering cost-effective and sustainable solutions. Strategic partnerships between established food companies and innovative startups are creating new opportunities for market expansion and product diversification. Expansion into new markets, particularly in developing economies, presents a vast untapped potential for growth.
Leading Players in the Meat Analogues Sector
- Beyond Meat
- Cargill
- Nestle
- Vesta Food Lab
- Unilever
- Omnipork
- Impossible Foods
- Turtle Island Foods
- Maple Leaf
- Yves Veggie Cuisine
- Kellogg's
- Qishan Foods
- Hongchang Food
- Sulian Food
Key Milestones in Meat Analogues Industry
- 2019: Beyond Meat's successful IPO signals growing investor interest in the sector.
- 2020: Increased consumer demand for plant-based alternatives during the pandemic.
- 2021: Several major food companies launch their own lines of meat analogues.
- 2022: Significant advancements in cellular agriculture technology.
- 2023: Growing partnerships between food tech startups and established food companies.
- 2024: Increased focus on sustainability and traceability in the meat analogues supply chain.
Strategic Outlook for Meat Analogues Market
The meat analogues market is poised for continued expansion, driven by technological innovations, changing consumer preferences, and increased regulatory support. Strategic opportunities include developing novel products tailored to specific consumer needs, expanding into new geographic markets, and forging strategic alliances to improve supply chain efficiency and market penetration. The long-term potential for growth is substantial, and companies that can adapt to evolving market dynamics and embrace innovation will be best positioned to succeed.
Meat Analogues Segmentation
-
1. Application
- 1.1. Food Service
- 1.2. Retail
- 1.3. Others
-
2. Type
- 2.1. Meat
- 2.2. Meat Products
Meat Analogues Segmentation By Geography
-
1. North America
- 1.1. United States
- 1.2. Canada
- 1.3. Mexico
-
2. South America
- 2.1. Brazil
- 2.2. Argentina
- 2.3. Rest of South America
-
3. Europe
- 3.1. United Kingdom
- 3.2. Germany
- 3.3. France
- 3.4. Italy
- 3.5. Spain
- 3.6. Russia
- 3.7. Benelux
- 3.8. Nordics
- 3.9. Rest of Europe
-
4. Middle East & Africa
- 4.1. Turkey
- 4.2. Israel
- 4.3. GCC
- 4.4. North Africa
- 4.5. South Africa
- 4.6. Rest of Middle East & Africa
-
5. Asia Pacific
- 5.1. China
- 5.2. India
- 5.3. Japan
- 5.4. South Korea
- 5.5. ASEAN
- 5.6. Oceania
- 5.7. Rest of Asia Pacific
Meat Analogues Regional Market Share
Geographic Coverage of Meat Analogues
Meat Analogues REPORT HIGHLIGHTS
| Aspects | Details |
|---|---|
| Study Period | 2020-2034 |
| Base Year | 2025 |
| Estimated Year | 2026 |
| Forecast Period | 2026-2034 |
| Historical Period | 2020-2025 |
| Growth Rate | CAGR of 3.5% from 2020-2034 |
| Segmentation |
|
Table of Contents
- 1. Introduction
- 1.1. Research Scope
- 1.2. Market Segmentation
- 1.3. Research Methodology
- 1.4. Definitions and Assumptions
- 2. Executive Summary
- 2.1. Introduction
- 3. Market Dynamics
- 3.1. Introduction
- 3.2. Market Drivers
- 3.3. Market Restrains
- 3.4. Market Trends
- 4. Market Factor Analysis
- 4.1. Porters Five Forces
- 4.2. Supply/Value Chain
- 4.3. PESTEL analysis
- 4.4. Market Entropy
- 4.5. Patent/Trademark Analysis
- 5. Global Meat Analogues Analysis, Insights and Forecast, 2020-2032
- 5.1. Market Analysis, Insights and Forecast - by Application
- 5.1.1. Food Service
- 5.1.2. Retail
- 5.1.3. Others
- 5.2. Market Analysis, Insights and Forecast - by Type
- 5.2.1. Meat
- 5.2.2. Meat Products
- 5.3. Market Analysis, Insights and Forecast - by Region
- 5.3.1. North America
- 5.3.2. South America
- 5.3.3. Europe
- 5.3.4. Middle East & Africa
- 5.3.5. Asia Pacific
- 5.1. Market Analysis, Insights and Forecast - by Application
- 6. North America Meat Analogues Analysis, Insights and Forecast, 2020-2032
- 6.1. Market Analysis, Insights and Forecast - by Application
- 6.1.1. Food Service
- 6.1.2. Retail
- 6.1.3. Others
- 6.2. Market Analysis, Insights and Forecast - by Type
- 6.2.1. Meat
- 6.2.2. Meat Products
- 6.1. Market Analysis, Insights and Forecast - by Application
- 7. South America Meat Analogues Analysis, Insights and Forecast, 2020-2032
- 7.1. Market Analysis, Insights and Forecast - by Application
- 7.1.1. Food Service
- 7.1.2. Retail
- 7.1.3. Others
- 7.2. Market Analysis, Insights and Forecast - by Type
- 7.2.1. Meat
- 7.2.2. Meat Products
- 7.1. Market Analysis, Insights and Forecast - by Application
- 8. Europe Meat Analogues Analysis, Insights and Forecast, 2020-2032
- 8.1. Market Analysis, Insights and Forecast - by Application
- 8.1.1. Food Service
- 8.1.2. Retail
- 8.1.3. Others
- 8.2. Market Analysis, Insights and Forecast - by Type
- 8.2.1. Meat
- 8.2.2. Meat Products
- 8.1. Market Analysis, Insights and Forecast - by Application
- 9. Middle East & Africa Meat Analogues Analysis, Insights and Forecast, 2020-2032
- 9.1. Market Analysis, Insights and Forecast - by Application
- 9.1.1. Food Service
- 9.1.2. Retail
- 9.1.3. Others
- 9.2. Market Analysis, Insights and Forecast - by Type
- 9.2.1. Meat
- 9.2.2. Meat Products
- 9.1. Market Analysis, Insights and Forecast - by Application
- 10. Asia Pacific Meat Analogues Analysis, Insights and Forecast, 2020-2032
- 10.1. Market Analysis, Insights and Forecast - by Application
- 10.1.1. Food Service
- 10.1.2. Retail
- 10.1.3. Others
- 10.2. Market Analysis, Insights and Forecast - by Type
- 10.2.1. Meat
- 10.2.2. Meat Products
- 10.1. Market Analysis, Insights and Forecast - by Application
- 11. Competitive Analysis
- 11.1. Global Market Share Analysis 2025
- 11.2. Company Profiles
- 11.2.1 Beyond Meat
- 11.2.1.1. Overview
- 11.2.1.2. Products
- 11.2.1.3. SWOT Analysis
- 11.2.1.4. Recent Developments
- 11.2.1.5. Financials (Based on Availability)
- 11.2.2 Cargill
- 11.2.2.1. Overview
- 11.2.2.2. Products
- 11.2.2.3. SWOT Analysis
- 11.2.2.4. Recent Developments
- 11.2.2.5. Financials (Based on Availability)
- 11.2.3 Nestle
- 11.2.3.1. Overview
- 11.2.3.2. Products
- 11.2.3.3. SWOT Analysis
- 11.2.3.4. Recent Developments
- 11.2.3.5. Financials (Based on Availability)
- 11.2.4 Vesta Food Lab
- 11.2.4.1. Overview
- 11.2.4.2. Products
- 11.2.4.3. SWOT Analysis
- 11.2.4.4. Recent Developments
- 11.2.4.5. Financials (Based on Availability)
- 11.2.5 Unilever
- 11.2.5.1. Overview
- 11.2.5.2. Products
- 11.2.5.3. SWOT Analysis
- 11.2.5.4. Recent Developments
- 11.2.5.5. Financials (Based on Availability)
- 11.2.6 Omnipork
- 11.2.6.1. Overview
- 11.2.6.2. Products
- 11.2.6.3. SWOT Analysis
- 11.2.6.4. Recent Developments
- 11.2.6.5. Financials (Based on Availability)
- 11.2.7 Impossible Foods
- 11.2.7.1. Overview
- 11.2.7.2. Products
- 11.2.7.3. SWOT Analysis
- 11.2.7.4. Recent Developments
- 11.2.7.5. Financials (Based on Availability)
- 11.2.8 Turtle Island Foods
- 11.2.8.1. Overview
- 11.2.8.2. Products
- 11.2.8.3. SWOT Analysis
- 11.2.8.4. Recent Developments
- 11.2.8.5. Financials (Based on Availability)
- 11.2.9 Maple Leaf
- 11.2.9.1. Overview
- 11.2.9.2. Products
- 11.2.9.3. SWOT Analysis
- 11.2.9.4. Recent Developments
- 11.2.9.5. Financials (Based on Availability)
- 11.2.10 Yves Veggie Cuisine
- 11.2.10.1. Overview
- 11.2.10.2. Products
- 11.2.10.3. SWOT Analysis
- 11.2.10.4. Recent Developments
- 11.2.10.5. Financials (Based on Availability)
- 11.2.11 Kellogg's
- 11.2.11.1. Overview
- 11.2.11.2. Products
- 11.2.11.3. SWOT Analysis
- 11.2.11.4. Recent Developments
- 11.2.11.5. Financials (Based on Availability)
- 11.2.12 Qishan Foods
- 11.2.12.1. Overview
- 11.2.12.2. Products
- 11.2.12.3. SWOT Analysis
- 11.2.12.4. Recent Developments
- 11.2.12.5. Financials (Based on Availability)
- 11.2.13 Hongchang Food
- 11.2.13.1. Overview
- 11.2.13.2. Products
- 11.2.13.3. SWOT Analysis
- 11.2.13.4. Recent Developments
- 11.2.13.5. Financials (Based on Availability)
- 11.2.14 Sulian Food
- 11.2.14.1. Overview
- 11.2.14.2. Products
- 11.2.14.3. SWOT Analysis
- 11.2.14.4. Recent Developments
- 11.2.14.5. Financials (Based on Availability)
- 11.2.1 Beyond Meat
List of Figures
- Figure 1: Global Meat Analogues Revenue Breakdown (undefined, %) by Region 2025 & 2033
- Figure 2: Global Meat Analogues Volume Breakdown (K, %) by Region 2025 & 2033
- Figure 3: North America Meat Analogues Revenue (undefined), by Application 2025 & 2033
- Figure 4: North America Meat Analogues Volume (K), by Application 2025 & 2033
- Figure 5: North America Meat Analogues Revenue Share (%), by Application 2025 & 2033
- Figure 6: North America Meat Analogues Volume Share (%), by Application 2025 & 2033
- Figure 7: North America Meat Analogues Revenue (undefined), by Type 2025 & 2033
- Figure 8: North America Meat Analogues Volume (K), by Type 2025 & 2033
- Figure 9: North America Meat Analogues Revenue Share (%), by Type 2025 & 2033
- Figure 10: North America Meat Analogues Volume Share (%), by Type 2025 & 2033
- Figure 11: North America Meat Analogues Revenue (undefined), by Country 2025 & 2033
- Figure 12: North America Meat Analogues Volume (K), by Country 2025 & 2033
- Figure 13: North America Meat Analogues Revenue Share (%), by Country 2025 & 2033
- Figure 14: North America Meat Analogues Volume Share (%), by Country 2025 & 2033
- Figure 15: South America Meat Analogues Revenue (undefined), by Application 2025 & 2033
- Figure 16: South America Meat Analogues Volume (K), by Application 2025 & 2033
- Figure 17: South America Meat Analogues Revenue Share (%), by Application 2025 & 2033
- Figure 18: South America Meat Analogues Volume Share (%), by Application 2025 & 2033
- Figure 19: South America Meat Analogues Revenue (undefined), by Type 2025 & 2033
- Figure 20: South America Meat Analogues Volume (K), by Type 2025 & 2033
- Figure 21: South America Meat Analogues Revenue Share (%), by Type 2025 & 2033
- Figure 22: South America Meat Analogues Volume Share (%), by Type 2025 & 2033
- Figure 23: South America Meat Analogues Revenue (undefined), by Country 2025 & 2033
- Figure 24: South America Meat Analogues Volume (K), by Country 2025 & 2033
- Figure 25: South America Meat Analogues Revenue Share (%), by Country 2025 & 2033
- Figure 26: South America Meat Analogues Volume Share (%), by Country 2025 & 2033
- Figure 27: Europe Meat Analogues Revenue (undefined), by Application 2025 & 2033
- Figure 28: Europe Meat Analogues Volume (K), by Application 2025 & 2033
- Figure 29: Europe Meat Analogues Revenue Share (%), by Application 2025 & 2033
- Figure 30: Europe Meat Analogues Volume Share (%), by Application 2025 & 2033
- Figure 31: Europe Meat Analogues Revenue (undefined), by Type 2025 & 2033
- Figure 32: Europe Meat Analogues Volume (K), by Type 2025 & 2033
- Figure 33: Europe Meat Analogues Revenue Share (%), by Type 2025 & 2033
- Figure 34: Europe Meat Analogues Volume Share (%), by Type 2025 & 2033
- Figure 35: Europe Meat Analogues Revenue (undefined), by Country 2025 & 2033
- Figure 36: Europe Meat Analogues Volume (K), by Country 2025 & 2033
- Figure 37: Europe Meat Analogues Revenue Share (%), by Country 2025 & 2033
- Figure 38: Europe Meat Analogues Volume Share (%), by Country 2025 & 2033
- Figure 39: Middle East & Africa Meat Analogues Revenue (undefined), by Application 2025 & 2033
- Figure 40: Middle East & Africa Meat Analogues Volume (K), by Application 2025 & 2033
- Figure 41: Middle East & Africa Meat Analogues Revenue Share (%), by Application 2025 & 2033
- Figure 42: Middle East & Africa Meat Analogues Volume Share (%), by Application 2025 & 2033
- Figure 43: Middle East & Africa Meat Analogues Revenue (undefined), by Type 2025 & 2033
- Figure 44: Middle East & Africa Meat Analogues Volume (K), by Type 2025 & 2033
- Figure 45: Middle East & Africa Meat Analogues Revenue Share (%), by Type 2025 & 2033
- Figure 46: Middle East & Africa Meat Analogues Volume Share (%), by Type 2025 & 2033
- Figure 47: Middle East & Africa Meat Analogues Revenue (undefined), by Country 2025 & 2033
- Figure 48: Middle East & Africa Meat Analogues Volume (K), by Country 2025 & 2033
- Figure 49: Middle East & Africa Meat Analogues Revenue Share (%), by Country 2025 & 2033
- Figure 50: Middle East & Africa Meat Analogues Volume Share (%), by Country 2025 & 2033
- Figure 51: Asia Pacific Meat Analogues Revenue (undefined), by Application 2025 & 2033
- Figure 52: Asia Pacific Meat Analogues Volume (K), by Application 2025 & 2033
- Figure 53: Asia Pacific Meat Analogues Revenue Share (%), by Application 2025 & 2033
- Figure 54: Asia Pacific Meat Analogues Volume Share (%), by Application 2025 & 2033
- Figure 55: Asia Pacific Meat Analogues Revenue (undefined), by Type 2025 & 2033
- Figure 56: Asia Pacific Meat Analogues Volume (K), by Type 2025 & 2033
- Figure 57: Asia Pacific Meat Analogues Revenue Share (%), by Type 2025 & 2033
- Figure 58: Asia Pacific Meat Analogues Volume Share (%), by Type 2025 & 2033
- Figure 59: Asia Pacific Meat Analogues Revenue (undefined), by Country 2025 & 2033
- Figure 60: Asia Pacific Meat Analogues Volume (K), by Country 2025 & 2033
- Figure 61: Asia Pacific Meat Analogues Revenue Share (%), by Country 2025 & 2033
- Figure 62: Asia Pacific Meat Analogues Volume Share (%), by Country 2025 & 2033
List of Tables
- Table 1: Global Meat Analogues Revenue undefined Forecast, by Application 2020 & 2033
- Table 2: Global Meat Analogues Volume K Forecast, by Application 2020 & 2033
- Table 3: Global Meat Analogues Revenue undefined Forecast, by Type 2020 & 2033
- Table 4: Global Meat Analogues Volume K Forecast, by Type 2020 & 2033
- Table 5: Global Meat Analogues Revenue undefined Forecast, by Region 2020 & 2033
- Table 6: Global Meat Analogues Volume K Forecast, by Region 2020 & 2033
- Table 7: Global Meat Analogues Revenue undefined Forecast, by Application 2020 & 2033
- Table 8: Global Meat Analogues Volume K Forecast, by Application 2020 & 2033
- Table 9: Global Meat Analogues Revenue undefined Forecast, by Type 2020 & 2033
- Table 10: Global Meat Analogues Volume K Forecast, by Type 2020 & 2033
- Table 11: Global Meat Analogues Revenue undefined Forecast, by Country 2020 & 2033
- Table 12: Global Meat Analogues Volume K Forecast, by Country 2020 & 2033
- Table 13: United States Meat Analogues Revenue (undefined) Forecast, by Application 2020 & 2033
- Table 14: United States Meat Analogues Volume (K) Forecast, by Application 2020 & 2033
- Table 15: Canada Meat Analogues Revenue (undefined) Forecast, by Application 2020 & 2033
- Table 16: Canada Meat Analogues Volume (K) Forecast, by Application 2020 & 2033
- Table 17: Mexico Meat Analogues Revenue (undefined) Forecast, by Application 2020 & 2033
- Table 18: Mexico Meat Analogues Volume (K) Forecast, by Application 2020 & 2033
- Table 19: Global Meat Analogues Revenue undefined Forecast, by Application 2020 & 2033
- Table 20: Global Meat Analogues Volume K Forecast, by Application 2020 & 2033
- Table 21: Global Meat Analogues Revenue undefined Forecast, by Type 2020 & 2033
- Table 22: Global Meat Analogues Volume K Forecast, by Type 2020 & 2033
- Table 23: Global Meat Analogues Revenue undefined Forecast, by Country 2020 & 2033
- Table 24: Global Meat Analogues Volume K Forecast, by Country 2020 & 2033
- Table 25: Brazil Meat Analogues Revenue (undefined) Forecast, by Application 2020 & 2033
- Table 26: Brazil Meat Analogues Volume (K) Forecast, by Application 2020 & 2033
- Table 27: Argentina Meat Analogues Revenue (undefined) Forecast, by Application 2020 & 2033
- Table 28: Argentina Meat Analogues Volume (K) Forecast, by Application 2020 & 2033
- Table 29: Rest of South America Meat Analogues Revenue (undefined) Forecast, by Application 2020 & 2033
- Table 30: Rest of South America Meat Analogues Volume (K) Forecast, by Application 2020 & 2033
- Table 31: Global Meat Analogues Revenue undefined Forecast, by Application 2020 & 2033
- Table 32: Global Meat Analogues Volume K Forecast, by Application 2020 & 2033
- Table 33: Global Meat Analogues Revenue undefined Forecast, by Type 2020 & 2033
- Table 34: Global Meat Analogues Volume K Forecast, by Type 2020 & 2033
- Table 35: Global Meat Analogues Revenue undefined Forecast, by Country 2020 & 2033
- Table 36: Global Meat Analogues Volume K Forecast, by Country 2020 & 2033
- Table 37: United Kingdom Meat Analogues Revenue (undefined) Forecast, by Application 2020 & 2033
- Table 38: United Kingdom Meat Analogues Volume (K) Forecast, by Application 2020 & 2033
- Table 39: Germany Meat Analogues Revenue (undefined) Forecast, by Application 2020 & 2033
- Table 40: Germany Meat Analogues Volume (K) Forecast, by Application 2020 & 2033
- Table 41: France Meat Analogues Revenue (undefined) Forecast, by Application 2020 & 2033
- Table 42: France Meat Analogues Volume (K) Forecast, by Application 2020 & 2033
- Table 43: Italy Meat Analogues Revenue (undefined) Forecast, by Application 2020 & 2033
- Table 44: Italy Meat Analogues Volume (K) Forecast, by Application 2020 & 2033
- Table 45: Spain Meat Analogues Revenue (undefined) Forecast, by Application 2020 & 2033
- Table 46: Spain Meat Analogues Volume (K) Forecast, by Application 2020 & 2033
- Table 47: Russia Meat Analogues Revenue (undefined) Forecast, by Application 2020 & 2033
- Table 48: Russia Meat Analogues Volume (K) Forecast, by Application 2020 & 2033
- Table 49: Benelux Meat Analogues Revenue (undefined) Forecast, by Application 2020 & 2033
- Table 50: Benelux Meat Analogues Volume (K) Forecast, by Application 2020 & 2033
- Table 51: Nordics Meat Analogues Revenue (undefined) Forecast, by Application 2020 & 2033
- Table 52: Nordics Meat Analogues Volume (K) Forecast, by Application 2020 & 2033
- Table 53: Rest of Europe Meat Analogues Revenue (undefined) Forecast, by Application 2020 & 2033
- Table 54: Rest of Europe Meat Analogues Volume (K) Forecast, by Application 2020 & 2033
- Table 55: Global Meat Analogues Revenue undefined Forecast, by Application 2020 & 2033
- Table 56: Global Meat Analogues Volume K Forecast, by Application 2020 & 2033
- Table 57: Global Meat Analogues Revenue undefined Forecast, by Type 2020 & 2033
- Table 58: Global Meat Analogues Volume K Forecast, by Type 2020 & 2033
- Table 59: Global Meat Analogues Revenue undefined Forecast, by Country 2020 & 2033
- Table 60: Global Meat Analogues Volume K Forecast, by Country 2020 & 2033
- Table 61: Turkey Meat Analogues Revenue (undefined) Forecast, by Application 2020 & 2033
- Table 62: Turkey Meat Analogues Volume (K) Forecast, by Application 2020 & 2033
- Table 63: Israel Meat Analogues Revenue (undefined) Forecast, by Application 2020 & 2033
- Table 64: Israel Meat Analogues Volume (K) Forecast, by Application 2020 & 2033
- Table 65: GCC Meat Analogues Revenue (undefined) Forecast, by Application 2020 & 2033
- Table 66: GCC Meat Analogues Volume (K) Forecast, by Application 2020 & 2033
- Table 67: North Africa Meat Analogues Revenue (undefined) Forecast, by Application 2020 & 2033
- Table 68: North Africa Meat Analogues Volume (K) Forecast, by Application 2020 & 2033
- Table 69: South Africa Meat Analogues Revenue (undefined) Forecast, by Application 2020 & 2033
- Table 70: South Africa Meat Analogues Volume (K) Forecast, by Application 2020 & 2033
- Table 71: Rest of Middle East & Africa Meat Analogues Revenue (undefined) Forecast, by Application 2020 & 2033
- Table 72: Rest of Middle East & Africa Meat Analogues Volume (K) Forecast, by Application 2020 & 2033
- Table 73: Global Meat Analogues Revenue undefined Forecast, by Application 2020 & 2033
- Table 74: Global Meat Analogues Volume K Forecast, by Application 2020 & 2033
- Table 75: Global Meat Analogues Revenue undefined Forecast, by Type 2020 & 2033
- Table 76: Global Meat Analogues Volume K Forecast, by Type 2020 & 2033
- Table 77: Global Meat Analogues Revenue undefined Forecast, by Country 2020 & 2033
- Table 78: Global Meat Analogues Volume K Forecast, by Country 2020 & 2033
- Table 79: China Meat Analogues Revenue (undefined) Forecast, by Application 2020 & 2033
- Table 80: China Meat Analogues Volume (K) Forecast, by Application 2020 & 2033
- Table 81: India Meat Analogues Revenue (undefined) Forecast, by Application 2020 & 2033
- Table 82: India Meat Analogues Volume (K) Forecast, by Application 2020 & 2033
- Table 83: Japan Meat Analogues Revenue (undefined) Forecast, by Application 2020 & 2033
- Table 84: Japan Meat Analogues Volume (K) Forecast, by Application 2020 & 2033
- Table 85: South Korea Meat Analogues Revenue (undefined) Forecast, by Application 2020 & 2033
- Table 86: South Korea Meat Analogues Volume (K) Forecast, by Application 2020 & 2033
- Table 87: ASEAN Meat Analogues Revenue (undefined) Forecast, by Application 2020 & 2033
- Table 88: ASEAN Meat Analogues Volume (K) Forecast, by Application 2020 & 2033
- Table 89: Oceania Meat Analogues Revenue (undefined) Forecast, by Application 2020 & 2033
- Table 90: Oceania Meat Analogues Volume (K) Forecast, by Application 2020 & 2033
- Table 91: Rest of Asia Pacific Meat Analogues Revenue (undefined) Forecast, by Application 2020 & 2033
- Table 92: Rest of Asia Pacific Meat Analogues Volume (K) Forecast, by Application 2020 & 2033
Frequently Asked Questions
1. What is the projected Compound Annual Growth Rate (CAGR) of the Meat Analogues?
The projected CAGR is approximately 3.5%.
2. Which companies are prominent players in the Meat Analogues?
Key companies in the market include Beyond Meat, Cargill, Nestle, Vesta Food Lab, Unilever, Omnipork, Impossible Foods, Turtle Island Foods, Maple Leaf, Yves Veggie Cuisine, Kellogg's, Qishan Foods, Hongchang Food, Sulian Food.
3. What are the main segments of the Meat Analogues?
The market segments include Application, Type.
4. Can you provide details about the market size?
The market size is estimated to be USD XXX N/A as of 2022.
5. What are some drivers contributing to market growth?
N/A
6. What are the notable trends driving market growth?
N/A
7. Are there any restraints impacting market growth?
N/A
8. Can you provide examples of recent developments in the market?
N/A
9. What pricing options are available for accessing the report?
Pricing options include single-user, multi-user, and enterprise licenses priced at USD 3950.00, USD 5925.00, and USD 7900.00 respectively.
10. Is the market size provided in terms of value or volume?
The market size is provided in terms of value, measured in N/A and volume, measured in K.
11. Are there any specific market keywords associated with the report?
Yes, the market keyword associated with the report is "Meat Analogues," which aids in identifying and referencing the specific market segment covered.
12. How do I determine which pricing option suits my needs best?
The pricing options vary based on user requirements and access needs. Individual users may opt for single-user licenses, while businesses requiring broader access may choose multi-user or enterprise licenses for cost-effective access to the report.
13. Are there any additional resources or data provided in the Meat Analogues report?
While the report offers comprehensive insights, it's advisable to review the specific contents or supplementary materials provided to ascertain if additional resources or data are available.
14. How can I stay updated on further developments or reports in the Meat Analogues?
To stay informed about further developments, trends, and reports in the Meat Analogues, consider subscribing to industry newsletters, following relevant companies and organizations, or regularly checking reputable industry news sources and publications.
Methodology
Step 1 - Identification of Relevant Samples Size from Population Database


Step 2 - Approaches for Defining Global Market Size (Value, Volume* & Price*)

Note*: In applicable scenarios
Step 3 - Data Sources
Primary Research
- Web Analytics
- Survey Reports
- Research Institute
- Latest Research Reports
- Opinion Leaders
Secondary Research
- Annual Reports
- White Paper
- Latest Press Release
- Industry Association
- Paid Database
- Investor Presentations

Step 4 - Data Triangulation
Involves using different sources of information in order to increase the validity of a study
These sources are likely to be stakeholders in a program - participants, other researchers, program staff, other community members, and so on.
Then we put all data in single framework & apply various statistical tools to find out the dynamic on the market.
During the analysis stage, feedback from the stakeholder groups would be compared to determine areas of agreement as well as areas of divergence