

Key Insights
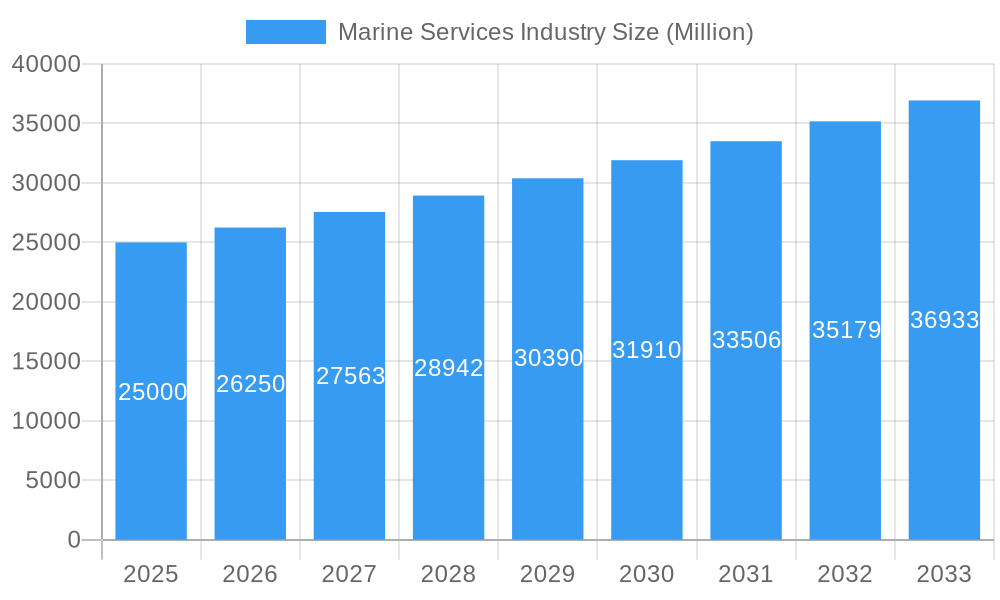
The global marine services market is experiencing robust growth, projected to maintain a Compound Annual Growth Rate (CAGR) exceeding 5% from 2025 to 2033. This expansion is fueled by several key drivers. The increasing global trade volume necessitates efficient container handling and logistics solutions, driving demand for port services and related infrastructure. Furthermore, the aging global fleet necessitates significant investment in ship repair and maintenance, contributing substantially to market growth. The growing adoption of advanced technologies such as digitalization and automation within port operations and supply chain management further enhances efficiency and profitability, boosting market expansion. While regulatory changes and environmental concerns pose some restraints, the overall market trajectory remains positive, driven by the ever-increasing demand for maritime transport and related services.
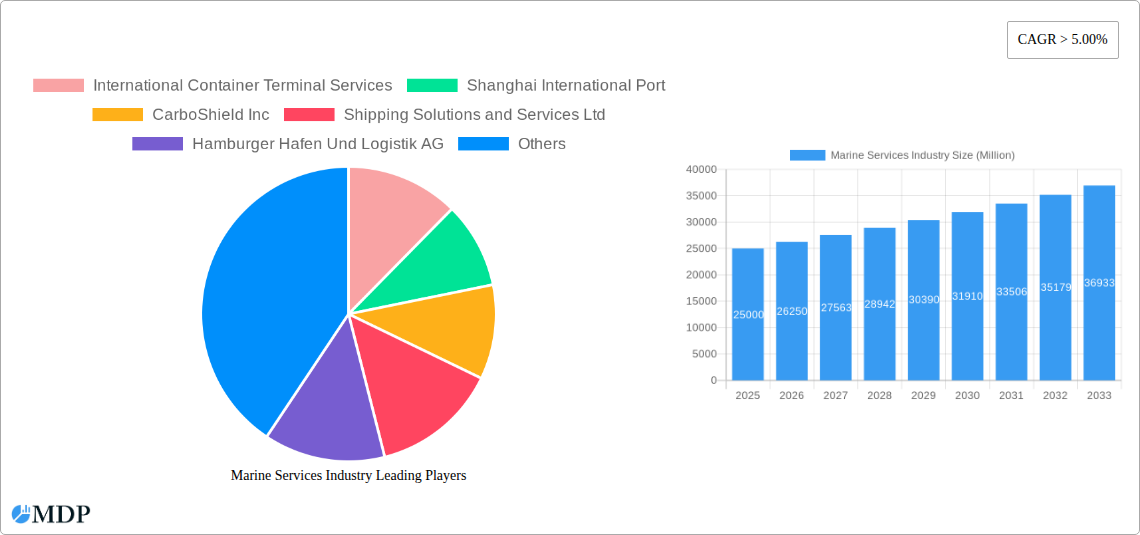
Marine Services Industry Market Size (In Billion)
Segment-wise, container handling services dominate the market, followed by ship repair and maintenance. The Asia-Pacific region, particularly China and India, is expected to be a major growth engine due to its rapidly expanding trade activities and port infrastructure development. North America and Europe, while mature markets, will continue to contribute significantly to the overall market size due to their established economies and robust maritime sectors. Key players like International Container Terminal Services, DP World Limited, and AP Moller Maersk are strategically positioning themselves to capitalize on these growth opportunities through expansion, technological advancements, and strategic acquisitions. The forecast period reveals consistent growth across all segments and regions, emphasizing the long-term stability and potential of this sector. Competition is intense, with established players and emerging companies vying for market share through service differentiation, cost optimization, and technological innovation.
Marine Services Industry Company Market Share
Marine Services Industry Market Report: 2019-2033 Forecast
Dive into this comprehensive report offering a detailed analysis of the Marine Services Industry, projecting a market value of $XX million by 2033. This in-depth study covers market dynamics, leading players, key trends, and future opportunities, providing actionable insights for stakeholders across the global marine sector. The report utilizes data from the historical period (2019-2024), base year (2025), and forecast period (2025-2033) to deliver a robust and reliable analysis. Maximize your understanding of this dynamic industry and gain a competitive edge.
Marine Services Industry Market Dynamics & Concentration
The global marine services market, valued at $XX million in 2025, is characterized by moderate concentration, with a handful of major players holding significant market share. International Container Terminal Services, DP World Limited, and AP Moller Maersk represent some of the industry giants. However, the market also exhibits a significant number of smaller, specialized firms catering to niche segments. Market concentration is influenced by factors such as economies of scale, technological advancements, and regulatory changes.
- Market Share: Top 5 players hold approximately XX% of the market share in 2025, with DP World Limited projected to have the largest share at approximately xx%.
- Innovation Drivers: Automation, digitalization, and sustainable solutions are key drivers, pushing innovation in areas like autonomous vessels, smart ports, and eco-friendly technologies.
- Regulatory Frameworks: Stringent environmental regulations (IMO 2020, etc.) and safety standards significantly impact market dynamics, driving adoption of cleaner technologies and improved safety measures.
- Product Substitutes: Limited direct substitutes exist; however, technological advancements lead to improved efficiency and cost-effectiveness within the existing service portfolio.
- End-User Trends: Growing global trade volume, increasing demand for efficient logistics solutions, and the need for port modernization are key end-user trends driving market expansion.
- M&A Activities: The industry has witnessed a significant number of mergers and acquisitions (M&As) in recent years (XX deals in the last 5 years). These activities aim to expand market reach, increase efficiency, and diversify service offerings. Examples include the acquisition of APM Terminals Rotterdam by Hutchison Ports in 2021.
Marine Services Industry Industry Trends & Analysis
The marine services market is experiencing robust growth, with a projected Compound Annual Growth Rate (CAGR) of XX% during the forecast period (2025-2033). Several factors contribute to this expansion. Rising global trade volumes continue to drive demand for efficient container handling, logistics, and other marine services. Technological advancements, such as the implementation of AI and big data analytics in port operations, are leading to significant efficiency gains. Increased automation minimizes operational costs while enhancing safety and productivity. Furthermore, the shift toward sustainable practices and green technologies presents substantial growth opportunities. The market penetration of autonomous vessels is still relatively low, but its projected growth indicates a significant impact in the coming years. The competitive landscape is dynamic, with existing players constantly innovating and new entrants emerging. Consumer preference increasingly leans towards cost-effective, reliable, and sustainable solutions. Price competition and service differentiation remain key strategic elements.
Leading Markets & Segments in Marine Services Industry
Asia, specifically regions like East Asia and Southeast Asia, dominate the marine services market, driven by robust economic growth, increasing trade volumes, and substantial investments in port infrastructure development. Within the service segments, Container Handling Services currently holds the largest market share, followed by Supply Chain and Logistics Solutions.
Key Drivers for Leading Regions/Segments:
- Asia (Specifically East and Southeast Asia): Rapid economic expansion, high trade volumes, significant investments in port infrastructure, and supportive government policies.
- Container Handling Services: High demand from global trade, technological advancements leading to increased efficiency, and the concentration of major container terminals in key regions.
- Supply Chain & Logistics Solutions: Growing e-commerce, increasing demand for integrated supply chain management, and technological advancements enabling real-time tracking and optimization.
Dominance Analysis: The dominance of Asia in container handling can be attributed to its status as a global manufacturing and trading hub. The significant investment in port infrastructure further solidifies its position. Similarly, the growth in e-commerce across Asia directly contributes to the rising demand for robust and efficient supply chain solutions.
Marine Services Industry Product Developments
Recent product innovations include advanced automation systems for container handling, digital twin technology for port optimization, and the adoption of AI-powered predictive maintenance for vessel repair and maintenance. These advancements improve efficiency, reduce operational costs, and enhance safety. The market fit is evident in the increased adoption by major players seeking competitive advantages.
Key Drivers of Marine Services Industry Growth
Technological advancements, such as automation and AI, are dramatically increasing efficiency and reducing operational costs in port operations and vessel maintenance. The continuous growth of global trade and e-commerce fuels the demand for robust and efficient logistics solutions. Supportive government policies and investments in port infrastructure projects further propel market expansion. The example of DP World's partnership with the Saudi Ports Authority demonstrates the significant investment in port-centric logistics parks.
Challenges in the Marine Services Industry Market
Stringent environmental regulations and the increasing cost of compliance present significant challenges. Supply chain disruptions and geopolitical instability can impact the availability of resources and equipment. Intense competition among established players and the emergence of new entrants create pressure on pricing and profitability. For example, the XX% increase in fuel costs in 2022 directly impacted operational expenditure for many companies.
Emerging Opportunities in Marine Services Industry
The integration of advanced technologies like AI, big data, and IoT offers significant opportunities for optimization across the value chain. Strategic partnerships and collaborations are fostering innovation and enabling access to new markets. The expansion into emerging economies, especially in Africa and South America, represents a substantial growth potential. The development of sustainable and eco-friendly technologies is driving innovation and creating new market niches.
Leading Players in the Marine Services Industry Sector
- International Container Terminal Services
- Shanghai International Port (Website unavailable)
- CarboShield Inc (Website unavailable)
- Shipping Solutions and Services Ltd (Website unavailable)
- Hamburger Hafen Und Logistik AG
- TomWorks LLC (Website unavailable)
- Montreal Port Authority
- DP World Limited
- Tianjin Port Development Holdings Ltd (Website unavailable)
- AP Moller Maersk
Key Milestones in Marine Services Industry Industry
- June 2022: DP World and Saudi Ports Authority announce a $133.33 million investment in a new logistics park at Jeddah Islamic Port. This signifies a major expansion in port-centric logistics infrastructure.
- May 2021: Hutchison Ports acquires APM Terminals Rotterdam, consolidating market share in the European container handling sector.
- May 2021: Régie du Terminal à Conteneurs (RTC) orders new harbor cranes, indicating investments in improving container handling capacity in Cameroon.
Strategic Outlook for Marine Services Industry Market
The marine services industry is poised for continued growth, driven by technological innovation, expanding global trade, and investments in infrastructure. Strategic partnerships and a focus on sustainability will be key factors for success. Companies that embrace automation, digitalization, and green technologies will gain a competitive edge in this rapidly evolving landscape. The projected market expansion creates numerous opportunities for growth and diversification within the sector.
Marine Services Industry Segmentation
-
1. Service Analysis
- 1.1. Container Handling Services
- 1.2. Ship repair and maintenance services
- 1.3. Supply Chain
- 1.4. Mechanical and Electrical Engineering Services
- 1.5. Navigation Services
- 1.6. Logistics Solutions
Marine Services Industry Segmentation By Geography
-
1. North America
- 1.1. US
- 1.2. Canada
- 1.3. Mexico
-
2. Europe
- 2.1. Germany
- 2.2. UK
- 2.3. France
- 2.4. Russia
- 2.5. Spain
- 2.6. Rest of Europe
-
3. Asia Pacific
- 3.1. India
- 3.2. China
- 3.3. Japan
- 3.4. Australia
- 3.5. Singapore
- 3.6. Malaysia
- 3.7. South Korea
- 3.8. Rest of Asia Pacific
-
4. South America
- 4.1. Brazil
- 4.2. Argentina
- 4.3. Rest Of South America
- 5. Middle East
-
6. UAE
- 6.1. Saudi Arabia
- 6.2. South Africa
- 6.3. Others
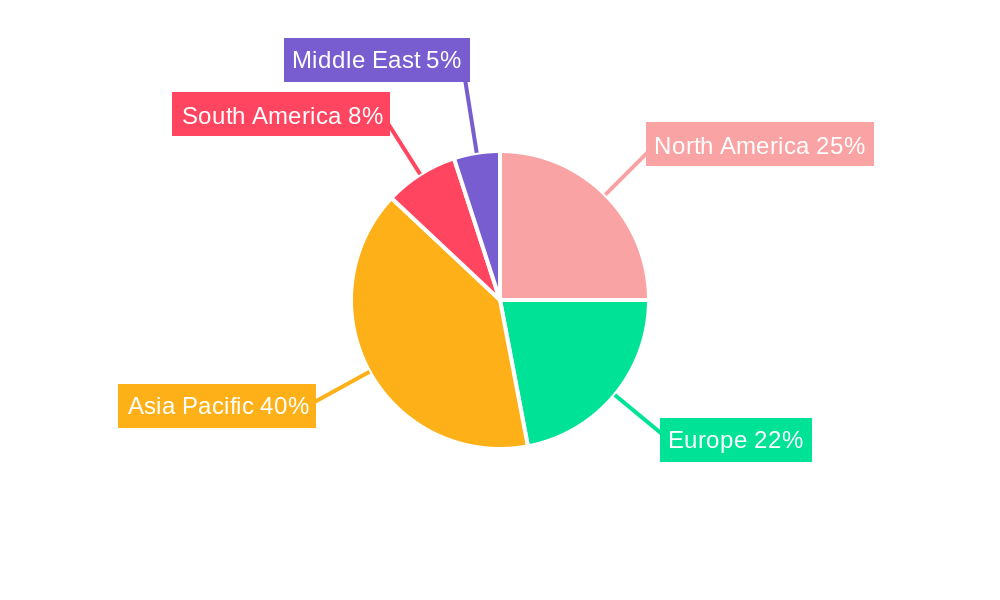
Marine Services Industry Regional Market Share
Geographic Coverage of Marine Services Industry
Marine Services Industry REPORT HIGHLIGHTS
| Aspects | Details |
|---|---|
| Study Period | 2020-2034 |
| Base Year | 2025 |
| Estimated Year | 2026 |
| Forecast Period | 2026-2034 |
| Historical Period | 2020-2025 |
| Growth Rate | CAGR of > 5.00% from 2020-2034 |
| Segmentation |
|
Table of Contents
- 1. Introduction
- 1.1. Research Scope
- 1.2. Market Segmentation
- 1.3. Research Objective
- 1.4. Definitions and Assumptions
- 2. Executive Summary
- 2.1. Market Snapshot
- 3. Market Dynamics
- 3.1. Market Drivers
- 3.2. Market Restrains
- 3.3. Market Trends
- 3.4. Market Opportunities
- 4. Market Factor Analysis
- 4.1. Porters Five Forces
- 4.1.1. Bargaining Power of Suppliers
- 4.1.2. Bargaining Power of Buyers
- 4.1.3. Threat of New Entrants
- 4.1.4. Threat of Substitutes
- 4.1.5. Competitive Rivalry
- 4.2. PESTEL analysis
- 4.3. BCG Analysis
- 4.3.1. Stars (High Growth, High Market Share)
- 4.3.2. Cash Cows (Low Growth, High Market Share)
- 4.3.3. Question Mark (High Growth, Low Market Share)
- 4.3.4. Dogs (Low Growth, Low Market Share)
- 4.4. Ansoff Matrix Analysis
- 4.5. Supply Chain Analysis
- 4.6. Regulatory Landscape
- 4.7. Current Market Potential and Opportunity Assessment (TAM–SAM–SOM Framework)
- 4.8. MDP Analyst Note
- 4.1. Porters Five Forces
- 5. Market Analysis, Insights and Forecast 2021-2033
- 5.1. Market Analysis, Insights and Forecast - by Service Analysis
- 5.1.1. Container Handling Services
- 5.1.2. Ship repair and maintenance services
- 5.1.3. Supply Chain
- 5.1.4. Mechanical and Electrical Engineering Services
- 5.1.5. Navigation Services
- 5.1.6. Logistics Solutions
- 5.2. Market Analysis, Insights and Forecast - by Region
- 5.2.1. North America
- 5.2.2. Europe
- 5.2.3. Asia Pacific
- 5.2.4. South America
- 5.2.5. Middle East
- 5.2.6. UAE
- 5.1. Market Analysis, Insights and Forecast - by Service Analysis
- 6. Global Marine Services Industry Analysis, Insights and Forecast, 2021-2033
- 6.1. Market Analysis, Insights and Forecast - by Service Analysis
- 6.1.1. Container Handling Services
- 6.1.2. Ship repair and maintenance services
- 6.1.3. Supply Chain
- 6.1.4. Mechanical and Electrical Engineering Services
- 6.1.5. Navigation Services
- 6.1.6. Logistics Solutions
- 6.1. Market Analysis, Insights and Forecast - by Service Analysis
- 7. North America Marine Services Industry Analysis, Insights and Forecast, 2020-2032
- 7.1. Market Analysis, Insights and Forecast - by Service Analysis
- 7.1.1. Container Handling Services
- 7.1.2. Ship repair and maintenance services
- 7.1.3. Supply Chain
- 7.1.4. Mechanical and Electrical Engineering Services
- 7.1.5. Navigation Services
- 7.1.6. Logistics Solutions
- 7.1. Market Analysis, Insights and Forecast - by Service Analysis
- 8. Europe Marine Services Industry Analysis, Insights and Forecast, 2020-2032
- 8.1. Market Analysis, Insights and Forecast - by Service Analysis
- 8.1.1. Container Handling Services
- 8.1.2. Ship repair and maintenance services
- 8.1.3. Supply Chain
- 8.1.4. Mechanical and Electrical Engineering Services
- 8.1.5. Navigation Services
- 8.1.6. Logistics Solutions
- 8.1. Market Analysis, Insights and Forecast - by Service Analysis
- 9. Asia Pacific Marine Services Industry Analysis, Insights and Forecast, 2020-2032
- 9.1. Market Analysis, Insights and Forecast - by Service Analysis
- 9.1.1. Container Handling Services
- 9.1.2. Ship repair and maintenance services
- 9.1.3. Supply Chain
- 9.1.4. Mechanical and Electrical Engineering Services
- 9.1.5. Navigation Services
- 9.1.6. Logistics Solutions
- 9.1. Market Analysis, Insights and Forecast - by Service Analysis
- 10. South America Marine Services Industry Analysis, Insights and Forecast, 2020-2032
- 10.1. Market Analysis, Insights and Forecast - by Service Analysis
- 10.1.1. Container Handling Services
- 10.1.2. Ship repair and maintenance services
- 10.1.3. Supply Chain
- 10.1.4. Mechanical and Electrical Engineering Services
- 10.1.5. Navigation Services
- 10.1.6. Logistics Solutions
- 10.1. Market Analysis, Insights and Forecast - by Service Analysis
- 11. Middle East Marine Services Industry Analysis, Insights and Forecast, 2020-2032
- 11.1. Market Analysis, Insights and Forecast - by Service Analysis
- 11.1.1. Container Handling Services
- 11.1.2. Ship repair and maintenance services
- 11.1.3. Supply Chain
- 11.1.4. Mechanical and Electrical Engineering Services
- 11.1.5. Navigation Services
- 11.1.6. Logistics Solutions
- 11.1. Market Analysis, Insights and Forecast - by Service Analysis
- 12. UAE Marine Services Industry Analysis, Insights and Forecast, 2020-2032
- 12.1. Market Analysis, Insights and Forecast - by Service Analysis
- 12.1.1. Container Handling Services
- 12.1.2. Ship repair and maintenance services
- 12.1.3. Supply Chain
- 12.1.4. Mechanical and Electrical Engineering Services
- 12.1.5. Navigation Services
- 12.1.6. Logistics Solutions
- 12.1. Market Analysis, Insights and Forecast - by Service Analysis
- 13. Competitive Analysis
- 13.1. Company Profiles
- 13.1.1 International Container Terminal Services
- 13.1.1.1. Company Overview
- 13.1.1.2. Products
- 13.1.1.3. Company Financials
- 13.1.1.4. SWOT Analysis
- 13.1.2 Shanghai International Port
- 13.1.2.1. Company Overview
- 13.1.2.2. Products
- 13.1.2.3. Company Financials
- 13.1.2.4. SWOT Analysis
- 13.1.3 CarboShield Inc
- 13.1.3.1. Company Overview
- 13.1.3.2. Products
- 13.1.3.3. Company Financials
- 13.1.3.4. SWOT Analysis
- 13.1.4 Shipping Solutions and Services Ltd
- 13.1.4.1. Company Overview
- 13.1.4.2. Products
- 13.1.4.3. Company Financials
- 13.1.4.4. SWOT Analysis
- 13.1.5 Hamburger Hafen Und Logistik AG
- 13.1.5.1. Company Overview
- 13.1.5.2. Products
- 13.1.5.3. Company Financials
- 13.1.5.4. SWOT Analysis
- 13.1.6 TomWorks LLC
- 13.1.6.1. Company Overview
- 13.1.6.2. Products
- 13.1.6.3. Company Financials
- 13.1.6.4. SWOT Analysis
- 13.1.7 Montreal Port Authority**List Not Exhaustive
- 13.1.7.1. Company Overview
- 13.1.7.2. Products
- 13.1.7.3. Company Financials
- 13.1.7.4. SWOT Analysis
- 13.1.8 DP World Limited
- 13.1.8.1. Company Overview
- 13.1.8.2. Products
- 13.1.8.3. Company Financials
- 13.1.8.4. SWOT Analysis
- 13.1.9 Tianjin Port Development Holdings Ltd
- 13.1.9.1. Company Overview
- 13.1.9.2. Products
- 13.1.9.3. Company Financials
- 13.1.9.4. SWOT Analysis
- 13.1.10 AP Moller Maersk
- 13.1.10.1. Company Overview
- 13.1.10.2. Products
- 13.1.10.3. Company Financials
- 13.1.10.4. SWOT Analysis
- 13.1.1 International Container Terminal Services
- 13.2. Market Entropy
- 13.2.1 Company's Key Areas Served
- 13.2.2 Recent Developments
- 13.3. Company Market Share Analysis 2025
- 13.3.1 Top 5 Companies Market Share Analysis
- 13.3.2 Top 3 Companies Market Share Analysis
- 13.4. List of Potential Customers
- 14. Research Methodology
List of Figures
- Figure 1: Global Marine Services Industry Revenue Breakdown (Million, %) by Region 2025 & 2033
- Figure 2: North America Marine Services Industry Revenue (Million), by Service Analysis 2025 & 2033
- Figure 3: North America Marine Services Industry Revenue Share (%), by Service Analysis 2025 & 2033
- Figure 4: North America Marine Services Industry Revenue (Million), by Country 2025 & 2033
- Figure 5: North America Marine Services Industry Revenue Share (%), by Country 2025 & 2033
- Figure 6: Europe Marine Services Industry Revenue (Million), by Service Analysis 2025 & 2033
- Figure 7: Europe Marine Services Industry Revenue Share (%), by Service Analysis 2025 & 2033
- Figure 8: Europe Marine Services Industry Revenue (Million), by Country 2025 & 2033
- Figure 9: Europe Marine Services Industry Revenue Share (%), by Country 2025 & 2033
- Figure 10: Asia Pacific Marine Services Industry Revenue (Million), by Service Analysis 2025 & 2033
- Figure 11: Asia Pacific Marine Services Industry Revenue Share (%), by Service Analysis 2025 & 2033
- Figure 12: Asia Pacific Marine Services Industry Revenue (Million), by Country 2025 & 2033
- Figure 13: Asia Pacific Marine Services Industry Revenue Share (%), by Country 2025 & 2033
- Figure 14: South America Marine Services Industry Revenue (Million), by Service Analysis 2025 & 2033
- Figure 15: South America Marine Services Industry Revenue Share (%), by Service Analysis 2025 & 2033
- Figure 16: South America Marine Services Industry Revenue (Million), by Country 2025 & 2033
- Figure 17: South America Marine Services Industry Revenue Share (%), by Country 2025 & 2033
- Figure 18: Middle East Marine Services Industry Revenue (Million), by Service Analysis 2025 & 2033
- Figure 19: Middle East Marine Services Industry Revenue Share (%), by Service Analysis 2025 & 2033
- Figure 20: Middle East Marine Services Industry Revenue (Million), by Country 2025 & 2033
- Figure 21: Middle East Marine Services Industry Revenue Share (%), by Country 2025 & 2033
- Figure 22: UAE Marine Services Industry Revenue (Million), by Service Analysis 2025 & 2033
- Figure 23: UAE Marine Services Industry Revenue Share (%), by Service Analysis 2025 & 2033
- Figure 24: UAE Marine Services Industry Revenue (Million), by Country 2025 & 2033
- Figure 25: UAE Marine Services Industry Revenue Share (%), by Country 2025 & 2033
List of Tables
- Table 1: Global Marine Services Industry Revenue Million Forecast, by Service Analysis 2020 & 2033
- Table 2: Global Marine Services Industry Revenue Million Forecast, by Region 2020 & 2033
- Table 3: Global Marine Services Industry Revenue Million Forecast, by Service Analysis 2020 & 2033
- Table 4: Global Marine Services Industry Revenue Million Forecast, by Country 2020 & 2033
- Table 5: US Marine Services Industry Revenue (Million) Forecast, by Application 2020 & 2033
- Table 6: Canada Marine Services Industry Revenue (Million) Forecast, by Application 2020 & 2033
- Table 7: Mexico Marine Services Industry Revenue (Million) Forecast, by Application 2020 & 2033
- Table 8: Global Marine Services Industry Revenue Million Forecast, by Service Analysis 2020 & 2033
- Table 9: Global Marine Services Industry Revenue Million Forecast, by Country 2020 & 2033
- Table 10: Germany Marine Services Industry Revenue (Million) Forecast, by Application 2020 & 2033
- Table 11: UK Marine Services Industry Revenue (Million) Forecast, by Application 2020 & 2033
- Table 12: France Marine Services Industry Revenue (Million) Forecast, by Application 2020 & 2033
- Table 13: Russia Marine Services Industry Revenue (Million) Forecast, by Application 2020 & 2033
- Table 14: Spain Marine Services Industry Revenue (Million) Forecast, by Application 2020 & 2033
- Table 15: Rest of Europe Marine Services Industry Revenue (Million) Forecast, by Application 2020 & 2033
- Table 16: Global Marine Services Industry Revenue Million Forecast, by Service Analysis 2020 & 2033
- Table 17: Global Marine Services Industry Revenue Million Forecast, by Country 2020 & 2033
- Table 18: India Marine Services Industry Revenue (Million) Forecast, by Application 2020 & 2033
- Table 19: China Marine Services Industry Revenue (Million) Forecast, by Application 2020 & 2033
- Table 20: Japan Marine Services Industry Revenue (Million) Forecast, by Application 2020 & 2033
- Table 21: Australia Marine Services Industry Revenue (Million) Forecast, by Application 2020 & 2033
- Table 22: Singapore Marine Services Industry Revenue (Million) Forecast, by Application 2020 & 2033
- Table 23: Malaysia Marine Services Industry Revenue (Million) Forecast, by Application 2020 & 2033
- Table 24: South Korea Marine Services Industry Revenue (Million) Forecast, by Application 2020 & 2033
- Table 25: Rest of Asia Pacific Marine Services Industry Revenue (Million) Forecast, by Application 2020 & 2033
- Table 26: Global Marine Services Industry Revenue Million Forecast, by Service Analysis 2020 & 2033
- Table 27: Global Marine Services Industry Revenue Million Forecast, by Country 2020 & 2033
- Table 28: Brazil Marine Services Industry Revenue (Million) Forecast, by Application 2020 & 2033
- Table 29: Argentina Marine Services Industry Revenue (Million) Forecast, by Application 2020 & 2033
- Table 30: Rest Of South America Marine Services Industry Revenue (Million) Forecast, by Application 2020 & 2033
- Table 31: Global Marine Services Industry Revenue Million Forecast, by Service Analysis 2020 & 2033
- Table 32: Global Marine Services Industry Revenue Million Forecast, by Country 2020 & 2033
- Table 33: Global Marine Services Industry Revenue Million Forecast, by Service Analysis 2020 & 2033
- Table 34: Global Marine Services Industry Revenue Million Forecast, by Country 2020 & 2033
- Table 35: Saudi Arabia Marine Services Industry Revenue (Million) Forecast, by Application 2020 & 2033
- Table 36: South Africa Marine Services Industry Revenue (Million) Forecast, by Application 2020 & 2033
- Table 37: Others Marine Services Industry Revenue (Million) Forecast, by Application 2020 & 2033
Frequently Asked Questions
1. What is the projected Compound Annual Growth Rate (CAGR) of the Marine Services Industry?
The projected CAGR is approximately > 5.00%.
2. Which companies are prominent players in the Marine Services Industry?
Key companies in the market include International Container Terminal Services, Shanghai International Port, CarboShield Inc, Shipping Solutions and Services Ltd, Hamburger Hafen Und Logistik AG, TomWorks LLC, Montreal Port Authority**List Not Exhaustive, DP World Limited, Tianjin Port Development Holdings Ltd, AP Moller Maersk.
3. What are the main segments of the Marine Services Industry?
The market segments include Service Analysis.
4. Can you provide details about the market size?
The market size is estimated to be USD XX Million as of 2022.
5. What are some drivers contributing to market growth?
The rise in online shopping and consumer demand for fast delivery; Rise in cross-border trade activities.
6. What are the notable trends driving market growth?
Increasing Maritime Trade.
7. Are there any restraints impacting market growth?
Poor infrastructure and higher logistics costs.
8. Can you provide examples of recent developments in the market?
On 19 June 2022, DP World and the Saudi Ports Authority announce a major new partnership for the Jeddah logistics park. This is a 30-year agreement with an investment value of more than SAR 500 million (USD 133.33 million) to build a state-of-the-art, port-centric Logistics Park at the Jeddah Islamic Port. The agreement aims to establish a logistics park that spans over 415,000 square meters, with an in-land container depot capacity of approximately 250,000 TEU and a warehousing storage space of 100,000 square meters. Future expansions could increase the storage space to 200,000 square meters.
9. What pricing options are available for accessing the report?
Pricing options include single-user, multi-user, and enterprise licenses priced at USD 4750, USD 5250, and USD 8750 respectively.
10. Is the market size provided in terms of value or volume?
The market size is provided in terms of value, measured in Million.
11. Are there any specific market keywords associated with the report?
Yes, the market keyword associated with the report is "Marine Services Industry," which aids in identifying and referencing the specific market segment covered.
12. How do I determine which pricing option suits my needs best?
The pricing options vary based on user requirements and access needs. Individual users may opt for single-user licenses, while businesses requiring broader access may choose multi-user or enterprise licenses for cost-effective access to the report.
13. Are there any additional resources or data provided in the Marine Services Industry report?
While the report offers comprehensive insights, it's advisable to review the specific contents or supplementary materials provided to ascertain if additional resources or data are available.
14. How can I stay updated on further developments or reports in the Marine Services Industry?
To stay informed about further developments, trends, and reports in the Marine Services Industry, consider subscribing to industry newsletters, following relevant companies and organizations, or regularly checking reputable industry news sources and publications.
Methodology
Step 1 - Identification of Relevant Samples Size from Population Database


Step 2 - Approaches for Defining Global Market Size (Value, Volume* & Price*)

Note*: In applicable scenarios
Step 3 - Data Sources
Primary Research
- Web Analytics
- Survey Reports
- Research Institute
- Latest Research Reports
- Opinion Leaders
Secondary Research
- Annual Reports
- White Paper
- Latest Press Release
- Industry Association
- Paid Database
- Investor Presentations

Step 4 - Data Triangulation
Involves using different sources of information in order to increase the validity of a study
These sources are likely to be stakeholders in a program - participants, other researchers, program staff, other community members, and so on.
Then we put all data in single framework & apply various statistical tools to find out the dynamic on the market.
During the analysis stage, feedback from the stakeholder groups would be compared to determine areas of agreement as well as areas of divergence